EIectrophoresis 1998, 19, 3149-3153 CZE of kbp sized &DNA in PEO solutions with electroosmotic flow 3149
Hsuan-Shen Chen
Capillary electrophoretic separation of 1 to
10
kbp
sized
dsDNA using poly(ethy1ene oxide) solutions in the presence
of electroosmotic counterflow
Huan-Tsung Chang
Department of Chemistry, National Taiwan University,
Taipei, Taiwan DNA fragments (CE), using poly(ethy1ene oxide) (PEO) solutions in the presence of electroosmotic of 1 to 10 kbp in length were separated by capillary electrophoresis
flow. The technique requires filling the capillary with the polymer solution by means of electroosmotic flow (EOF). Separation times of 6-7 rnin in PEO solutions ranging from 0.3 to 8 X lo6
M,
at 375 V/cm were sufficient to separate the 11 components of the dsDNA ladder (0.5 to 10 kbp) by size. The migration behavior of the double-stranded (ds)DNA fragments, interpreted by “Ferguson plot analysis”, in the system is indistinguishable from that previously reported for capillary zone electrophoresis (CZE) in a polyacrylamide solution without EOF. Potential advantages of conducting CZE using polymer solutions in the presence of EOF are: (i) Possibility of long migration times on short columns; (ii) possibility of introducing relatively viscous, highM,
polymer solutions into narrow capillaries; (iii) possibility of establishing polymer concentration gradients in capillaries; (iv) possibility of concentrating the starting zone by balancing electrophoretic migration and electroosmotic transport.1 Introduction
Previous CE analyses of kbp sized dsDNA in polymer solutions at concentrations above the entanglement thresh- old (“networks”) have always been conducted with the suppression of EOF in solutions of uncrosslinked poly- acrylamide [ 1, 21, poly(N-acroylaminoethoxyethanol [3], cellulose derivatives C4-61 and agarose derivatives [7]. EOF was suppressed by inner wall coating in all of these applications presumably to avoid the flow of polymer solution out of the capillary and to prevent interactions of the analyte and/or contaminant proteins with the inner wall of the capillary. There are, however, potential advantages to conducting electrophoretic separations in the presence of EOF especially to the “semi-dilute” regime of polymer solutions, i.e. the concentration range which derives its resolving power from the commensurate dimensions of the screening length of the polymer network and the diameter of the analyte 181. Such potential advantages are: (i) Filling
of the capillary by EOF in lieu of the mechanical introduction of the polymer solution, an advantage in the application to viscous polymers and narrow capillaries; (ii) effective slowdown of migration allowing for long migration times (low field strength) in short capillaries; (iii) the possibility of establishing polymer concentration gradients in capillaries; and (iv) the possibility of starting
zone concentration through a balance between migration and electroosmosis. The present work tests the effectiveness of CE separations of dsDNA fragments of 0.5 to 10 kbp in length, using PEO solutions in the “semi-dilute regime” when EOF is present. The effectiveness can be maximized through pretreatment of the silicate capillaries with NaOH,
Correspondence: Dr. Huan-Tsung Chang, Department of Chemistry, National Taiwan University, Taipei, Taiwan, ROC (Tel:/Fax: +886-2- 23621963; E-mail: [email protected])
Abbreviations: PEO, poly(ethy1ene oxide); TBE, Tns-boric acid-EDTA Keywords: Poly(ethy1ene oxide) solution / kbp-sized dsDNA I Capillary electrophoresis / Electroosmotic flow
which results in a reversal in the order of size separation when EOF exceeds the electrophoretic migration rate.
2
Materials and methods
2.1 dsDNA fragments
Kilobase dsDNA marker (Pharmacia, Cat. No. 27-4004-01, Uppsala, Sweden) was used.
2.2 Polymer
Poly(ethy1ene oxide) of M, 8 X
lo6
(No. 37283-8), 4 X lo6(No. 18-946-4), 1 X lo6 (No. 37278-l), 0.6 X lo6 (No. 18202-8), 0.3 X lo6 (No. 18200-1) was obtained from Aldrich (Milwaukee, WI, USA). The entanglement thresh- old, c*, for PEO of the various M;s was given by Table 2 of [8]. PEO solutions were prepared at 85-90 OC with gradual addition of the solid to the stirred solutions, followed by at least 1 h of continued magnetic stirring. The solution was degassed by house vacuum, with a suction flask positioned in a ultrasonicator, and stored at 4OC. Degassing was repeated prior to use. Solutions were used within 1 week of preparation.
2.3 CE apparatus
The basic design of the separation system has previously been described [9]. A 30 kV power supply (Gamma High Voltage Research, Ormond Beach,
FL,
USA) was used. The entire detection system was enclosed in a black box with a HV interlock. The high voltage end of the separation system was put in a homemade plexiglass box for safety. A 1.5-mW He-Ne laser with 543.6 nm output (Melies Griot, Irvine, CA, USA) was used for excitation. The light was collected with alox
objextive (N. A. = 0.25). One RG 610cutoff filter was used to block scattered light before the emitted light reaches the photomultiplier tube (Hamamatsu R928, Shizuoka-ken, Japan). The fluorescence signal was directly transferred through a 10-WZ resistor to a 24-bit
A/D
interface at 10
HZ
(Bonvin, JMBS Developments, le3150 H . 4 . Chen and H.-T. Chang Electrophoresis 1998, 19, 3149-3153
Fontanil, France) and stored in a PC. Capillaries of 75 pm ID and 365 pm OD and 40 cm length (Polymicro Technologies, Phoenix,
AZ,
USA) were used without modification. Prior to use, they were filled with 0.5 MNaOH for 1 h.
2.4 CE procedure
The capillary was pressure injected with 0.089 M Tris,
0.089 M boric acid, 0.002 M NazEDTA (1X TBE) containing
5 pg/mL ethidium bromide (EtB). A 1/10 diluted dsDNA
preparation was injected at 1 kV for 5 s. The buffer vessels were exchanged for PEO solution and CE was conducted at 375 V/cm. The EtB labeled dsDNA fragments were detected by fluorescence optics.
2.5 Data processing
Mobilities (cm*/sV) were calculated from the computer output of migration times. Non-linear Ferguson plots (log mobility vs. polymer concentration) were obtained by EXCEL program. The local slopes of those plots, K‘ R, were
calculated as previously defined (Section 2.3 of [lo]). Geometric mean radii of dsDNA fragments were calculated by Eq. (10) of [l 11. EOF was evaluated according to the time t, at which the baseline shift from that of the buffer to that of the polymer solution where
EOF =
(Z
X Zd) / ( t X V)and
I
is the length of capillary, Zd the length to the detector,and V the voltage.
3
Results
3.1 Separation of the constituent dsDNA fragments of the kilobase ladder in the presence of EOF in PEO solution networks formed by polymers of different
M r
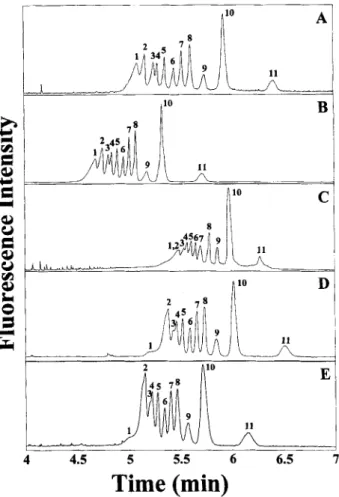
The dsDNA fragment pattern of the ladder obtained at 375 V/cm in presence of EOF in 0.5-1 .O% solutions of PEO in the
M,
range of 8 to 0.3 X lo6 (Panels A to E) resolves the 11 dsDNA species uniformly (Fig. 1). Since EOF under the conditions used exceeds migration rates, the order of size separation is reversed compared to that observed without EOF. Differences in migration rates between CE at various PEO concentrations, shown in Panels A to E, relate to theirreproducibility of EOF (see Section 3.2). Minor variations in the gel pattern depend on whether the PEO concen- trations lie above c* (Panels A, B and C), at (Panel D) or
below c* (Panel E). The separations in the “semi-dilute”
regime apparently resolve the small species 1 to 5, while in or at the “dilute” regime peak heights, 2 to 5 decrease with increasing length of dsDNA, suggesting that the peaks of the largest components contain unresolved mixtures. In particular, peak 1 appears unresolved. Suitable concen- tration ranges of PEO for separation of the components of the 1 I-member dsDNA ladder, using PEO of different
Mi's
in the presence of EOF, are listed in Table 1.
to
A
1s
II
c
4.5 5 5.5 6 6.5 7
Time (min)
Figure 1. Representative CE separations of kbp sized dsDNA fragments in the presence of EOF, using PEO solutions: CE at 15 kV; capillary length: 40 cm; buffer: 1 X TBE containing 5 pg/mL ethidium bromide; polymer:
(A) PEO, of OS%, M , 8 X lo6, (B) 0.5%, M, 4 X lo6, (C) 0.5%, M , 1 X lo6, (D) 1%, M , 0.6 X906 and (E) 0.5%, M, 0.3 X lo6. dsDNA lengths (kbp):
(1) 10, (2) 8, (3) 6, (4) 5, (5) 4, (6) 3, (7) 2.5, (8) 2, (9) 1.5, (10) 1, (1 1) 0.5.
Table 1. Suitable concentration ranges of PEO for separation of kbp-sized dsDNA in the presence of EOF
~~
PEO Concentration range Separation window M, X lo6
(a)
( m i d 8 > 0.03a) (0.5) 5.14.4 4 > 0.10b’ (1.0) 4.4-5.0 0.6 0.2-0.5 (1.0) 5.2-6.5 0.3 0.5-1.0 (1.0) 5.0-6.1 1 0.1-1.0 (0.5) 5.5-6.3a) No data above 0.5% were obtained b) No data above 1.0% were obtained
Numbers in parantheses designate the concentrations of the data in Fig. 1.
3.2 Short times required for separation of kbp-sized dsDNA fragments using CE in PEO solutions in the presence of EOF
The time required for separation of kbp-sized dsDNA, using CE in polymer solutions in the presence of EOF, compares favorably with separation times for previous CE separations without EOF (Table 2) even when differences in field
Electrophoresis 1998, 19, 3149-3153 CZE of kbp sized dsDNA in PEO solutions with electroosmotic flow 3 15 1
2~
Table 2. Time required for separation of kbp-sized dsDNA, using CE in polymer solutions, in presence and in absence of EOF
Polymer Mr Concentration dsDNA Separation time EOF V/cm Concentration Reference
(%) (kbP) (min) regime
:
:
-
2.0%‘ 1.0%’E
0.5%
PEO 8 X lo6 0.5 0.5-10 < 7
+
375 Semidilute This studyPEO 4 x 10⁶ 1.0 0.5-10 < 6
+
375 Semidilute This study-
Pol y acrylamide 4.5 0.075-12.2 120 1 0 0 Semidilute [I1 Poly (N-acroylamino- 10.0 0.075-12.2 72 - 100 Semidilute [31
ethoxyethanol) J A 0 B “I lt I 0: 0.5 1 1.5 2 2.5
1
/
base pairs
( x
10-3)
Figure 2. Migration rates of dsDNA fragments as a function of their length. Panel designations and CE conditions as in Fig. 1.
strength are taken into account. Note that the higher field strength used in the present study would presumably lead to failure of separation for the larger dsDNA species when EOF is suppressed. -3.4
I\
Ab
---
.
1 0 K b ~ 0.2 0.3 0.4 0:s B -3.8 2 Kbp 10Kbp -4.0; 0.2 0.4 0.6 0.8 1.0Concentration
(YO)
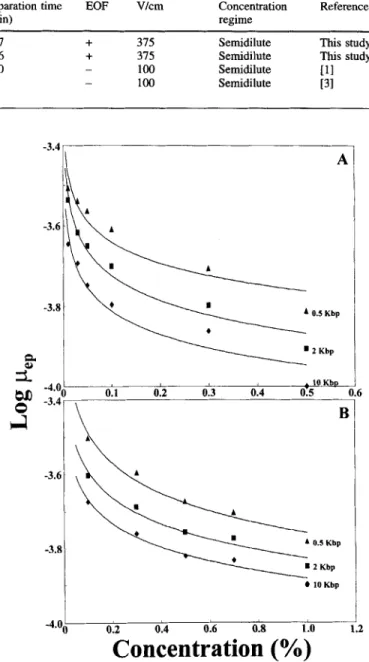
Figure 3. Ferguson plots of dsDNA fragments in CE using PEO solutions in the presence of EOF. Panel designations and CE conditions as in Fig. 1.
3.4 Ferguson plot analysis of CE of dsDNA fragments in the kbp size range, using PEO solution in the presence of EOF
3.3 Molecular sieving in CE, using PEO solutions in the presence of EOF
dsDNA mobility, corrected for EOF, decreases uniformly with increasing length of dsDNA independent of PEO
M,
in the range of 8 to 0.3 X lo6 (Fig. 2, Panels A to E). Thedecrease suggests a parallel molecular sieving effect when a polymer network is present in the “semi-dilute” concen-
tration range (designated by *) or in the “dilute” one. PEO concentration (Fig. 5).
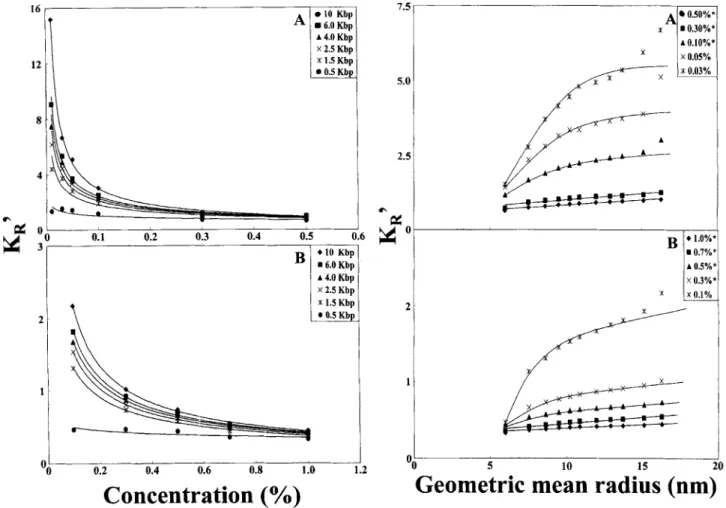
Mobility of dsDNA fragments, obtained in and corrected for the presence of EOF, decreases semi-hyperbolically with increasing PEO concentration when plotted semi-logarith- mically (Fig. 3). The local slopes of that decreasing relationship, local retardation coefficients ER, decrease with polymer concentration (Fig. 4). The maximum rate of that decrease occurs at the lowest polymer concentrations and the largest dsDNA lengths.
K;(
values are proportional to the geometric mean radius of the dsDNA fragments; the rate of increase of lyIR with dsDNA radius increases with3 152 H . 3 . Chen and H.-T. Chang x A Electrophoresis 1998, 19, 3149-3153 0.50% I0.30% A 0.10%’ X 0.05% 8 - A l 2 \ 10 Kbp 6.0 Kbp A 4.0 Kbp X 2.5 Kbp X1.5Kbp 0.5 Kbp 2 - 4~ h
s
0.1 0.2 0.3 0.4 0.5 I 6.0 KbrB
*10 KbF 3 A 4.0 Kby X 2.5 KbF X 1.5 Kbr a 0.5 Kbtt
0.6 0.8 1 .o OO 0.2 0.4Concentration
(%)
Figure 4. Local slopes of Ferguson plots as a function of PEO concentration. Conditions as in Fig. 3.
3.5 Reproducibility of mobilities derived from CE using
The migration time of the slowest migrating component (0.5 kbp) was determined within 2.8% RSD (n = 3), using a 0.5% solution of 8 X lo6 M , of PEO in the presence of EOF. The reproducibility of EOF was determined as 2.3% RSD under the same conditions.
polymer solutions in the presence of EOF
4
Discussion
4.1 Equivalence of resolving capacity for kbp-sized dsDNA fragments in the presence of EOF
Although previous reports on CE of DNA fragments in similar size ranges to those used in this study and using polymer solutions to achieve size separations (e.g. [l-31 have expressed the need for suppression of EOF through wall coating. Uncoated capillaries treated with acid to protonate the silanol groups have been successfully applied to the separation of small dsDNA fragments of less than 0.6 kbp in length [12]. The present study demonstrates that when in CE under the polymer conditions of [12], EOF is maximized by alkaline treatment of the capillary to ionize the silanol groups, separations of kbp-sized dsDNA (Fig. 1) result which are qualitatively equivalent to those carried out with suppression of EOF by inner wall coating, i.e. Fig. 1 of
7.5 5.0 2.5 h
go
2 1 0 m 0.7% A 0.5% X 0.3% 5 10 15 20Geometric mean radius (nm)
Figure 5. Proportionality between KR’ and the geometric mean radius of the dsDNA fragments in CE using PEO solutions in the presence of EOF. Conditions as in Fig. 3.
El], Fig. 1 of [3] or Fig. 1 of 161. Similarly, the Ferguson plots shown in Fig. 3 are qualitatively equivalent to those previously reported for CE in agarose solutions (Fig. 1 of [13]). The relationships derived from the Ferguson plots i.e.
the plot of Kk vs. polymer concentration (Fig. 4) is qualitatively equivalent to those previously reported in Fig. 1 of [lo] for polyacrylamide solutions. The plot of
Kk
vs. the geometric mean radius of DNA (Fig. 5) cannot be distinguished qualitatively from that shown for polyacryl- amide solutions in Fig. 2 of [lo]. The linear relation between KR and particle radius in polymer solutions has been observed in all previous applications of electrophore- sis in polymer solutions (see Appendix of [lo], Fig. 3 of [141).
Band patterns, mobilities and derived functions do not indicate any difference whether they were obtained in the “semi-dilute” polymer concentration ranges (noted by an asterisk in the figures), or in the “dilute” concentration range below the entanglement threshold (c*). This insensi- tivity of the relations derived from the Ferguson plot was previously observed in the CE of particles larger than 30 nm in diameter [15]. It is presumably due to the relatively small differences within the scatter of mobility-derived parame- ters in the conventional plots used and has no qualitative significance.
Electrophoresis 1998, 19, 3149-3153 CZE of kbp sized dsDNA in PEO solutions with electroosmotic flow 3153 4.2 Potential advantages of conducting CE in the
presence of EOF
We have discussed in the section above the fact that the presence of EOF in the CE using polymer solutions does not
seem to bring about any disadvantages in separation of dsDNA fragments in the kbp-size range. However, actual advantages in the presence of EOF can be envisage. One advantage is that the presence of EOF by increasing the time of passage through the capillary is in effect equivalent to increasing the migration path, thus allowing for relatively shorter capillaries or longer migration times. Table 2 also suggests that the time required for separation at least under the conditions of this study may be less than those previously reported. This is apparently due to the higher field strengths that can be applied to the separation of larger dsDNA species in the presence of EOF than is possible in
its absence, without loss of resolution. The mechanism by
which this advantage is achieved is not known. The filling of the capillary by EOF is certainly convenient. It may also be useful in the loading of capillaries with less than 75 gm ID instead of pressure injection.
The authors wish to thank Andreas Chrambach (NICHD, NIH) for editing the manuscript. The work was supported by
the National Science Council of the Republic of China under contract number NSC 88-21 13-M-002-002.
Received February 13, 1998
5
References
Chiari, M., Nesi, M., Righetti, P. G., J. Chromatogr. 1993, 652, 31- 39.
Chiari, M., Nesi, M., Righetti, P. G., Electrophoresis 1994, 15, 616- 622.
Heiger, D. N., Cohen, A. S., Karger, B. L., J. Chromatogr. 1990,516, 3348.
Braun, B., Blanch, H. W., Prausnitz, J. M., Electrophoresis 1997, 18, 1994-1997.
Baba, Y., Ishimaru, N., Samata, K., Tshuhako, M., J . Chromatogr. 1993,653, 329-335.
Atha, D., Electrophoresis 1998, 19, 1428-1453.
Siles, B. A., Collier, G. B., Reeder, D. J., May, W. E., Appl. Theor. Electrophor. 1996, 6, 15-22.
Radko, S. P., Chrambach, A,, Biopolymers 1997, 42, 183-189. Chang, H.-T., Yeung, E. S., J. Chromatogr. B 1995,669, 113-123. Tietz, D., Chraihbach, A., Electrophoresis 1993, 14, 185-190. Stellwagen, N. C., Adv. Electrophor. 1987, I, 177-230. Fung, E. N., Yeung, E. S., Anal. Chem. 1995, 67, 1913-1919. Tietz, D., Chrambach, A., Electrophoresis 1992, 13, 286-294. Radko, S. P., Chrambach, A., J. Phys. Chem. 1996, 100, 19461- 19465.