IEEE PHOTONICS TECHNOLOGY LETTERS, VOL. 18, NO. 10, MAY 15, 2006 1119
Alignment Monitoring Technique for Pulse Carver
and Data Modulator in RZ-DPSK Systems Using an
Optical Frequency Discriminator
Kuen Ting Tsai, Guo-Wei Lu, Lian-Kuan Chen, Senior Member, IEEE, and Winston I. Way, Fellow, IEEE
Abstract—A technique for monitoring the timing alignment
between a pulse carver and a phase modulator in return-to-zero differential phase-shift keying systems is proposed. An optical frequency discriminator and a microwave detector centered at a half of the phase modulation data rate are used to monitor the spectrum broadening caused by timing misalignment. The proposed method has a large detection dynamic range and is polarization-independent.
Index Terms—Differential phase-shift keying (DPSK), frequency
discriminator, monitoring, synchronization.
I. INTRODUCTION
I
N A return-to-zero differential phase-shift keying (RZ-DPSK) system, the correct timing between pulse carving and phase modulation must be maintained. This has recently been recognized as a challenging task, because of the unavoidable optical/electronic device aging and the tem-perature variation-induced optical length change between the two modulators [1]–[3]. For example, it was reported that a 10-Gb/s RZ-DPSK system power penalty increases rapidly when the timing alignment exceeds 15 ps [2]. This is equiva-lent to 3.75 ps in a 40-Gb/s RZ-DPSK system, which can be easily incurred due to temperature variations [1]. Therefore, an automatic alignment method is needed for a long-term stable field deployment. Two methods have so far been published for this purpose [1], [2]. The first method measured the degree of polarization change due to timing-misalignment by using a polarization-maintaining fiber, a polarizer, and an optical power meter. A very limited monitored power dynamic range of 0.2 dB was obtained. The second method [2] used an off-center optical filter to capture the frequency chirp induced by the timing-alignment, but the monitored dc power dynamic range is limited to only 3.35 dB for a 10.61-Gb/s RZ-DPSK.In this letter, we use an optical frequency discriminator and a microwave detector centered at a half of the phase modula-tion data rate to monitor the misaligned timing. This timing-mis-alignment detection method can be used when the phase modu-lation is implemented by either a dual-arm Mach–Zehnder (MZ)
Manuscript received November 14, 2005; revised January 15, 2006. K. T. Tsai is with the Department of Communications Engineering, National Chiao-Tung University, Hsinchu 30050, Taiwan, R.O.C. (e-mail: [email protected]; [email protected]).
G.-W. Lu and L.-K. Chen are with the Department of Information Engi-neering, Chinese University of Hong Kong, Hong Kong.
W. I. Way is with OpVista Inc., Milpitas, CA 95035 USA. Digital Object Identifier 10.1109/LPT.2006.873962
Fig. 1. (a) Proposed setup for monitoring clock misalignment. (b) Frequency-to-intensity conversion characteristic of a delay-and-add discriminator.
modulator or a phase modulator. Compared with previous mon-itoring schemes [1]–[3], this polarization-independent method can achieve a much larger dynamic range of 17.5 dB, and therefore a much higher monitoring sensitivity. In addition to RZ-DPSK, this method can also be applied to other modulation techniques such as RZ and carrier-suppressed RZ, which use two optical modulators for data and clock, respectively.
II. OPERATIONALPRINCIPLE
The proposed configuration is shown in Fig. 1(a). A small portion of the transmitted optical signal is tapped and passed through an optical frequency discriminator. After photodetec-tion, radio-frequency (RF) bandpass filtering and envelope de-tection, the output is fed into a control circuit which drives a voltage-controlled phase shifter to adjust the time delay between the data and clock signal. The phase shifter is adjusted until a minimum of detected microwave power is reached. Note that if the optical frequency discriminator is temperature stabilized, it could serve as a wavelength locker.
In order to obtain a clear idea about how an optical frequency discriminator functions and what the important design parame-ters are, we provide a closed-form analysis in this section. We first assume that the optical field of a modulated light source to be
(1) where and are the intensity and phase modulations, re-spectively, and is the angular frequency of optical carrier. For
an RZ-DPSK signal, , where
is data sequence with equal probability, and is the phase modulator driving pulse in one bit slot. Also, is an RZ pulse train given by
1120 IEEE PHOTONICS TECHNOLOGY LETTERS, VOL. 18, NO. 10, MAY 15, 2006
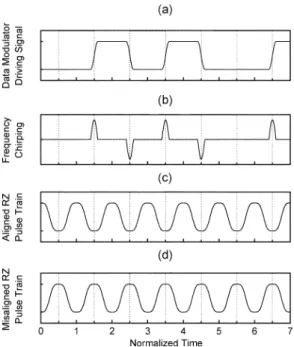
Fig. 2. Illustration of the timing alignment between a pulse carver and a data modulator. (a) Data modulator driving signal. (b) Frequency chirp duo to data transitions. (c) RZ pulse train with perfect timing alignment. (d) RZ pulse train with misaligned timing.
, where is an optical pulse within an interval of , is the bit duration, and represents the mis-alignment . The frequency chirp caused by the phase modulation can be written as
(2)
where and is sufficiently small.
In the following, we will see that can be obtained di-rectly from an analysis based on a delay-and-add frequency dis-criminator, given that is also sufficiently small. This closed-form analysis can help us gain a clear physical insight of the proposed method even though the physical optical frequency discriminator may not be a delay-and-add filter.
After passing through a delay-and-add optical frequency discriminator operating at a quadrature point, we can obtain the detected photocurrent as
(3) where represents the data captured at the positive or nega-tive slope of the optical frequency discriminator. In (3), the first two terms are the RZ pulse train and its delayed replica. The third term is the product of the intensity modulation and the fre-quency chirping, and is directly proportional to when . We can see that this interference term exists only when the RZ pulse amplitude and the frequency chirp are both nonzero. Fig. 2 shows that although frequency chirp al-ways occurs during data transitions [Fig. 2(b)], the interference term exists only when the RZ pulses are misaligned with respect to the modulating data, as shown in Fig. 2(d). In other words, only when a part of the carved RZ pulse enters the data tran-sient region due to timing misalignment, can the frequency chirp be observed and measured. Note also that the first and second terms in (3) are not dependent on the timing misalignment, and
Fig. 3. RF spectra of (4) for various rolloff factors of the phase modulator driving pulsem(t).
their presence in a measured result could decrease the moni-toring dynamic range at dc and the clock frequency. Therefore, our measurement focuses on the third term to improve the dy-namic range in [2].
The RF power spectrum of the detected photocurrent can be obtained by taking the Fourier transform of the autocorrelation function of (3). It is composed of the power spectrum of the RZ pulse train, which has spikes occurring at the clock frequency and its harmonics, and the power spectrum of the interference term given by
(4) where we have assumed that the phase modulating data has a raised cosine pulse shape with a rolloff factor . We can see that the RF spectrum level is proportional to the misaligned pulse shape and the differential delay . When , is zero because . For a fixed nonzero , the power spectral density of the interference term is zero at and . The maximum power spectral density is around depending on rolloff factor , as shown in Fig. 3. Note also that (4) has no power at . There-fore, the highest detection sensitivity and dynamic range can be obtained if we use a narrowband microwave filter centered at . Theoretically, the dynamic range can reach infinity be-cause the detected microwave power between totally misaligned and perfectly aligned timing is given by , where is zero. In practice, however, the dynamic range is lim-ited by the microwave detector noise.
There exists a tradeoff to select a proper differential delay . The differential delay has to be small to ensure that the fre-quency excursion is within the linear slope of the frefre-quency discriminator, as shown in Fig. 1(b), i.e.,
, where FSR is the free-spectral range of the delay-and-add filter. On the other hand, according to (4), the longer the differential delay , the larger the power variations induced by the discriminator.
III. EXPERIMENTALRESULTS
An experiment was conducted to verify the feasibility of the proposed method in a 10.61-Gb/s RZ-DPSK system. An RZ-DPSK transmitter consists of a tunable continuous-wave (CW) laser with a linewidth of 100 KHz, an electroabsorption modulator (EAM) for pulse carving, and an optical phase modulator. The CW light was carved into a pulse train with
TSAI et al.: ALIGNMENT MONITORING TECHNIQUE FOR PULSE CARVER AND DATA MODULATOR 1121
Fig. 4. Measured RF spectrum of a 10.61-Gb/s RZ-DPSK signal through an optical frequency discriminator with a clock misalignment of 0, 26, and 47 ps. The optical carrier frequency is aligned to the03-dB point of an optical thin-film filter at its positive slope. The RF spectrum analyzer resolution and video bandwidths were both 300 kHz.
Fig. 5. Monitored power at 5.3 GHz as a function of timing misalignment and the corresponding power penalty of the 10.61-Gb/s RZ-DPSK signal.
a pulsewidth of 28 ps via an EAM, which was driven by a 10.61-GHz sinusoidal clock signal. The pulse train was then phase-modulated by a 10.61-Gb/s nonreturn-to-zero pseudo-random binary sequence of pattern length using a LiNbO phase modulator. At the output of the RZ-DPSK trans-mitter, a portion of optical power was tapped off and fed into an optical thin-film filter-based optical frequency discriminator with a linear frequency transition range of 0.3 nm. After photodetection and electrical amplification, an RF spectrum analyzer was used to observe the RF power variations for different misalignment conditions. Different misalignment conditions were achieved by manually adjusting a tunable delay between the 10.61-GHz sinusoidal clock and the EAM. As for the direct detection of DPSK data signals, a single-ended MZ interferometer with a relative arm delay of 94 ps was used before a PIN photodiode.
Fig. 4 shows the measured RF spectrum of a 10.61-Gb/s RZ-DPSK signal with a clock misalignment of 0, 26, and 47 ps, respectively. Again, the CW laser frequency is aligned to the 3-dB point of the optical filter at its positive slope. As expected, the relative amplitude around 5.3 GHz increased the most as the clock misalignment increased. This is due to the presence of FM-to-AM conversion component which occurred at bit transitions. Note that only a difference of 2.63 dB at 10.6 GHz is obtained between perfect alignment and total misalignment, and that is why the clock frequency is not a good choice to achieve a high dynamic range.
Fig. 5 shows the monitored power at 5.3 GHz as a function of timing misalignment, while the CW laser frequency is aligned to the 3-dB point of the optical filter at its positive slope. The detection bandwidth is the resolution bandwidth of the spectrum analyzer, 300 kHz. Furthermore, the detected RF power should
Fig. 6. Monitored power dynamic range as a function of the frequency detuning between the CW laser and the center frequency of the optical filter (left-hand sideY -axis), and the corresponding frequency response of the optical thin-film filter (right-hand sideY -axis).
be averaged over time to prevent the pattern-dependent effect induced by consecutive data transitions. A dynamic range of 17.5 dB was achieved within a range of 40 ps. The corre-sponding 10.61-Gb/s RZ-DPSK system power penalty induced by the timing misalignment is also shown in Fig. 5. Note that the power penalty increases rapidly when the timing misalignment exceeds 15 ps.
Fig. 6 shows the optical thin-film filter frequency response measured from an optical amplifier-based white noise source. The corresponding monitoring power dynamic range as a func-tion of frequency detuning between the CW laser frequency and optical filter center frequency is also shown. A dynamic range of more than 15 dB can be achieved at either slopes of the optical filter within a wide detuning range of 0.3 nm. Note that when the laser frequency was aligned to the center of the optical filter, the dynamic range was severely degraded. This is because the flat top response cannot provide enough FM-to-AM conversion. In addition, the dynamic range was also severely reduced when the laser frequency is tuned to the edge of the optical filter, be-cause in this case, the measured dynamic range was limited by the high optical filter insertion loss ( 30 dB).
IV. CONCLUSION
We have experimentally demonstrated the feasibility of an au-tomatic timing alignment method for an RZ-DPSK system using an optical frequency discriminator and a microwave detector centered at a half of the phase modulation data rate. Compared with previously published monitoring schemes, our proposed method achieved a significantly improved monitoring power dy-namic range of 17.5 dB within a timing alignment range of a half-bit period. An additional advantage of this method is that a temperature-stabilized optical frequency discriminator can also serve as a wavelength locker.
REFERENCES
[1] H. Kim, C. R. Doerr, R. Pafchek, L. W. Stulz, and P. Bernasconi, “Align-ment monitoring of the pulse carver and data modulator for RZ-DPSK systems,” IEEE Photon. Technol. Lett., vol. 15, no. 11, pp. 1594–1596, Nov. 2003.
[2] G.-W. Lu, Y.-C. Ku, L.-K. Chen, and C.-K. Chan, “A novel technique for pulse-carver and data alignment monitoring in RZ-DPSK systems using off-center optical filtering,” IEEE Photon. Technol. Lett., vol. 17, no. 3, pp. 711–713, Mar. 2005.
[3] J. H. Sinsky, “High-speed data and pulse-carver alignment in dual Mach–Zehnder modulator optical transmitters using microwave signal processing,” J. Lightw. Technol., vol. 21, no. 2, pp. 412–423, Feb. 2003.