Raman spectroscopy study of ZnSe and Zn
0.84Fe
0.16Se at high pressures
Chih-Ming Lin, Der-San Chuu,*and Tzong-Jer YangInstitute of Electro-Physics, National Chiao Tung University, Hsinchu, Taiwan, Republic of China
Wu-Ching Chou
Department of Physics, Chung Yuan Christian University, Chung-Li, Taiwan, Republic of China
Ji-an Xu and Eugene Huang
Institute of Earth Sciences, Academia Sinica, P.O. Box 1-55, NanKang, Taipei, Taiwan 11529, Republic of China
~Received 22 August 1996; revised manuscript received 11 November 1996!
The ZnSe powder and Zn0.84Fe0.16Se crystal were studied by Raman scattering spectroscopy at pressures up
to 36.0 and 32.0 GPa, respectively. For ZnSe powder at 4.7 and 9.1 GPa, two phase transitions were observed. However, the resulted phases have not been identified yet. As the pressure was increased to 14.4 GPa, the LO phonon peak disappeared while the TO phonon peak was still visible until the metallization pressure, 17.0 GPa was reached. In addition, three unidentified Raman peaks were still observable above the metallization pres-sure. For Zn0.84Fe0.16Se crystal, the structure transition from possible zinc blende to sodium chloride phase ~B1! was identified by the disappearance of Fe local mode and longitudinal optical ~LO! phonon mode at 10.9
GPa. In addition, an unidentified phase transition at 4.7 GPa was observed. The TO phonon and the split TO phonons were still observable at a pressure above the phase transition pressure up to 32.0 GPa. The existence of Fe impurity in the ZnSe up to a concentration of 0.16 reduced the semiconductor-metal phase transition pressure to 10.9 GPa. According to the calculation of Gru¨neisen parameters, Zn0.84Fe0.16Se was found to have
a higher ionicity than ZnSe. Reasons for the observation of Raman peaks at a pressure above the metallization pressure are still unknown.@S0163-1829~97!03420-6#
I. INTRODUCTION
The physical properties of semiconductors at high pres-sure have attracted much attention.1–3Among the numerous semiconductors that have been studied, ZnSe is one of the most important due to its application in the fabrication of blue lasers.4 In past decades several kinds of high-pressure studies on ZnSe have been performed. Ves et al. investigated the band shift of ZnSe as a function of pressure by transmis-sion experiments.5 The x-ray diffraction experiments were carried out to observe the structure transformations.3,6 Re-cently, the luminescence of the deep impurities was mea-sured for the study of pressure effect on the impurity level relative to the valence band edge.7The high-pressure experi-ment for the resistance measureexperi-ment revealed that ZnSe has undergone a metallization process at a pressure higher than 13.5 GPa.8,9 Among the works mentioned above, the most popular technique used in the high-pressure study was the Raman scattering.6
In addition to the experimental investigations, theoretical studies were also performed by use of the self-consistent pseudopotential approach,10 the full potential linearly aug-mented plane wave approach, and numerical atomic orbital band structure calculations within the local-density approximation.11Although various experimental and theoret-ical techniques were employed in the study of ZnSe at high pressure, some of the physical properties of ZnSe at high pressure are still unknown. Moreover, a discrepancy existed among the results obtained by various theoretical works. For example, Smelyansky and co-workers11 suggested that the metallization occurred when ZnSe transformed from a
four-coordinated zinc-blende ~ZB! phase into a six-coordinated rock-salt~RS! phase. However, Andreoni and Maschke10 in-dicated that the metallization was due to the band closure.
Zn12xFexSe, the crystallizes in the zinc-blende structure
which is similar to ZnSe for 0<x<0.22,12 is a member of the diluted magnetic semiconductor family.13 Interesting magnetic as well as the magneto-optical properties were in-vestigated on both Zn12xFexSe bulk crystals and thin
films.14–16Recently, the spin superlattice behavior17 and the spin relaxation process18of Zn12xFexSe based quantum well
structures were observed. Furthermore, the pressure induced phase transition of the Zn12xFexSe crystal was also
dis-cussed by Qudri et al.19 using the energy-dispersive x-ray-diffraction ~EDXD! measurement. It was found that the ex-istence of Fe in the crystal results in a reduction in the transition pressure, and such a reduction was believed to be due to the hybridization of 3d orbitals into the tetrahedral bonds.20
Recently, the Raman scattering experiment has also been applied to study the pressure effect on Zn12xFexSe,
Zn12xCoxSe,21and Zn12xMnxSe~Refs. 22 and 23! crystals,
and two new phases were found at 4.0 GPa and 8.0 GPa in Zn12xMnxSe. However, the cause of the pressure induced
phase transitions was not identified. Moreover, the highest pressure used for the Raman study was below 13.0 GPa. Note that zinc blende to sodium chloride ~B1! ~semiconductor-metal! transition occurs at 13.5 GPa from
the resistivity measurement on ZnSe.8,9 Therefore, the Ra-man scattering study on Zn12xFexSe crystals above the
semiconductor-metal transition pressure would be interest-ing.
55
In this paper, the Raman scattering was used to investi-gate the pressure effect on the phase transition of ZnSe pow-der and Zn0.84Fe0.16Se crystals at high pressure up to around
36.0 and 32.0 GPa, respectively. We found that ZnSe mani-fested four phase regions including two unidentified transi-tions occurred at 4.7 and 9.1 GPa. In addition, three split transverse optical ~TO! phonon modes were observed at a pressure higher than the metallization pressure~14.4 GPa! up to 36.0 GPa. As at 4.7 GPa, one unidentified phase transition of Zn0.84Fe0.16Se was observed, too. In addition, the effect of
the Fe element on the phase transition will also be discussed.
II. EXPERIMENTS
The high pressure, up to 36.0 GPa, was generated in a diamond anvil cell with the culet size of 600 mm. Zn0.84Fe0.16Se crystal grown by the modified Bridgman
method was ground into tiny crystals with the size in the range of 100 mm. The ZnSe powder or tiny Zn0.84Fe0.16Se crystals and ruby chips~about 1 mm in size! were sealed with the pressure transmitting medium ~deion-ized water! in the sample chamber which was a hole of 130
mm diameter and 50mm thick drilled on the stainless steel 304 gasket which has an original thickness of 250 mm. The pressure was calibrated by the fluorescence scale method.24,25For Raman scattering experiments, a Renishaw 2000 micro-Raman system was used. The 514.5 nm line with a power of 1.5 W from the Coherent INNOVA 5.0 W argon ion laser was focused to about 5mm on the sample surface. Traditionally, water is considered as a bad pressure medium because it transfers to solid ice VI and VII at 0.6 and 2.1 GPa, respectively. However, previous study has shown that the R1-R2 splitting in the ruby fluorescence was maintained well up to 16.7 GPa,26therefore, the nonhydrostatic compo-nents are not a serious problem below 16.7 GPa. In the present study, such a splitting was well recorded up to 36 GPa as shown in Fig. 1. Hence, water~deionized H2O! seems
to be a suitable pressure medium in the high pressure study. To verify such a result, we have investigated Raman experi-ments in both a water and an alcohol solution~4:1 methanol/ ethanol solution!. We observed that there was no difference in the phase transition pressures, and pressure dependences of Raman shifts in both media were the same. However, in the low Raman frequency range ~lower than 500 cm21), a much higher background was found in the alcohol solution experiments, therefore, much longer accumulating time was needed in the case as the alcohol solution was used as the pressure medium. This was the reason that we chose water
~deionized H2O! as the pressure medium in our normal
ex-perimental runs. The Jandel Scientific Peakfit computer pro-gram was used in a deconvolution process and determination of the peak position, intensity, and the full width at the half maximum of Raman spectra.
III. RESULTS AND DISCUSSION
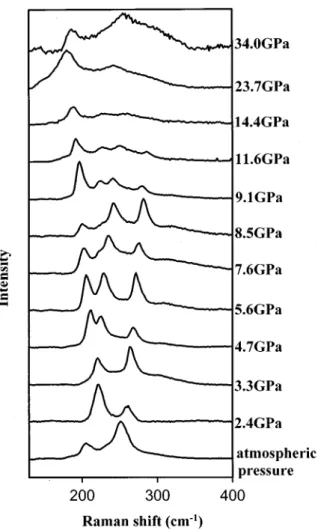
Raman spectra for ZnSe at room temperature and at vari-ous pressures are shown in Fig. 2. At ambient conditions, the longitudinal optical~LO! and TO phonons were observed at 250 and 205 cm21, respectively, as reported in the previous work.1 At 4.7 GPa, the TO phonon splits into two peaks
which have different pressure dependences from each other. A mode softening is found for the peak with a lower fre-quency component. Whereas, the Raman shift of the higher frequency one increases with pressure, and it splits into two components again at around 9.1 GPa. However, for the LO phonon mode, no mode spliting can be found. The Raman shift of the LO phonon increased monotonously with pres-sure. At pressures higher than 14.4 GPa, the LO phonon became invisible. The disappearance of the LO phonon was attributed to the semiconductor-metal phase transition.9 On the contrary, all of the TO and TO split phonon modes are still visible above the metallization pressure as shown in Fig. 3. The phase transitions that occurred at 4.7 GPa and 9.1 GPa were ignored in the previous studies of high-pressure phase transition in pure ZnSe, although these two phase tran-sitions were reported in the high-pressure Raman study of the Zn12xMnxSe.
22
In the case of Zn12xMnxSe, one more
mode, the Mn impurity mode, was observed. Arora et al.23 reported that the splitting of the impurity mode at 4.0 GPa was caused by the lowering of the crystal symmetry. Later, Arora, and Sakuntala22 found one more phase transition at 8.0 GPa. At 8.0 GPa, the sample becomes opaque. This tran-sition was considered as a transformation from the direct to indirect band gap. Furthermore, the Raman signal disap-peared above 13.5 GPa ~our work is 14.4 GPa! because the sample became metallic.
Phase transitions at 4.7 and 9.1 GPa in pure ZnSe ob-served by Arora and Sakuntala22 were labeled by using the
FIG. 1. The ruby fluorescence patterns vs pressure in a pressure medium of deionized water. The left-hand and right-hand side peaks of the plots present R2and R1peaks of the ruby fluorescence,
splitting of the ZnSe TO phonon instead of the splitting of the Mn impurity mode. A theoretical calculation has been performed by Smelyansky and Tse11 to study the phase transformations of ZnSe. However, only the phase transition that occurred at 14.4 GPa was considered. The phase transi-tion at 14.4 GPa was attributed to the ZB to RS structure transformation. No calculation was reported for the phase transition at 4.7 and 9.1 GPa. Similar to ZnSe, the semicon-ductor ZnTe has a ZB crystal structure, but more details were discussed for the calculation of the structure transformations. Recently, Lee and Ihm27 indicated that ZnTe underwent the structure transformation from the ZB to cinnabar and the orthorhombic ~Cmcm! to RS phase3 by use of the ab initio pseudopotential calculations within the local-density ap-proximation. Therefore, we suspected that ZnSe might also undergo a similar structure transformation from the ZB through cinnabar and the orthorhombic to the RS structure at 4.7, 9.1, and 14.4 GPa, respectively. As a result, a more detailed theoretical study for the ZnSe structure transforma-tion as well as an x-ray diffractransforma-tion experiment with higher-pressure resolution at the higher-pressure range around 4.7 to 9.1 GPa should be very useful to clarify our suspicion. Note that in the recent x-ray work of Greene et al.,6anomaly was also found at a pressure of around 5.0 GPa.
Raman spectra from Zn0.84Fe0.16Se crystal at various
pres-sures are shown in Fig. 4. At the atmospheric pressure, two
peaks identified as the LO and TO phonons were observed at 253 and 215 cm21, respectively, as reported previously.28 Between these two peaks, a weak structure can be labeled through the deconvolution process. The weak structure was attributed to the Fe local ~impurity! phonon mode. The Fe local phonon arose from the introduction of the local electric field resulting from the substituting Zn atom by the Fe atom.28At 2.6 GPa, the Fe local mode became more intense at a higher pressure and the Raman shift increased with the pressure. The pressure effects on the LO and TO phonons exhibited a blueshift behavior that was similar to the Fe local phonon. As the pressure was increased to 4.7 GPa, two new modes appeared at 219.6 and 205.5 cm21, respectively. The phonon energy of the 205.5 cm21mode~labeled as TO split mode I! exhibited a redshift and the other 219.6 cm21mode
~labeled as TO split mode II!, as the LO and Fe local mode,
exhibited a blueshift as the pressure was increased up to around 32.0 GPa. Although there are no structure transitions identified by Qadri et al.19 at the pressure lower than 10.0 GPa from their EDXD work, however, if one refers to the study of the similar cubic structure of CdTe,29 before the structure transforms from the four coordinated ZB structure to the six coordinated NaCl structure, one more phase ~cin-nabar structure! was found. In fact, the CdTe transforms from the ZB to cinnabar, the cinnabar to NaCl, and the NaCl to orthorhombic ~Cmcm! as the pressure is raised to 10.0 GPa. We therefore attribute the appearance of the new pho-non mode to the broken symmetry of the structure
transfor-FIG. 2. Pressure dependence of phonon frequencies of ZnSe. Note the lowest frequency component was softened at the high pressure and was continuous to 36 GPa.
FIG. 3. High pressure, above 14.4 GPa, dependence of phonon frequencies of ZnSe. Note all TO phonon modes were still visible above the metallization pressure, 14.4 GPa.
mation. The splitting of the TO phonon at 4.7 GPa could be also due to the structure transition. However, so far, structure transitions that occurred at 4.7 GPa are not confirmed by the x-ray-diffraction work. As the pressure was increased further to 10.9 GPa, the semiconductor-metal transition pressure of Zn0.84Fe0.16Se, both the LO and the Fe local modes
disap-peared.
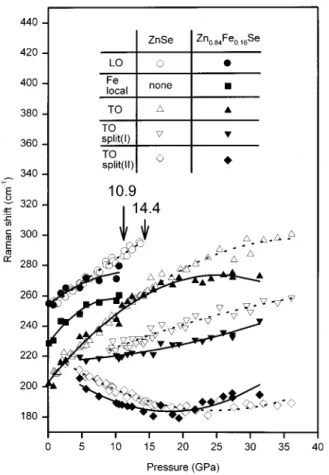
The variation of the mode energies as a function of the pressure can be shown in Fig. 4. The open symbols corre-spond to the LO, TO, and TO split Raman modes of ZnSe, respectively. Simultaneously, the solid symbols correspond to the LO, Fe local, TO, and TO split Raman modes of
Zn0.84Fe0.16Se, respectively. The relationships of the mode
frequencies versus the pressure of ZnSe can be obtained by the quadratic polynomial fitting by the following formulas:
vLO mode5251.913.44p20.02p2, ~1!
vTO mode5204.214.98p20.07p2, ~2!
vTO split mode~I!5207.212.01p20.02p2, ~3!
vTO split mode~II!5222.923.12p10.06p2, ~4!
and were plotted as the dashed curves as shown in Fig. 4. Similarly, the solid lines are the fitting results by the fol-lowing formulas for Zn0.84Fe0.16Se:
vLO mode5254.35313.370p20.133p2, ~5!
vFe local mode5228.29316.138p20.313p2, ~6!
vTO mode5202.64415.603p20.111p2, ~7!
vTO split mode~I!5216.53210.149p10.021p2, ~8!
vTO split mode~II!5215.94823.565p10.099p2, ~9!
where vi was the wave number in cm21 and p was the
pressure in GPa. The Gru¨neisen parameter (gi) for a
quasi-harmonic mode i of frequency vi was defined by 30 gi52~dlnvi/dlnV!5 1 b ]lnvi ]p 5~K0/vi!~dvi/d P!, ~10!
where K0 ~Ref. 5! is the bulk modulus for ZnSe, and was taken as 62.4 GPa. The same K0 value was used in the
Zn0.84Fe0.16Se system. The b parameter is the isothermal volume compressibility, and V is the molar volume in cm3/mol. The effects of the pressure on various Raman vi-brational modes of ZnSe and Zn0.84Fe0.16Se at room
tempera-ture~298 K! were listed in Tables I and II, respectively. As a comparison with previous works,1some conclusions can be obtained: ~i! the gLO values of ZnSe and Zn0.84Fe0.16Se are
0.85 and 0.827, respectively. They are very close to one;~ii!
gTO.gLOfor both systems~for ZnSe is 1.52.0.85 and for
Zn0.84Fe0.16Se is 1.725.0.827!; ~iii! the ratios gTO/gLO for
ZnSe and Zn0.84Fe0.16Se are 1.788 and 2.086, respectively.
TABLE I. Effect of pressure on various Raman vibrational modes of ZnSe at room temperature~298 K!. The values of mode frequencies vi, pressure dependence dvi/d p, mode Gru¨neisen parameter gi, and dgi/d p were extrapolated at ambient conditions.
Mode vi (cm21) dvi dp
S
cm21 GPaD
gi dgi dpS
1 GPaD
LO 251.9 3.4420.04p 0.85 20.0213.231024p TO 204.2 4.9820.14p 1.52 20.0611.1431024p TO split~I! 207.2 2.0120.02p 0.60 20.0212.0231024p TO split~II! 222.9 23.1210.12p 20.87 0.0315.2531024pFIG. 4. Pressure dependence of phonon frequencies of Zn0.84Fe0.16Se. Note the lowest frequency component is softened at
This manifests that Zn0.84Fe0.16Se has a higher ionicity than
ZnSe. We suggest that the higher ionicity resulted from the Fe impurity.
In Fig. 5, it is clear that the pressure effect on the Raman shift for the ZnSe and Zn0.84Fe0.16Se is almost the same,
except the phase transition pressures are different, and no local mode could be observed in the ZnSe. The disappear-ance of the LO phonon can be understood as a
semiconductor-metallic transition from the high-pressure resistivity31 and Raman spectroscopy measurements on the ZnSe powder. The Fe local phonon in Zn0.84Fe0.16Se behaves
the same way as the LO phonon instead of the TO phonon which splits into three components and is still visible at the highest pressures achieved in our experiments. Furthermore, it was found the semiconductor-metal transition pressure for the Zn0.84Fe0.16Se is 10.9 GPa, which is 3.5 GPa lower than
that of the ZnSe. The reduction in the transition pressure is due to the existence of Fe which results in the hybridization of 3d orbitals into the tetrahedral bonds.20Our result is con-sistent with the study of pressure-induced phase transition of Zn0.83Fe0.17Se by the energy-dispersive x-ray-diffraction
measurement.19
The other significant result obtained in this work is that at a pressure higher than 10.9 GPa, the metallic RS structure transformation pressure of Zn0.83Fe0.17Se, the LO and Fe
lo-cal phonon disappeared, but all the TO and split TO phonon modes were still clearly visible. The high-pressure Raman scattering experiments up to ;6.0 GPa have also been carried out by Arora et al.23 to study ZnSe and Zn12xMnxSe. However, no Raman signals above 13.5 GPa
have been reported yet. We note that the onset of the metal-lization occurs at 13.5 GPa. According to the data provided by Itkin and co-workers,9 at that pressure the resistance drops abruptly from 1021V to 104V. Assuming the sample size is about 100 mm in diameter and 10 mm in thickness, then the calculated resistivity at 13.5 GPa is about 109
mV cm, which is the intermediate of those of silicon ~6.4 31010 mV cm! and copper ~1.7 mV cm!. Itkin et al.
sug-gested that at the pressure of 13.5 GPa, where the RS struc-ture first appeared, a new semiconducting phase was formed and was able to exist in a pressure range of about 13.5–17.0 GPa. Beyond that range, metallization occurred due to gap closure. However, we have found that three Raman peaks on ZnSe powder at 260.0 cm21, 230.0 cm21, and 191.0 cm21 were still visible at the highest pressure ~36.0 GPa! we achieved. One can recall that the skin depth~or penetration depth!d can be expressed as
d. c
A
2pmvs, ~11! where c, m,v, and s are the speed of light, permeability, angular frequency of excitation laser beam, and theconduc-TABLE II. Effect of pressure on various Raman vibrational modes of Zn0.84Fe0.16Se at room temperature ~298 K!. The values of mode frequencies vi, pressure dependence dvi/d p, mode Gru¨neisen parameter gi, and dgi/d p are extrapolated at ambient conditions.
Mode vi (cm21) dvi dp
S
cm21 GPaD
gi dgi dpS
1 GPaD
LO 254.353 3.37020.266p 0.827 20.076111.739731023p Fe local 228.293 6.13820.626p 1.727 20.212518.188831023p TO 202.644 5.60320.222p 1.725 20.098912.474031023p TO split~I! 216.532 0.14910.042p 0.043 20.012111.610631025p TO split~II! 215.948 23.56510.198p 21.030 0.012714.116031023pFIG. 5. Pressure dependence of Raman peaks in the
Zn0.84Fe0.16Se crystal~black symbols! and ZnSe powder ~opened
symbols!. The solid lines and dashed lines are quadaratic polyno-mial fitting curves for Zn0.84Mn0.16Se crystal and ZnSe powder,
re-spectively. The arrows at 10.9 and 14.4 represent the semi-conductor-metal phase transition pressure of Zn0.84Fe0.16Se and
tivity, respectively. The permeability of the metallized ZnSe is about the same as the permeability in vacuum and the wavelength of the excitation laser beam is 5145 Å. The re-sistivity above 18.6 GPa is reported to be smaller than 12
mV cm.9Then the calculated skin depth at a pressure above
18.6 GPa was only about several tens of an Å. It may be very interesting to study which mechanism makes the number of scattered photons become large enough to be detected for such a thin penetration depth.
IV. CONCLUSIONS
We have carried out high-pressure Raman scattering ex-periments on ZnSe powder and Zn0.84Fe0.16Se crystal up to 36.0 and 32.0 GPa, respectively. The existence of the Fe element results in a reduction in the semiconductor-metal phase transition pressure. The disappearance of the LO and Fe local phonons are attributed to the metallization of the
ZnSe powder and the Zn0.84Fe0.16Se crystal. Visible TO
phonon splitting into three components in ZnSe and Zn0.84Fe0.16Se systems was observed up to 36.0 and 32.0
GPa, respectively. The calculated Gru¨neisen parameter im-plied that Zn0.84Fe0.16Se has a higher ionicity than ZnSe. A
complete theoretical study and detailed x-ray work are needed to fully understand the current experimental results.
ACKNOWLEDGMENTS
This work was supported by the National Science Coun-cil, Taiwan by Grant Nos. NSC84-2112-M-009-008, 2112-M-009-020, NSC86-2112-M-009-006 and NSC85-2112-M-009-012 at NCTU, NSC85-2112-M-033-007 at CYCU, NSC-84-2111-M-001-015 and NSC 85-2111-M-001-002 at IES. Partial support was from the Research Group, CYCU under Contract No. CY84-RG-001.
*Author to whom all correspondence should be addressed. 1S. S. Mitra, O. Brafman, W. B. Daniels, and R. K. Crawford,
Phys. Rev. 186, 942~1969!.
2B. A. Weinstein and G. J. Piermarini, Phys. Lett. 48A, 14~1974!. 3M. I. McMahon and R. J. Nelmes, J. Phys. Chem. Solids 56, 485
~1995!.
4P. J. Dean, Phys. Status Solidi A 81, 625~1984!.
5S. Ves, K. Stro¨ssner, N. E. Christensen, C. K. Kim, and M.
Car-dona, Solid State Commun. 56, 479~1985!.
6R. G. Greene, H. Luo, and A. L. Ruoff, J. Phys. Chem. Solids 56,
521~1995!.
7M. M. Li, D. J. Strachan, T. M. Ritter, M. Tamargo, and B.
Weinstein, Phys. Rev. B 50, 4385~1994!.
8G. J. Piermarini and S. Block, Rev. Sci. Instrum. 46, 973~1975!. 9G. Itkin, G. R. Hearne, E. Sterer, M. P. Pasternak, and W. Potzel,
Phys. Rev. B 51, 3195~1995!.
10
W. Andreoni and K. Maschke, Phys. Rev. B 22, 4816~1980!.
11V. I. Smelyansky and J. S. Tse, Phys. Rev. B 52, 4658~1995!. 12H. J. M. Swagten, A. Twardowski, W. J. M. deJonge, and M.
Demianiuk, Phys. Rev. B 39, 2568~1989!.
13J. K. Furdyna, J. Appl. Phys. 64, R29~1988!.
14A. Twardowski, P. Gold, P. Pernambuco-Wise, J. E. Crow, and
M. Demianiuk, Phys. Rev. B 46, 7537~1992!.
15B. T. Jonker, J. J. Krebs, S. B. Qadri, and G. A. Prinz, Appl.
Phys. Lett. 50, 848~1987!.
16L. P. Fu, T. Schmiedel, A. Petrou, J. Warnock, and B. T. Jonker,
Appl. Phys. Lett. 60, 583~1992!.
17W. C. Chou, A. Petrou, J. Warnock, and B. T. Jonker, Phys. Rev.
Lett. 67, 3820~1991!.
18
W. C. Chou, A. Petrou, J. Warnock, and B. T. Jonker, Phys. Rev. B 46, 4316~1992!.
19S. B. Qadri, E. F. Skelton, A. W. Webb, N. Moulton, J. Z. Hu,
and J. K. Furdyna, Phys. Rev. B 45, 5670~1992!.
20P. Maheswaranathan, R. J. Sladek, and U. Debska, Phys. Rev. B
31, 5212~1985!.
21J. Bak, U. Venkateswaran, C. L. Mak, R. Sooryakumar, and B. T.
Jonker, J. Phys. Chem. Solids 56, 563~1995!.
22A. K. Arora and T. Sakuntala, Phys. Rev. B 52, 11 052~1995!. 23A. K. Arora, E. K. Suh, U. Debska, and A. K. Ramdas, Phys.
Rev. B 37, 2927~1988!.
24H. K. Mao, J. Xu, and P. M. Bell, J. Geophys. Res. 91, 4673 ~1986!.
25J. Xu, H. K. Mao, and P. M. Bell, Acta Phys. Sin. 36, 500~1987!. 26
J. Xu, J. Yen, Y. Wang, and E. Huang, High Pres. Res. 15, 127
~1996!.
27G. D. Lee and J. Ihm, Phys. Rev. B 53, R7622~1996!.
28C. L. Mak, R. Sooryakumar, B. T. Jonker, and G. A. Prinz, Phys.
Rev. B 45, 3344~1992!.
29R. J. Nelmes, M. I. McMahon, N. G. Wright, and D. R. Allan,
Phys. Rev. B 51, 15 723~1995!.
30M. Blackman and W. B. Daniels, in Light Scattering in Solids IV,
edited by M. Cardona and G. Gu¨ntherodt ~Springer, Berlin, 1984!, Chap. 8.