MEASUREMENT SCIENCE REVIEW, Volume 13, No. 5, 2013
A Method for Extracting Suspected Parotid Lesions in CT
Images using Feature-based Segmentation and Active Contours
based on Stationary Wavelet Transform
T. Y. Wu
1,2, S. F. Lin
11
Department of Electrical Engineering, National Chiao Tung University, No.1001, Ta Hsueh Rd. , Hsinchu City 300, Taiwan (R.O.C.), [email protected], [email protected]
2
Industrial Technology Research Institue, Center of Measurement and Standard, No.321, Sec. 2, Kuangfu Rd., Hsinchu City 300, Taiwan (R.O.C.) , [email protected]
Automatic suspected lesion extraction is an important application in computer-aided diagnosis (CAD). In this paper, we propose a method to automatically extract the suspected parotid regions for clinical evaluation in head and neck CT images. The suspected lesion tissues in low contrast tissue regions can be localized with feature-based segmentation (FBS) based on local texture features, and can be delineated with accuracy by modified active contour models (ACM). At first, stationary wavelet transform (SWT) is introduced. The derived wavelet coefficients are applied to derive the local features for FBS, and to generate enhanced energy maps for ACM computation. Geometric shape features (GSFs) are proposed to analyze each soft tissue region segmented by FBS; the regions with higher similarity GSFs with the lesions are extracted and the information is also applied as the initial conditions for fine delineation computation. Consequently, the suspected lesions can be automatically localized and accurately delineated for aiding clinical diagnosis. The performance of the proposed method is evaluated by comparing with the results outlined by clinical experts. The experiments on 20 pathological CT data sets show that the true-positive (TP) rate on recognizing parotid lesions is about 94%, and the dimension accuracy of delineation results can also approach over 93%.
Keywords: Parotid, CT image, stationary wavelet transform, image segmentation, active contour.
1. INTRODUCTION
OMPUTER-AIDED DIAGNOSIS (CAD) is widely discussed in recent years, and also has been developed to improve medical automation. In clinical applications, automatic segmentation of organs, soft tissues and even lesions in medical images is an important procedure, and several traditional image process methods were applied in previous researches on various medical images [1]. For example, Wong et al. [2] utilized snake algorithm for segmenting liver’s abdominal CT images, and Stawiaski et al. [3] and Seo et al. [4] proposed watershed algorithm and active contour method for segmenting tumor regions in liver. Hadjiiski et al. [5] also utilized run length statistic texture features for mammogram classification. Automatic segmentation of parotid glands in head and neck (H&N) CT images have also drawn a lot of attention in recent years, not only for assisting image-based diagnosis but also for modern radiation therapy planning [6]. For diagnosis, parotid glands need to be taken into consideration because lesions in parotids may be associated with diseases [7]. Besides, in order to minimize the dose on treatment to reduce the harmful radiation toxicity, modern therapies like IMRT also require computer-aided delineation for prior planning to prevent the patients from suffering side effects. However, due to low contrast on tissue boundaries, complexity of the tissues and organs and the variability of anatomy between patients, it is still a challenging task to automatically segment the soft tissues of parotid glands whether normal or lesions in 2D H&N CT slices which are still frequently used in practice. Although CT images are useful to see the anatomical detail, it needs well-trained techniques to sketch out the glands and suspected regions in complex anatomical
structures for medical evaluation and diagnosis. As the amount of data grows with the progress of medical imaging techniques, medical automation is in much demand because the manual processes become tedious and exhausting.
In previous researches about automatic segmentation of parotid tissues, several image processing methods, like active contours and gray level-based region growing, were mentioned. Active contour models (ACMs) are methods to generate continuous boundaries converging at the pixels of relatively high gradient magnitude [8]. Because ACMs can perform higher accuracy than statistical or texture feature-based segmentation (FBS) on blurred edges between soft tissues, this kind of methods are often mentioned in segmentation of tissues, even tumors in CT images. However, active contours are easily attracted by the nearby points with high gradient, so initial contours appropriately located can improve computation efficiency and prevent false contouring. Therefore, some atlas-based active contour approaches have been proposed in recent years for manual or semi-automatic delineation of the parotid glands [9], [10]. Atlas-based methods applied the contour delineating of the parotid regions as templates to outline the parotids in other CT images, and the template contours were built by fusing numerous contours drawn by experts with statistical methods. However, preliminary evaluations were required to select a proper contour template because of the variation of the anatomical structures between patients. In [9], Ramus et al. performed an intensity-weighted majority vote that combined the segmentations based on the local sum of square distances between the registered atlas images and similar intensity distribution to the patient image for the registration. Yang et al. [10] evaluated the template atlas
C
MEASUREMENT SCIENCE REVIEW, Volume 13, No. 5, 2013
based on the principle component analysis (PCA) method to decide the optimal candidates for active contour iterations. These works have been proposed to delineate the whole parotid gland regions, but the suspected lesions in parotids are still hard to be found automatically. Because suspected lesions may occur in various dimensions at unpredictable locations, it is hard to build templates for suspected lesions in images.
In previous works on lesion detection, organs and lesions were generally considered to be figured out with their gray intensities, so gray level thresholding was a popular method that can discriminate the abnormal regions in liver and breast with obvious intensity inhomogeneity [11]-[13]. However, it was hard to determine adaptive and stable thresholds because of brightness variation and low contrast, and the non-lesion regions with similar gray intensities may also be incorrectly found. To automatically extract parotid lesions, besides gray intensities, region segmentation requires higher-order local features and the lesion regions need to be automatically identified and localized among the complex segmented tissue regions. In other researches, ACM-based methods were also mentioned to delineate suspected lesions [14], [15]. However, traditional gradient-based ACMs encounter difficulties on blurred boundaries between normal and pathology tissues. In [15], Achuthan et al. proposed and improved the level set ACM to segment lesion tissues surrounded within a similar tissue region in CT images, but it was not sufficient for extracting lesions surrounded by various tissues. Besides, initial contours still need to be placed manually near the real boundaries preventing that the contour may be attracted by other strong edges. In [16], [17], the initial boundaries of organs in abdominal CT images were extracted by gray level thresholding based on statistical gray-intensity histogram of a region of interests (ROI), and the accurate tissue boundaries were outlined by adjusting the segmentation results with gradient maps and edge points. In [18], the initial contours for extracting tumors in brain MRI were obtained by clustering pixels of similar gray level. However, gray level distribution is not sufficient for segmenting the lesion tissues in parotids well. Besides, the weak boundaries of parotid lesions also cannot effectively attract the contours so that the initial contours for fine delineation need to be placed manually.
In order to automatically extract the suspected parotid lesion regions and improve the automation and accuracy for clinical evaluation, we propose a method comprising two main stages:
1. In lesion localization, the low contrast tissues in parotid regions are segmented with wavelet-based texture features and the lesion regions can be identified with geometric shape features (GSF) and localized.
2. In fine delineation, modified ACM computation with the initial conditions derived from lesion extraction and the enhanced feature map can improve the computation efficiency and delineation accuracy of the parotid lesions
Above all, stationary wavelet transform (SWT) is mentioned and utilized in both stages. The subject and the proposed methods are described in Sec. 2 and Sec 3, respectively. In Sec. 4, the experiment results are shown and the performance of the proposed method is evaluated by comparing with the results from clinical experts.
2. SUBJECT
An H&N CT image is shown in Fig.1. Parotid glands are anatomically located at both lateral sides of the neck, so that the regions of interest (ROI) can be set at both sides of the spine and the air path in the center of the section. It can be seen that the soft tissues including parotid glands have lower contrast and weaker boundaries in the CT images than the bones and air path.
Fig.1. An H&N CT image and the parotid glands.
A pathological parotid gland is shown in Fig.2., and the inner contour delineates the skeptical lesion which needs to be considered. Moreover, in some cases, lesions may be large and may occupy a great part of the parotids.
Fig.2. An H&N CT image with parotid pathology.
The framework proposed in this paper is shown as the summarizing block diagram below (Fig.3.).
The proposed scheme starts from SWT, and the coefficients are utilized to derive the texture features for FBS and wavelet-based energy map (WEM) denoting the local energy for ACM delineation. In localization shown in Fig.3., FBS is used to segment the soft tissue into regions, and then morphological process and geometric feature analysis are proposed to extract and recognize the lesions from the segmentation results. Then in fine delineation, initial contours are derived from the lesion segmentation results, and wavelet coefficient manipulation is applied to enhance the energy features in WEM to improve the ACM performance on tissue boundaries. As a result, the lesion regions can be automatically localized and extracted, and the derived information can be applied for clinical evaluation.
MEASUREMENT SCIENCE REVIEW, Volume 13, No. 5, 2013
Fig.3. Schematic diagram of the proposed method.
3. METHODS
In this section, the methods proposed in this work are described. At first, SWT is introduced, and the methods to derive texture features and enhance the wavelet-based energy features are both mentioned. Besides, the morphological process and GSFs to extract the lesion regions are introduced after FBS, and methods to set the initial conditions to improve the ACM performance are also described in this section.
A. Stationary Wavelet Transform (SWT)
SWT is a modified method proposed to overcome problems such as translation variance in discrete wavelet transform (DWT). DWT is a method utilizing a pair of bi-orthogonal digital high-pass and low-pass filters which can decompose a signal into sub-bands to capture both time and frequency information of digital signals. The one level convolution of a discrete one-dimensional (1-D) signal f[x] can be computed by (1) and (2).
∑
× − = x j L j L jk f x h x k W ( , ) 2 /2 [ ] [2 ] (1)∑
× − = x j H j H jk f x h x k W ( , ) 2 /2 [ ] [2 ] (2)where WL and WH denote the approximation coefficients and detail coefficients, respectively, hL and hH are a pair of bi-orthogonal high-pass and low-pass wavelet filters, and j is the scale parameter. In DWT, a 1-D signal is decomposed into two sub-bands, and each sub-band can be continuously decomposed in cascades into the other sub-bands at different scales. Two-dimensional (2-D) DWT can be implemented by convolving the signal with wavelet filters along both directions, and the 2-D signal can be as a result decomposed into four sub-bands, including Low-Low (LL), Low-High (LH), High-Low (HL) and High-High (HH). LL is the approximate sub-band while LH, HL and HH are the detail sub-bands of horizontal, vertical and diagonal directions, respectively. In traditional DWT, each convolution operation is followed by dyadic down-sampling and sub-band coefficients are down-sampled by 2, so
translation-invariance cannot be preserved. Translation-translation-invariance is an important property for applications such as alignment, pattern recognition and detection. In [19]-[22], several translation-invariant DWT methods including a trous algorithm, redundant DWT (RDWT) and SWT were proposed to avoid over-smoothing of the signals in DWT denoising, or to reserve more significant signal properties and keep the location without translation. In [23], Hu et al. utilized the SWT to derive the contourlet coefficients which require more detailed local features. SWT is an un-decimated wavelet transform (WT) and it can capture time-frequency information while keeping the location invariance. Besides, unlike a trous algorithm, SWT can preserve directional information in 2-D signals and does not need recursive computation in RDWT [19], [20].
The implementation of SWT algorithm is similar to DWT but convolution operations in SWT are not followed by down-sampling. Instead, SWT up-samples the wavelet filters by inserting zeros to realize the multi-scale analysis. Hence, the approximation and detail sub-bands of SWT can both keep the same size as the original data. A wavelet filter
h with length of n at 0th level can be written as (3).
] , ,..., , [ 1 2 1 0 n n h h h h h = − (3)
The filter becomes (4) at a higher level.
] , 0 , ,... 0 , , 0 , [ 1 2 1 1 n n h h h h h = − (4)
Hence, 2-D SWT can be implemented by computing the following equations (5)-(8) and four sub-bands can also be generated.
∑
× − × − = y x Lj Lj LL j x y f x y h x m h y n W , , , [ ] [ ] ] , [ ) , , ( (5)∑
× − × − = y x Lj H j LH j x y f x y h x m h y n W , , , [ ] [ ] ] , [ ) , , ( (6)∑
× − × − = y x H j Lj HL jx y f x y h x m h y n W , , , [ ] [ ] ] , [ ) , , ( (7)∑
× − × − = y x H j H j HH j x y f x y h x m h y n W , , , [ ] [ ] ] , [ ) , , ( (8)where hL,j and hH,j are the wavelet filter pairs in jth level,
WLL, WLH , WHL and WHH denote the coefficients in LL, LH, HL, and HH sub-bands.
(a) (b)
Fig.4. Illustrations of DWT and SWT, and the four sub-bands respectively (a) DWT (b) SWT.
MEASUREMENT SCIENCE REVIEW, Volume 13, No. 5, 2013
The sub-bands of SWT as expressed in Fig.4(b). have the same size as the original image and do not suffer from resolution degradation as DWT in Fig.4(a). To extract the tissue regions of lesions, the SWT coefficients are applied to derive the local features of tissue regions for segmentation. Besides, the sub-bands with the same size as the original image are also utilized to derive the modified energy feature map for ACM that each pixel in the feature map can directly correspond to each pixel in the original image.
B. Lesion localization with feature-based segmentation (FBS) and geometric shape features (GSFs)
FBS is applied to segment regions by discriminating their local features derived from regional pixels, such as gray level distribution and texture features. In previous works, lesions in medical images could be found by figuring out the tissue regions with the different features from the normal regions. Hence, with reliable features, tissue regions can be segmented by means of segmentation algorithms, and the lesion regions can also be discriminated and localized. Texture feature analysis is an effective method that can describe the regional features in images, and has been introduced in previous works to segment the suspected tumor regions of livers in abdominal CT images and brains in MRI [24]-[27]. Beside gray level intensities, texture features mainly express the relationship between a pixel and its neighbor pixels. Deriving texture features with the wavelet coefficients in sub-bands is one of the most popular methods. Various texture features have been introduced for applications based on statistical computation of the wavelet coefficients [28], [29]. However, different from SWT, traditional WT coefficients are down-sampled during decomposition and more than one adjacent pixel in original images shares a wavelet coefficient in sub-bands such that the derived features may be over-smoothed as mentioned in [21]. Therefore, with SWT coefficients, fine texture features can be preserved. In this work, three feature measures including energy, mean and variance are adopted in companion with gray level for soft tissue region segmentation and computed by (9)-(11):
∑
∈ = mask j i j i W N Energy , 2 , 2 1 (9)∑
∈ = mask j i j i W N Mean , ) , ( 1 (10) 2 , 2 (, ) 1∑
∈ − = mask j i Mean j i W N Variance (11)where i, j mean the column and row indices of the pixels inside the mask, Wi,j means the wavelet coefficients and N is the number of pixels in the mask which are gathered to calculate the energy. The sub-band LL which contains the approximation coefficients along row and column directions can be thought to have a smoothed image blurred by low-pass filters, and can represent the information about local gray intensities. Energy is an effective feature for texture
characterization, and is calculated mainly with the detail coefficients to reflect the distribution of the variation along the frequency. The mean and variance are the descriptors used to describe the local statistical features. Based on these feature descriptors, image segmentation algorithms are aimed to connect pixels in an image appearing with similar features into regions.
In H&N CT images, the gray values of the pixels at the bone tissues are high and low at the holes between anatomical structures or inside the air path. Therefore, the bones and the spaces in images can be pre-eliminated before the segmentation process in order to reduce the computation. The empirical gray level thresholds for the images from a machine can be obtained by observing the brightness reaction in numerous images captured by the same machine. The feature vectors can be preliminarily selected such that only the feature vectors which correspond to the pixels having gray intensity within the high and low thresholds are eligible for the feature classifying computation.
After feature descriptors corresponding to the pixels are derived, the pixels having similar features can be related by classifying the feature vectors. K-means is an unsupervised segmentation algorithm to classify a group of n-dimensional feature vectors into k clusters [30]-[31], and similar feature vectors can be classified into the same cluster. In medical image applications, k-means has been utilized in the liver and brain tissue segmentation in abdominal CT images and MRI images [32]-[34]. The main concept of k-means is to minimize the sum of the square distance from each point to the center of the group that it is assigned to. As a result, the adjacent pixels with similar features can be gathered into regions and labeled with the same grouping indices.
Hence, the soft tissue can be segmented into regions with texture features (Fig.5(b).). Then, the following morphological process is proposed to extract the suspected regions from the segmentation results.
Step 1. Erode the extracted regions after segmentation. Step 2. Label each separate region with a unique number. Step 3. For each labeled blob, fill the holes inside.
Step 4. Dilate the filled blob with the mask of the same size
at Step 1.
Step 5. Remove the region if the area is smaller than the
threshold.
Step 6. Go to Step 3 until all labeled regions in Step 2 are
processed.
The threshold in Step 5 used to remove the small fragments can be determined with regard to the requirement that the smallest dimension of the lesion needs to be figured out in images.
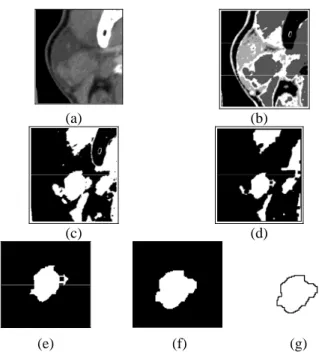
In Fig.5., the FBS and morphological process to localize the suspected lesion region is presented. Fig.5(b). represents the FBS result of Fig.5(a). with k-means segmentation, and Fig.5(c). to Fig.5(f). illustrate the morphological process to extract the segmented regions. The blob in Fig.5(f). is one of the labeled blobs with eligible size to be extracted in Fig.5(d). As a result, Fig.5(g). is the boundary contour of the extracted region.
MEASUREMENT SCIENCE REVIEW, Volume 13, No. 5, 2013
(a) (b)
(c) (d)
(e) (f) (g)
Fig.5. (a) An original parotid CT image (b) The result of FBS with k-means (c) Segmented tissue regions (d) Erosion process (e) An extracted blob from (e) (f) Filling and dilation process (g) the extracted boundary of (f).
After FBS and the morphological process, more than one tissue region is extracted (Fig.5(d).), but not every extracted region is lesion region requiring fine delineation. In accordance with clinical experience, shape is an important feature of suspected lesions. Therefore, each extracted blob is then analyzed for their GSFs, and the suspected regions can be found among the segmentation results. Three GSFs are introduced, including form factor, aspect ratio, and circularity.
Form factor F can be derived by (12):
2 4 ROI ROI P A F= π (12)
where AROI is the area of the region, and PROI means the perimeter of the region.
Aspect ratio A and circularity C can be computed by (13) and (14), respectively. min max L L A= (13) R R C σ μ = (14)
where μR is the mean of the distance from the average center of the region to the bounding points, and σRis the quadratic
mean of the deviation of the relative distance:
= 1
∑
(x,y)−(x,y) N i i R μ (15) R 1 ((xi,yi) (x,y) R)2 N μ σ =∑
− − (16)where (x, y) denotes the coordinates of the bounding points and (x,y) is the average.
As shown in Table 1., the GSFs of three extracted pathological regions are listed, and three examples of normal tissue regions are also listed in Table 2.
Table 1. Extracted blobs of suspected tissue regions and the GSFs.
GSF
F 0.905 1.347 0.699
C 3.086 10.013 2.338
A 1.690 1.015 1.381
Table 2. Extracted blobs of normal tissue regions and the GSFs.
GSF
F 0.271 1.347 0.461
C 0.399 1.169 0.273
A 1.642 1.922 8.619
According to the clinical experts and by observing the pathological images, most parotid lesions are approximately rounded and concentrated. Numerous images with typical parotid pathologies are selected. The lesion regions are delineated by clinical experts and the shape of lesion regions is analyzed for their GSFs. Some of the typical pathological images are shown in Fig.6.
Fig.6. Some images with typical parotid pathologies and the lesions are delineated by clinical experts in green.
Conclusively, we propose a rule expressed in (17) based on the analysis of the shape features of typical pathological lesions with tolerance for fear to wrongly neglect the lesions.
(C ≥ 2.2or A≤1.8)and (F ≥0.7) (17) After analyzing each segmented region, only the regions having similar shape features with lesions are preserved. As a result, the suspected lesion regions can be localized, and the segmentation results are utilized for the following fine delineation.
MEASUREMENT SCIENCE REVIEW, Volume 13, No. 5, 2013
C. Fine delineation with automatic initial conditions and modified feature map
After localizing the lesion regions, in order to delineate the lesion regions with higher accuracy, geodesic active contour (GAC) is used. It is an ACM method simplifying the snake method and using the gradient value as the external energy parameter [35]. The gradient can be thought to have more distinct boundary features while the main idea of this kind of GAC is to minimize the energy function which controls the smoothness of the curve and attracts the curve toward the boundaries. The traditional energy function in GAC can be written as (18). dp p p C p C I g p C E
∫
∂ ∂ ∇ = ( ( ( ))) ( ) ] ) ( [ (18)where C(p) means a contour,
2 1 1 ) ( x x g + = is a
monotonically decreasing stopping function and ∇I is the gradient of an image I.
The terms in (18) include the external energy which is responsible for attracting the contour towards the object in the image and the internal energy to control the smoothness of the contour. In order to deform an initial contour towards the local minima of (18), the steady state solution is given by Ct g I k g I N N r r ] ) ( ) ( [ ∇ −∇ ∇ ⋅ = (19)
where t denotes the time as the contour evolves, k is the Euclidean curvature andNrmeans the unit inward normal to the curve C. In order to solve the geodesic problem, level set formulation is introduced and curve C is considered as a zero level set function in (20).
z=φ(x,y,t) (20) where φ=[a,0]×[b,0]→ℜ.
Hence, the contour can be represented with a signed distance map measuring the minimum distance from the contour to a point. GAC evaluation can be implemented in companion with the distance map and gradient energy as written in (21).
Δφt=g(∇I)k∇φ +∇g(∇I)⋅∇φ (21)
the normal and curvature can be evaluated by
φ φ ∇ ∇ − = Nr and ) ( φ φ ∇ ∇ = div k , respectively.
It is shown that the initial contours and gradient can highly affect the GAC results. Instead of manual placement, the extraction results of the lesion regions can be used to derive the initial contours. In Fig.7(a)., a boundary of an extracted region is extracted and then transformed into a distance map as shown in Fig.7(b)., and the signed distance map can be utilized as the initial condition for GAC.
(a) (b)
Fig.7. (a) A boundary of an extracted region (b) The distance map of (a). The brighter points mean the longer distance from the contour. The points inside the contour are set to negative distance.
Although the initial contour close to the tissue regions can be obtained, in GAC curve evolution, the external energy controls the movement to the real tissue boundaries, and is associated with the gradient magnitude. However, as for soft tissues in CT images, the regions are noisy and do not have sufficient gradient to attract the active contours. Instead of the traditional method, the gradient magnitude in (19) can be obtained using the square sum of the detail coefficients of SWT as in (22). 2 2 2 HH LH HL W W W I = + + ∇ (22)
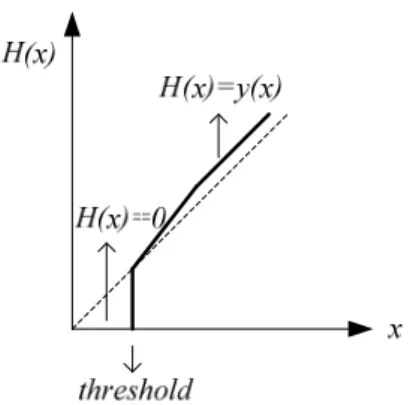
Wavelet coefficient manipulation is a method used for image enhancement and noise attenuation by adjusting the local coefficients based on a designed mapping function. In addition to wavelet shrinkage for image denoising, functional mapping method also has been proposed for enhancing the detail features in X-ray images [37]-[39]. The wavelet coefficients can be adjusted based on the mapping function H, as demonstrated in Fig.8., so that the wavelet-based gradient energy with the modified wavelet coefficients can be computed by
∇Iˆ2=H2(WHL)+H2(WLH)+H2(WHH) (23)
However, in the soft tissue regions with low contrast, the distribution of the original wavelet coefficients is concentrated. In order to enhance the features derived from the wavelet coefficients, the wavelet-based gradient energy can be directly mapped by (24).
∇Iˆ2=Hˆ(WHL2 +WLH2 +WHH2 )=Hˆ(∇I2) (24)
where Hˆ is the mapping function for energy features as demonstrated in Fig.8., combining shrinkage and mapping manipulation as written in (25).
MEASUREMENT SCIENCE REVIEW, Volume 13, No. 5, 2013
Fig.8. The mapping of the input coefficients to output coefficients with mapping function H(x). The dotted line means H(x)=x.
⎪⎩ ⎪ ⎨ ⎧ ≥ = else , 0 if , ) ( ) ( ˆ x y x x threshold H (25)
where y(x) is a piecewisely continuous mapping function designed for adjusting the features with values higher than
threshold. The gradient magnitude in (19) can be replaced
with the enhanced feature ∇ˆI2, and the stopping function
g(x) is computed by ) ( ˆ 1 1 ˆ 1 1 ) ˆ ( 2 2 2 2 HH LH HL W W W H I I g + + + = ∇ + = ∇ . (26)
The fine delineation computation is initialized with the signed distance function based on the contours extracted from FBS results and the enhanced energy map. To precede the iterations, fast marching is a fast front propagation framework [40]. The front propagation considers the pixels in a narrow band around the existing front and solves the propagation equation to move the front ahead and bring new pixels into the narrow band. The operation keeps until it approaches the region boundaries and the front does not move anymore. Hence, the segmentation results can help locate the initial conditions near the real region boundaries and the iteration times for convergence can be reduced.
4. RESULTS AND DISCUSSION
This section describes the experiment results of the proposed method to extract the parotid lesion regions. In order to evaluate the proposed method used for segmenting the parotid lesions, the performances of the two main stages are both evaluated. The experiment results are compared with the results delineated by the clinical experts for accuracy, and also compared with the results using the method proposed in [15]
A. Experimental data
In this work, 20 pathological CT sets were used to evaluate the results, and totally 137 images with parotid lesions were selected in the experiment. The CT dataset were collected from Cathay General Hospital (CGH) and the
pathological images were selected by the clinical experts in the database. The CT images were scanned by Phillip Brilliance 64 scanner and the pixel spacing of the CT images was 0.78×0.78 mm2. In order to evaluate the performance to discriminate the suspected lesions, another 100 images with normal parotids were also used.
B. Quantitative evaluation
The performance of lesion region segmentation is evaluated by the true positive (TP) and false positive (FP) rates. TP is a portion of lesion region correctly segmented and the results are acceptable for clinical evaluation. FP is a portion of non-lesion region incorrectly recognized as a lesion. Lesion dimension is highly considered in diagnosis and treatment evaluation, so the fine delineation results are computed for their area and perimeter comparing with the results drawn by clinical experts for accuracy. The accuracy is computed by =(1− − )×100% B B A acc (27)
where A is the result derived by the proposed method and B is the result from the clinical experts. The TP cases are evaluated for accuracy to evaluate the performance of fine delineation.
C. Tissue segmentation and lesion localization
Fig.9. illustrates some results after FBS and morphological process. GSF rule (17) is then involved to determine the suspected regions. The GSFs of the extracted tissue regions in Fig.9. are listed in Table 3. In this work, the lesions with diameter larger than 2 cm are required to be found, so the threshold of area used to remove the small fragments is 100 pixels, with respect to the resolution of the images.
Table 3. GSFs of the extracted regions in Fig.9. examples
No. F C A Suspected (a)-1 0.905 3.086 1.690 Yes (a)-2 0.281 0.439 2.063 No (b)-1 1.043 9.691 1.526 Yes (c)-1 1.067 21.156 1.093 Yes (c)-2 0.612 0.467 3.315 No (d)-1 0.908 1.954 1.231 Yes (d)-2 0.755 1.605 1.495 Yes(false) As shown in Fig.9., the suspected lesions can be identified among the extracted tissue regions based on the GSFs. Fig.9(d)-2. is an FP example that a segmented non-lesion region is adjacent to the real pathological region but wrongly recognized. In the experiment on 20 CT series, the average TP rate is 94.1 % over the 137 recognized pathological images and the average FP rate is 10.8 %, and most failed cases are due to unsatisfactory extraction results. In the experiment on the 100 images of normal parotids, non-lesion regions were incorrectly found in 8 images.
MEASUREMENT SCIENCE REVIEW, Volume 13, No. 5, 2013
Original Extracted regions
(a) (a)-1 (a)-2
(b) (b)-1
(c) (c)-1 (c)-2
(d) (d)-1 (d)-2
Fig.9. Examples of FBS and region extraction.
D. Fine delineation of lesion regions
After the suspected lesion regions are extracted, the initial contours for GAC fine delineation can also be derived. In Fig.10., the delineation results are labeled in red and the segmentation results used to derive the initial contours are also presented on the right.
(a) (b)
(c) (d)
(e) (f)
Fig.10. Examples of GAC delineation of suspected regions using enhanced WEMs and the initial condition maps.
In Fig.10., the initial contours near the real tissue boundaries can improve the convergence, and can help the contours not to be affected by scattered light as in Fig.10(e). Less than 20 iterations are required in the GAC computation with the proposed enhanced WEMs. The proposed method is also compared with the GAC results using gradient-based energy maps. Although the modified initial contours can help the GAC to go to the real boundaries, GAC using traditional gradient-based energy maps in many cases are still not correctly attracted to the tissue boundaries (Fig.11.). However, the same pathological images in Fig.11. can be effectively delineated with the proposed enhanced WEM (Fig.10(a). and Fig.10(f).).
(a) (b)
(c) (d)
Fig.11. (a).(c).GAC results using WEM. (b)(d) GAC results using gradient-based energy map with the same test images as (a) and (c) respectively.
Original WELSAC Proposed method
(a) (d) (g)
(b) (e) (h)
(c) (f) (i)
Fig.12. (d)-(f) are the delineation results of (a)-(c)using the WEBLS and (g)-(i) are the results of the proposed method in this work.
In Fig.12. are some examples of parotid lesion segmentation using wavelet energy-guided level set active contour (WELSAC) proposed in [15]. Replacing the manual initial contour in [15], the initial contours are placed based on the method proposed in this work. The two methods proposed in Fig.12. are based on the same initial contour but
MEASUREMENT SCIENCE REVIEW, Volume 13, No. 5, 2013
the WEBLS cannot correctly delineate the parotid lesions. In most cases, WEBLS delineate the tissue regions with strong boundaries but not the parotid lesions with weak boundaries, so most of the delineation results are not reasonable for medical evaluation of the parotid lesions.
In the experiment, the proposed method in this study can achieve satisfying results and the average accuracy of area is 94.8 % and perimeter is 93.7 %. The TP rate and accuracy in percentage of each CT set are demonstrated in Fig.13.
0% 10% 20% 30% 40% 50% 60% 70% 80% 90% 100% 1 2 3 4 5 6 7 8 9 10 11 12 13 14 15 16 17 18 19 20 Area Perimeter TP
Fig.13. TP rate of lesion recognition and delineation accuracy in percentage of each CT set.
E. Discussion
In lesion localization, besides FBS that can improve segmentation of parotid tissues, shape features analysis used to determine the lesion regions among the segmentation results (Fig.5(b).) can also improve the automation. The GSF rule (17) used to identify the lesion regions is induced from numerous typical pathologies in previous works and has been adjusted in clinics, so not only the 20 cases in this experiment; we believe that the rule is also appropriate for other cases. Identification of lesions is affected by the results of tissue extraction whether in TP or FP cases. Most positive lesion regions but incorrectly recognized are due to unsatisfying segmentation on the boundaries or the mask effect from morphological process, such that the adjacent tissues are wrongly connected with the lesion regions. In these cases, ACM can improve the results by placing the initial contour inside the segmented regions to separate the wrongly connected tissues.
As to FP cases, some regions with uniformed local features may be extracted and wrongly recognized because of similar shape features with lesion regions. However, for fear of missing the risky lesions in pre-inspection, tolerance is required and higher FP rate can be acceptable. The target with too small area in images may be easily neglected or merged into other larger regions. Besides, the morphological process used to remove the small regions and separate the connected regions may deform the lesion regions because of the mask effect. In fine delineation, FBS results can be adjusted and the automatic placement of initial contours can improve the ACM computation performance. In experiment, less than 20 ACM iteration times are required in each image. Besides, the WEM proposed in this work can enhance the boundary features and improve the property on attracting the contour. The contouring results are better than traditional gradient-based map with the same initial conditions
(Fig.11.). The gradient map is not sufficient enough and the active contours are attracted by the edges stronger than the tissue boundaries. Besides, the WELSAC method proposed in [15] also achieves unsatisfying results on segmenting the parotid lesions. The main idea of WEBLS is to segment two similar lesion and non-lesion regions by dividing the energy feature map derived with traditional DWT. However, there are always more than two tissues with various features surrounding the parotid lesion tissues, and the translation variance in DWT can also blur the tissue boundaries. Only in few cases, the images with significant lesion regions can be extracted but with low accuracy. Besides, scattered light due to metal reflection may result in strong light variation and is another significant problem in CT images.
As shown in Fig.9(c). and Fig.12(i)., the extraction results are not seriously affected by the slight scattered light. However, the proposed method may fail if intense scattered light covers a large area of parotids. In recent years, more and more patients are equipped with metal parts in the bodies, and a large amount of the images may be affected by scattered light. Therefore, it requires developing methods to remove the scattered light ray in images to reduce the influence. In this work, Daubechies wavelets are applied because of their dominant properties. The higher-order Daubechies wavelet with longer filter length may blur the features for both segmentation and delineation, so the degree of Daubechies wavelet also depends on the resolution of images. According to the resolution of the CT images for experiment in this work, first and second order Daubechies wavelets are applied, and can approach more reasonable results than higher order Daubechies wavelets. As a consequence, the final extraction results can also be verified by comparing with the results from the adjacent slices, because the lesions should not vary a lot in two continuous slices. With reliable accuracy, the dimension of the extracted lesions can be automatically measured for clinical evaluation in clinics.
5. CONCLUSIONS
The objective purpose of the present work is to develop a method that can automatically extract the parotid lesions in H&N CT images, in order to improve medical automation on diagnosis and treatment planning. The proposed scheme in this work can approach automatic localization of the suspected lesion regions and automatic delineation of the lesion boundaries. Localization of lesions by means of local features and shape features can improve the automation and performance on accurate delineation. Besides, GAC with the proposed enhanced feature maps can perform in higher efficiency on computation. Because of the variation of image quality, the performance can be adjusted by designing appropriate mapping functions in (24) for feature enhancement. As the increase of the medical images, the proposed scheme provides a method to reduce the manual process. The extracted information can be helpful for clinical evaluation and diagnosis confirmation. Our future works include collecting more pathological images to improve the recognition accuracy and extending the scheme to other images for medical applications.
MEASUREMENT SCIENCE REVIEW, Volume 13, No. 5, 2013
REFERENCES
[1] Mikulka, J., Gescheidtova, E., Bartusek, K. (2012). Soft-tissues image processing: Comparison of traditional segmentation methods with 2D active contour methods. Measurement Science Review, 12
(4), 153–161.
[2] Wong, D., Liu, J., Fengshou, Y., Tian, Q., Xiong, W., Zhou, J., Wang, S.C. (2008). A semi-automated method for liver tumor segmentation based on 2D region growing with knowledge-based constraints. The
Midas Journal.
[3] Stawiaski, J., Decenciere, E., Bidault, F. (2008). Interactive liver tumor segmentation using graph-cuts and watershed. In Workshop on 3D Segmentation in
the Clinic: A Grand Challenge II. Liver Tumor Segmentation Challenge (MICCAI 2008).
[4] Seo, K.S., Chung, T.W. (2005). Automatic boundary tumor segmentation of a liver. In Computational
Science and Its Applications (ICCSA 2005), LNCS
3483. Springer, 836-842.
[5] Hadjiiski, L., Sahiner, B., Chan, H.P., Petrick, N., Helvie, M.A., Gurcan, M. (2001). Analysis of temporal changes of mammographic features: Computer-aided classification of malignant and benign breast masses. Medical Physics, 28 (11), 2309-2317. [6] Shimizu, A., Hitosugi, T., Nakagawa, J.Y., Tamura,
M., Kobatake, H. (2003). Development of computer-aided diagnosis system for 3D multi-detector row CT images of livers. In International Congress Series, 1256, 1055-1062.
[7] Amirlak, B., Chim, H., Chen, E.H., Stepnick, D.W. (2013). Malignant parotid tumors. http://emedicine. medscape.com/article/1289616-overview.
[8] Kass, M., Witkin, A., Terzopoulos, D. (1988). Snakes: Active contour models. International Journal of
Computer Vision, 1 (4), 321-331.
[9] Ramus, L., Malandain, G. (2010). Multi-atlas based segmentation: Application to the head and neck region for radiotherapy planning. In Medical Image Analysis
for the Clinic : A Grand Challenge (MICCAI 2010),
281-288.
[10] Yang, J., Zhang, Y., Zhang, L., Dong, L. (2010). Automatic segmentation of parotids from CT scans using multiple atlases. In Medical Image Analysis for
the Clinic : A Grand Challenge (MICCAI 2010),
323-330.
[11] Rosin, P.L. (2009). Classification of pathological shapes using convexity measures. Pattern Recognition
Letters, 30 (6), 570-578.
[12] Moghe, A.A., Singhai, J., Shrivastava, S.C. (2011). Automatic threshold based liver lesion segmentation in abdominal 2D-CT images. International Journal of
Image Processing (IJIP), 5 (2), 166.
[13] Nguyen, V.D., Van Nguyen, T., Nguyen, T.D., Nguyen, D.T., Van Hoang, H. (2010). Detect abnormalities in mammograms by local contrast thresholding and rule-based classification. In Third
International Conference on Communications and Electronics (ICCE), 11-13 August 2010. IEEE,
207-210.
[14] Brieva, J., Gonzalez, E., Gonzalez, F., Bousse, A., Bellanger, J.J. (2006). A level set method for vessel segmentation in coronary angiography. In 27th Annual
International Conference of the Engineering in Medicine and Biology Society (IEEE-EMBS 2005),
17-18 January 2006. IEEE, 6348-6351.
[15] Achuthan, A., Rajeswari, M., Ramachandram, D., Aziz, M.E., Shuaib, I.L. (2010). Wavelet energy-guided level set-based active contour: A segmentation method to segment highly similar regions. Computers
in Biology and Medicine, 40 (7), 608-620.
[16] Lim, S.J., Jeong, Y.Y., Ho, Y.S. (2006). Automatic liver segmentation for volume measurement in CT Images. Journal of Visual Communication and Image
Representation, 17 (4), 860-875.
[17] Campadelli, P., Casiraghi, E., Pratissoli, S., Lombardi, G. (2009). Automatic abdominal organ segmentation from CT images. Electronic Letters on Computer
Vision and Image Analysis, 8 (1), 1-14.
[18] Wang, Y., Lin, Z.X., Cao, J.G., Li, M.Q. (2011). Automatic MRI brain tumor segmentation system based on localizing active contour models. Advanced
Materials Research, 219, 1342-1346.
[19] Lang, M., Guo, H., Odegard, J.E., Burrus, C.S., Wells Jr, R.O. (1996). Noise reduction using an undecimated discrete wavelet transform. IEEE Signal Processing
Letters, 3 (1), 10-12.
[20] Fowler, J.E. (2005). The redundant discrete wavelet transform and additive noise. IEEE Signal Processing
Letters, 12 (9), 629-632.
[21] Coifman, R.R., Donoho, D.L. (1995). Translation-invariant de-noising. In Wavelets and Statistics. Springer, LNS 103, 125-150.
[22] Dutilleux, P. (1989). An implementation of the “algorithme à trous” to compute the wavelet transform. In Wavelets. Springer, 298-304.
[23] Hu, Y., Hou, B., Wang, S., Jiao, L. (2006). Texture classification via stationary-wavelet based contourlet transform. In Advances in Machine Vision, Image
Processing, and Pattern Analysis. Springer, LNCS
4153, 485-494.
[24] Semler, L., Dettori, L., Furst, J. (2005). Wavelet-based texture classification of tissues in computed tomography. In 18th IEEE Symposium on
Computer-Based Medical Systems, 23-24 June 2005. IEEE,
265-270.
[25] Qurat-Ul-Ain, G.L., Kazmi, S.B., Jaffar, M.A., Mirza, A.M. (2010). Classification and segmentation of brain tumor using texture analysis. In 9th WSEAS
International Conference on Recent Advances in Artificial Intelligence, Knowledge Engineering and Data Bases (AIKED 2010), 147-155.
[26] Kruggel, F., Paul, J.S., Gertz, H.J. (2008). Texture-based segmentation of diffuse lesions of the brain’s white matter. Neuroimage, 39 (3), 987-996.
[27] Pham, M., Susomboon, R., Disney, T., Raicu, D., Furst, J. (2007). A comparison of texture models for automatic liver segmentation. In Medical Imaging
MEASUREMENT SCIENCE REVIEW, Volume 13, No. 5, 2013
[28] Borah, S., Hines, E.L., Bhuyan, M. (2007). Wavelet transform based image texture analysis for size estimation applied to the sorting of tea granules.
Journal of Food Engineering, 79 (2), 629-639.
[29] Phinyomark, A., Limsakul, C., Phukpattaranont, P. (2011). Application of wavelet analysis in EMG feature extraction for pattern classification.
Measurement Science Review, 11 (2), 45-52.
[30] Hartigan, J.A. (1975). Clustering Algorithms. John Wiley & Sons.
[31] Renato, C.A., Boris, M. (2012). Metric, feature weighting and anomalous cluster initializing in K-Means clustering. Pattern Recognition, 45 (3),
1061-1075.
[32] Selvamani, K., Geetha, M. (2011). Segmentation of brain MRI using K-Means clustering algorithm.
International Journal of Engineering Trends and Technology, 4 (5), 113-115.
[33] Liu, J., Hu, Q., Chen, Z., Heng, P. (2008). Adaptive liver segmentation from multi-slice CT scans. In
IFMBE Proceedings - 7th Asian-Pacific Conference on Medical and Biological Engineering. Springer,
381-384.
[34] Suzuki, K., Kohlbrenner, R., Epstein, M.L., Obajuluwa, A.M., Xu, J., Hori, M. (2010). Computer-aided measurement of liver volumes in CT by means of geodesic active contour segmentation coupled with level-set algorithms. Medical Physics, 37, 2159.
[35] Caselles, V., Kimmel, R., Sapiro, G. (1997). Geodesic active contours. International Journal of Computer
Vision, 22 (1), 61-79.
[36] Adalsteinsson, D., Sethian, J. (1995). A fast level set method for propagating interfaces. Journal of
Computational Physics, 118 (2), 269-277.
[37] Tsai, D.Y., Kojima, K. (2003). Wavelet coefficient mapping for enhancement of chest X-ray images. In
XVII IMEKO World Congress, 22-27 June 2003.
[38] Dippel, S., Stahl, M., Wiemker, R., Blaffert, T. (2002). Multiscale contrast enhancement for radiographies: Laplacian pyramid versus fast wavelet transform.
IEEE Transactions on Medical Imaging, 21 (4),
343-353.
[39] Tsai, D.Y., Lee, Y. (2003). A method of medical image enhancement using wavelet-coefficient mapping functions. In International Conference on Neural
Networks and Signal Processing, 14-17 December
2003. IEEE, Vol. 2, 1091-1094.
[40] Sethian, J.A. (1996). A fast marching level set method for monotonically advancing fronts. Proceedings of
the National Academy of Sciences, 93 (4), 1591-1595.
Received May 24, 2013. Accepted October 22, 2013.