M E T H O D O L O G Y
Open Access
Improved branch and bound algorithm for
detecting SNP-SNP interactions in breast cancer
Li-Yeh Chuang
1, Hsueh-Wei Chang
2,3,4, Ming-Cheng Lin
5and Cheng-Hong Yang
5*Abstract
Background: Single nucleotide polymorphisms (SNPs) in genes derived from distinct pathways are associated with a breast cancer risk. Identifying possible SNP-SNP interactions in genome-wide case–control studies is an important task when investigating genetic factors that influence common complex traits; the effects of SNP-SNP interaction need to be characterized. Furthermore, observations of the complex interplay (interactions) between SNPs for high-dimensional combinations are still computationally and methodologically challenging. An improved branch and bound algorithm with feature selection (IBBFS) is introduced to identify SNP combinations with a maximal difference of allele frequencies between the case and control groups in breast cancer, i.e., the high/low risk combinations of SNPs.
Results: A total of 220 real case and 334 real control breast cancer data are used to test IBBFS and identify significant SNP combinations. We used the odds ratio (OR) as a quantitative measure to estimate the associated cancer risk of multiple SNP combinations to identify the complex biological relationships underlying the
progression of breast cancer, i.e., the most likely SNP combinations. Experimental results show the estimated odds ratio of the best SNP combination with genotypes is significantly smaller than 1 (between 0.165 and 0.657) for specific SNP combinations of the tested SNPs in the low risk groups. In the high risk groups, predicted SNP combinations with genotypes are significantly greater than 1 (between 2.384 and 6.167) for specific SNP combinations of the tested SNPs.
Conclusions: This study proposes an effective high-speed method to analyze SNP-SNP interactions in breast cancer association studies. A number of important SNPs are found to be significant for the high/low risk group. They can thus be considered a potential predictor for breast cancer association.
Background
At present, identifying SNP-SNP interactions in genome-wide case–control studies is computationally and methodo-logically challenging [1]. To better understand the complex disease characteristics in case–control studies, we extended previous research of a breast cancer study and simul-taneously explored single nucleotide polymorphism (SNP) combinations in low and high risk groups [2]. In complex diseases and cancers, joint genetic effects (epistasis) across the whole genome need to be considered. In a recent study, Phillips identifies three types of epistasis: compositional epistasis, statistical epistasis and functional epistasis [3]. Compositional epistasis blocks the effect of one allele by
another at a different locus, statistical epistasis constitutes a statistical deviation from the additive effects of two loci on the phenotype, and functional epistasis addresses molecular interactions [3,4].
Many methods have been developed to detect epistasis on the basis of a statistical definition to explore gene-gene interactions or SNP-SNP interactions (epistasis) in complex diseases; these include logic regression [5,6], Multifactor-Dimensionality Reduction (MDR) [7], Poly-morphism Interaction Analysis (PIA) [8], Bayesian model selection [9], SNPruler [10], random jungle [11], genetic algorithms [12] and other methods [13-16]. The challenges posed by traditional parametric statistical methods (e.g., logistic regression models) have been detailed in Hahn [6]. The MDR method is inspired by the combinatorial partitioning method, in which a data-reduction method effectively reduces the genotype
* Correspondence:[email protected]
5
Department of Electronic Engineering, National Kaohsiung University of Applied Sciences, 415 Chien-Kung Road, Kaohsiung 80778, Taiwan Full list of author information is available at the end of the article
JOURNAL OF
CLINICAL BIOINFORMATICS
© 2013 Chuang et al.; licensee BioMed Central Ltd. This is an Open Access article distributed under the terms of the Creative Commons Attribution License (http://creativecommons.org/licenses/by/2.0), which permits unrestricted use, distribution, and reproduction in any medium, provided the original work is properly cited.
Chuanget al. Journal of Clinical Bioinformatics 2013, 3:4 http://www.jclinbioinformatics.com/content/3/1/4
predictors from n dimensions to one dimension. However, the computational load can be excessive when dealing with more than 10 polymorphisms [17]. PIA uses a case-based exclusion for missing SNP data, i.e., only those subjects for which all SNPs are identified (in a particular combination) are used in the analysis. SNPruler is a statis-tical method for identifying SNP combinations; it uses the Chi-square test to design the bound in the original Branch and Bound algorithm. Unlike our study, which focuses on the difference between cases and controls, SNPruler fo-cuses on the ratio between cases and controls. Although these methods are widely used, they can still be improved upon. As a test data set increases in size, the run time increases exponentially with the order of interaction. However, few studies address SNP-SNP interactions for multiple SNPs. Hence, when a data set is sufficiently large, selecting an appropriate method becomes important.
This study proposes a method based on statistical epistasis and an improved branch and bound algorithm combined with feature selection (IBBFS) to explore combinations of SNP-SNP interactions in a breast can-cer association study. The proposed method can reduce the search time and accurately determine the difference between cases and controls in low and high risk groups. Finally, we use the odds ratio (OR) as a quantitative measure to assess combinations of SNPs in the case– control studies. The odds ratio is a commonly-used
statistic that expresses the strength of association be-tween exposure and disease [18-20]. Experimental results show that the IBBFS method can determine risk factors in breast cancers.
Results
Identification of best SNP-SNP interaction combinations with maximal difference between cases and controls
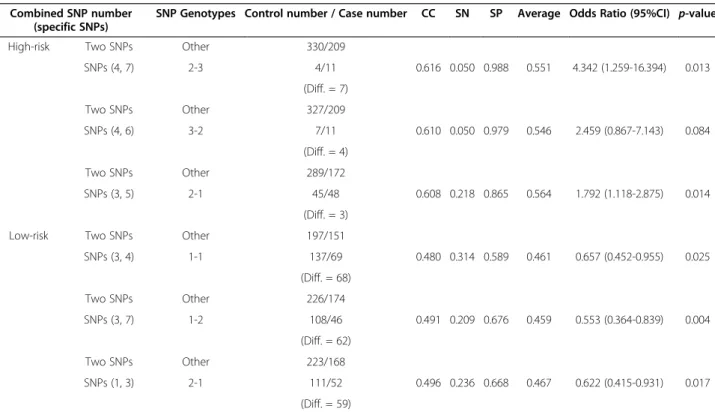
The IBBFS method was used to find the best combin-ation of SNPs in the high and low risk groups, with the best combinations of two-SNP interaction results shown in Table 1. We sorted the combinations of the two-SNP results and selected the top three maximum difference combinations in the low and high risk groups. In Table 1, the six specific SNP combinations with their corresponding genotypes (i.e., the SNPs (4, 7) with genotype (2–3) [CXCL12 (rs1801157)-AG]-[KITLG (rs10506957)-CC]) showed a maximal difference value of 7 between the 4 samples in the control data and the 11 samples in the high risk case data groups. The SNPs (3, 4) with genotype (1–1), [CXCR4 (rs2228014)-CC]-[CXCL12 (rs1801157)-GG], showed a maximal difference value of 68 between the 137 samples in the control data and the 69 samples in low risk case data groups. SNPs (4, 7) with genotype (2–3) and SNPs (3, 4) with genotype (1–1) are statistically significant because their p-value is smaller than 0.05. We then extended the best results of the
two-Table 1 Estimated best combinations of two SNPs on the occurrence of breast cancer
Combined SNP number (specific SNPs)
SNP Genotypes Control number / Case number CC SN SP Average Odds Ratio (95%CI) p-value
High-risk Two SNPs Other 330/209
SNPs (4, 7) 2-3 4/11 0.616 0.050 0.988 0.551 4.342 (1.259-16.394) 0.013 (Diff. = 7) Two SNPs Other 327/209 SNPs (4, 6) 3-2 7/11 0.610 0.050 0.979 0.546 2.459 (0.867-7.143) 0.084 (Diff. = 4) Two SNPs Other 289/172 SNPs (3, 5) 2-1 45/48 0.608 0.218 0.865 0.564 1.792 (1.118-2.875) 0.014 (Diff. = 3)
Low-risk Two SNPs Other 197/151
SNPs (3, 4) 1-1 137/69 0.480 0.314 0.589 0.461 0.657 (0.452-0.955) 0.025 (Diff. = 68) Two SNPs Other 226/174 SNPs (3, 7) 1-2 108/46 0.491 0.209 0.676 0.459 0.553 (0.364-0.839) 0.004 (Diff. = 62) Two SNPs Other 223/168 SNPs (1, 3) 2-1 111/52 0.496 0.236 0.668 0.467 0.622 (0.415-0.931) 0.017 (Diff. = 59) NOTE
-Other: The reference group, indicating the union of all other possible two to seven SNP combinations; N.E: Not estimable; CC: Correct; SN: Sensitivity; SP: Specificity.
Chuanget al. Journal of Clinical Bioinformatics 2013, 3:4 Page 2 of 10
SNP combinations to three SNPs. In this way all combinations are extended until the maximum number of SNPs was reached.
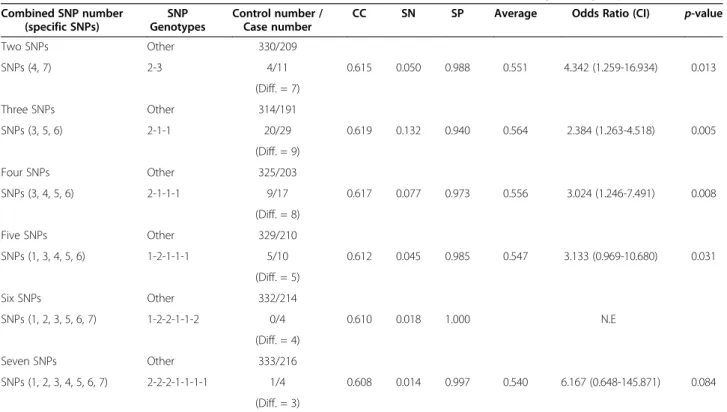
Finally, we used IBBFS to find the best-performing combinations of three or more SNPs, with results shown in Tables 2 and 3. Table 2 shows the maximum difference combinations (two to seven SNPs) for the high risk category. These respective combinations are SNPs (4, 7) with genotypes (2–3) and an OR of 4.342, SNPs (3, 5, 6) with genotypes (2-1-1) and an OR of 2.384, SNPs (3, 4, 5, 6) with genotypes (2-1-1-1) and an OR of 3.024, and SNPs (1, 3, 4, 5, 6) with genotypes (1-2-1-1-1) and an OR of 3.133. These two-to-five SNP combinations are statistically significant with a p-value smaller than 0.05. However, for combinations of six SNPs and combinations of seven SNPs, the p-value is greater than 0.05. In Table 3, the results for SNPs (3, 4) with genotypes (1–1), SNPs (1, 3, 5) with genotypes (2-1-1), SNPs (1, 2, 3, 4) with genotypes (2-2-1-1), and SNPs (1, 2, 3, 4, 5) with genotypes (2-2-1-1-1) all have a p-value smaller than 0.05. For all other combinations of SNPs the p-value was greater than 0.05. These experi-mental results prove that the proposed IBBFS method can handle combinations of multiple SNPs and deter-mine the best combination of two to seven SNPs, both the in low and high risk categories.
Analysis of combinations of SNP (4, 7) and combinations of SNP (3, 4) in breast cancer
First, we analyzed the high risk combination of SNP (4, 7) in breast cancer. Information related to the SNP (4, 7) com-bination and the OR results are shown in Table 4, while Figure 1 displays a bar graph illustrating the OR value. Two SNPs are shown in a 3 × 3 table that represents nine state combinations. IBBFS shows that SNP (4, 7) with genotype (2–3) with a maximal OR value of 4.342 (p-value < 0.05) has a maximal difference of 7 between the case and control groups. We observe that, for other combinations of SNP (4, 7) with genotype (1–2), the OR value is at a minimum and the p-values are statistically significant (p-value < 0.05). Hence, only two combinations of SNP (4, 7) in the 3 × 3 table are statistically significant (p-value < 0.05).
Secondly, we analyzed the low risk combinations of SNP (3, 4), with the related information and OR results shown in Table 5. The bar graphs in Figure 2 illustrate the OR value. When the combination of SNP (3, 4) with genotype (1–1) is chosen, the minimum OR value is 0.657 (p-value < 0.05). Here, the maximum difference also is SNP (3, 4) with genotype (1–1), with a difference of 68 between cases and controls. When considering combinations of more SNPs, the frequently occurring combinations of two SNPs in the following combinations are important.
Table 2 Estimated best combinations of SNPs on the occurrence of breast cancer in the high risk group
Combined SNP number (specific SNPs) SNP Genotypes Control number / Case number
CC SN SP Average Odds Ratio (CI) p-value
Two SNPs Other 330/209 SNPs (4, 7) 2-3 4/11 0.615 0.050 0.988 0.551 4.342 (1.259-16.934) 0.013 (Diff. = 7) Three SNPs Other 314/191 SNPs (3, 5, 6) 2-1-1 20/29 0.619 0.132 0.940 0.564 2.384 (1.263-4.518) 0.005 (Diff. = 9) Four SNPs Other 325/203 SNPs (3, 4, 5, 6) 2-1-1-1 9/17 0.617 0.077 0.973 0.556 3.024 (1.246-7.491) 0.008 (Diff. = 8) Five SNPs Other 329/210 SNPs (1, 3, 4, 5, 6) 1-2-1-1-1 5/10 0.612 0.045 0.985 0.547 3.133 (0.969-10.680) 0.031 (Diff. = 5) Six SNPs Other 332/214 SNPs (1, 2, 3, 5, 6, 7) 1-2-2-1-1-2 0/4 0.610 0.018 1.000 N.E (Diff. = 4) Seven SNPs Other 333/216 SNPs (1, 2, 3, 4, 5, 6, 7) 2-2-2-1-1-1-1 1/4 0.608 0.014 0.997 0.540 6.167 (0.648-145.871) 0.084 (Diff. = 3) NOTE
-Other: The reference group, indicating the union of all other possible two to seven SNP combinations; N.E: Not estimable; CC: Correct; SN: Sensitivity; SP: Specificity.
Chuanget al. Journal of Clinical Bioinformatics 2013, 3:4 Page 3 of 10
4. Wan X, Yang C, Yang Q, Xue H, Fan X, Tang NLS, Yu W: BOOST: A fast approach to detecting gene-gene interactions in genome-wide case–control studies. Am J Hum Genet 2010, 87:325–340.
5. Chen CCM, Schwender H, Keith J, Nunkesser R, Mengersen K, Macrossan P: Methods for identifying SNP interactions: a review on variations of logic regression, random forest and bayesian logistic regression. IEEE/ACM Trans Comput Biol Bioinform 2011, 8(6):1580–1591.
6. Schwender H, Ickstadt K: Identification of SNP interactions using logic regression. Biostatistics 2008, 9(1):187–198.
7. Hahn LW, Ritchie MD, Moore JH: Multifactor dimensionality reduction software for detecting gene–gene and gene–environment interactions. Bioinformatics 2003, 19(3):376.
8. Mechanic LE, Luke BT, Goodman JE, Chanock SJ, Harris CC: Polymorphism interaction analysis (PIA): a method for investigating complex gene-gene interactions. BMC Bioinforma 2008, 9(1):146.
9. Fridley BL: Bayesian variable and model selection methods for genetic association studies. Genet Epidemiol 2009, 33(1):27–37.
10. Wan X, Yang C, Yang Q, Xue H, Tang NLS, Yu WC: Predictive rule inference for epistatic interaction detection in genome-wide association studies. Bioinformatics 2010, 26(1):30–37.
11. Schwarz DF, Konig IR, Ziegler A: On safari to random jungle: a fast implementation of random forests for high-dimensional data. Bioinformatics 2010, 26(14):1752.
12. Chang HW, Chuang LY, Ho CH, Chang PL, Yang CH: Odds ratio-based genetic algorithms for generating SNP barcodes of genotypes to predict disease susceptibility. OMICS 2008, 12(1):71–81.
13. Assawamakin A, Chaiyaratana N, Limwongse C, Sinsomros S,
Yenchitsomanus PT, Youngkong P: Variable-length haplotype construction for gene gene interaction studies. IEEE Eng Med Biol Mag 2009,
28(4):25–31.
14. Li X, Chen H, Li J, Zhang Z: Gene function prediction with gene interaction networks: a context graph kernel approach. IEEE Trans Inf Technol Biomed 2010, 14(1):119–128.
15. Chuang LY, Chang HW, Lin MC, Yang CH: Chaotic particle swarm optimization for detecting SNP-SNP interactions for CXCL12-related genes in breast cancer prevention. Eur J Cancer Prev 2012, 21(4):336–342. 16. Chuang LY, Lin YD, Chang HW, Yang CH: An improved PSO algorithm for generating protective SNP barcodes in breast cancer. PLoS One 2012, 7(5):e37018.
17. Musani SK, Shriner D, Liu NJ, Feng R, Coffey CS, Yi NJ, Tiwari HK, Allison DB: Detection of gene x gene interactions in genome-wide association studies of human population data. Hum Hered 2007, 63(2):67–84. 18. Bland JM, Altman DG: Statistics notes: the odds ratio. Br Med J 2000,
320(7247):1468.
19. Chung Y, Lee SY, Elston RC, Park T: Odds ratio based multifactor-dimensionality reduction method for detecting gene–gene interactions. Bioinformatics 2006, 23(1):71.
20. Chen JB, Yang YH, Lee WC, Liou CW, Lin TK, Chung YH, Chuang LY, Yang CH, Chang HW: Sequence-based polymorphisms in the mitochondrial D-loop and potential SNP predictors for chronic dialysis. PLoS One 2012, 7(7):e41125.
21. Andersen V, Ostergaard M, Christensen J, Overvad K, Tjonneland A, Vogel U: Polymorphisms in the xenobiotic transporter multidrug resistance 1 (MDR 1) and interaction with meat intake in relation to risk of colorectal cancer in a danish prospective case-cohort study. BMC Cancer 2009, 9(1):407.
22. Wan Y, Wu W, Yin Z, Guan P, Zhou B: MDM2 SNP309, gene-gene interaction, and tumor susceptibility: an updated meta-analysis. BMC Cancer 2011, 11(1):208.
23. Goodman JE, Mechanic LE, Luke BT, Ambs S, Chanock S, Harris CC: Exploring SNP SNP interactions and colon cancer risk using polymorphism interaction analysis. Int J Cancer 2006, 118(7):1790–1797. 24. Franchimont D, Vermeire S, El Housni H, Pierik M, Van Steen K, Gustot T,
Quertinmont E, Abramowicz M, Van Gossum A, Deviere J: Deficient host-bacteria interactions in inflammatory bowel disease? The toll-like receptor (TLR)-4 Asp299gly polymorphism is associated with Crohn’s disease and ulcerative colitis. Gut 2004, 53(7):987.
25. Yang JJ, Ko KP, Cho LY, Shin A, Gwack J, Chang SH, Shin HR, Yoo KY, Kang D, Park SK: The role of TNF genetic variants and the interaction with cigarette smoking for gastric cancer risk: a nested case–control study. BMC Cancer 2009, 9:238.
26. McKinney BA, Reif DM, Ritchie MD, Moore JH: Machine learning for detecting gene-gene interactions: a review. Appl Bioinformatics 2006, 5(2):77–88.
27. Yang CH, Chang HW, Cheng YH, Chuang LY: Novel generating protective single nucleotide polymorphism barcode for breast cancer using particle swarm optimization. Cancer Epidemiol 2009, 33(2):147–154.
28. Somol P, Pudil P, Kittler J: Fast branch & bound algorithms for optimal feature selection. IEEE Trans Pattern Anal Mach Intell 2004, 26(7):900–912. 29. Narendra PM, Fukunaga K: A branch and bound algorithm for feature
subset selection. IEEE Trans Comput 1977, 100(9):917–922.
30. Chen X: An improved branch and bound algorithm for feature selection. Pattern Recognit Lett 2003, 24(12):1925–1933.
31. Cao Y, Jiang T, Girke T: A maximum common substructure-based algorithm for searching and predicting drug-like compounds. Bioinformatics 2008, 24(13):i366.
32. Dittrich MT, Klau GW, Rosenwald A, Dandekar T, Muller T: Identifying functional modules in protein–protein interaction networks: an integrated exact approach. Bioinformatics 2008, 24(13):i223.
33. Cui Y, Yang Y, Cheng X, Song P: A recursive branch-and-bound algorithm for the rectangular guillotine strip packing problem. Comput Oper Res 2008, 35(4):1281–1291.
34. Cardoen B, Demeulemeester E, Belin J: Sequencing surgical cases in a day-care environment: an exact branch-and-price approach. Comput Oper Res 2009, 36(9):2660–2669.
35. Hinze LL, Lamkey KR: Absence of epistasis for grain yield in elite maize hybrids. Crop Sci 2003, 43(1):46–56.
36. Friese CR, Neville BA, Edge SB, Hassett MJ, Earle CC: Breast biopsy patterns and outcomes in surveillance, epidemiology, and end results—medicare data. Cancer 2009, 115(4):716–724.
37. Mehta CR, Patel NR, Gray R: Computing an exact confidence interval for the common odds ratio in several 2 x 2 contingency tables. J Am Stat Assoc 1985, 80(392):969–973.
doi:10.1186/2043-9113-3-4
Cite this article as: Chuang et al.: Improved branch and bound algorithm for detecting SNP-SNP interactions in breast cancer. Journal of Clinical Bioinformatics 2013 3:4.
Submit your next manuscript to BioMed Central and take full advantage of:
• Convenient online submission
• Thorough peer review
• No space constraints or color figure charges
• Immediate publication on acceptance
• Inclusion in PubMed, CAS, Scopus and Google Scholar
• Research which is freely available for redistribution
Submit your manuscript at www.biomedcentral.com/submit
Chuanget al. Journal of Clinical Bioinformatics 2013, 3:4 Page 10 of 10