國立交通大學
生物資訊研究所
碩
士
論
文
辨識人類微小核甘酸標的基因之系統化方法
Systematic method for identifying microRNA target genes
in human genome
研究生:朱家慧
指導教授:黃憲達 博士
辨識人類微小核甘酸標的基因之系統化方法
Systematic method for identifying microRNA target genes
in human genome
研 究 生:朱家慧 Student:Chia-Huei Chu 指導教授:黃憲達 博士 Advisor:Dr. Hsian-Da Huang
國 立 交 通 大 學 生 物 資 訊 研 究 所
碩 士 論 文
A Thesis
Submitted to Institute of Bioinformatics College of Biological Science and Technology
National Chiao Tung University in partial Fulfillment of the Requirements
for the Degree of Master
in Bioinformatics
July 2008
Hsinchu, Taiwan, Republic of China
辨識人類微小核甘酸標的基因之系統化方法
學生:朱家慧
指導教授:黃憲達 博士
國立交通大學生物資訊研究所碩士班 摘 要 microRNA 是一小段可在生物體內自行合成的 RNA 序列,其主要 的功能是藉由與其 target 結合來控制基因的表現。近年來,越來越多的 microRNA 透過生物實驗被發現。目前已經有許多針對找尋 microRNA target 的預測軟體開發出來,像是 miRanda、RNAhybrid、TargetScan 和 PicTar 等都是常見的 microRNA target 預測軟體,這些軟體所用的預 測方式都不一樣,很難評斷哪一個軟體的預測結果準確性較高。因此, 為了提高 microRNA target 預測的準確性,在本研究中,我們提供了一 個系統化的 microRNA target 分析流程。其中我們結合了三個比較廣泛 被使用的 microRNA target 預測軟體,miRanda、RNAhybrid、TargetScan 來預測 microRNA target,並從一群已經過實驗證實的 microRNA target 資料中觀察一些共同的特徵當作過濾的條件,另外還收集了一些 microRNA 及其 target 的 microarray 資訊輔助我們的預測結果。藉由本 研究所提供的流程可讓生物學家更方便、快速的找到正確的 microRNA target。Systematic method for identifying microRNA target genes
in human genome
student:Chia-Huei Chu Advisors:Dr. Hsian-Da Huang
Institute of Bioinformatics National Chiao Tung University
ABSTRACT
microRNA (miRNA) is a class of small non-coding RNA and the main function of miRNA is to regulate mRNA stability and translation by binding to specific target site of mRNA. Recently, more and more miRNA targets have been discovered by experiments. However, the experimental identification of miRNA target site is lab-intensive. Although there are several computational programs have been developed, such as miRanda, RNAhybrid, TargetScan and PicTar, for identifying miRNA targets. The main method of these programs are different, it’s hard to define which tool has better performance. Therefore, in this work, to improve the accuracy of miRNA target prediction, we proposed a systematic method for identifying miRNA targets in human genome. We applied three commonly used programs to make predictions. Besides, we also define several useful criteria by observing the experimentally verified miRNA targets which are retrieved from TarBase to filter prediction results. Moreover, we also collected both miRNAs and its targets gene expression profiles to support our prediction results. Using this systematic method we proposed can help
Content
Chapter 1 Introduction ... 1 1.1 Background ... 1 1.1.1 Non-coding RNA ... 1 1.1.2 microRNA ... 2 1.1.3 microRNA Biogenesis ... 3 1.1.4 miRNA Functions ... 4 1.2 Motivation ... 61.3 The Specific Aim ... 6
Chapter 2 Related Works ... 7
2.1 miRNA Target Databases ... 7
2.1.1 miRBase::Targets ... 8
2.1.2 TarBase ... 10
2.1.3 miRNAMap ... 11
2.1.4 miRGator ... 13
2.2 miRNA Target Prediction Web Server ... 14
2.2.1 miRTar ... 14
2.2.2 microRNA.org ... 15
2.2.3 miTarget ... 16
2.3 miRNA Target Prediction Software ... 18
2.3.1 miRanda ... 19
2.3.2 RNAhybrid ... 20
2.3.3 TargetScan ... 21
2.3.4 MirTarget ... 22
Chapter 3 Materials and Method ... 24
3.1 Materials ... 24
3.1.1 miRNA sequences ... 25
3.1.2 Target genes ... 25
3.1.3 Sfold ... 26
3.1.4 Expression profiles of miRNA and target genes ... 27
3.2 System flow ... 29
3.3 Filtering process of miRNA target prediction ... 32
3.3.1 Criterion 1: Target site was predicted by at least two tools... 32
3.3.2 Criterion 2: Target gene contains multiple target sites. ... 33
3.3.3 Criterion 3: Target site locates in 5’ end or 3’ end of target 3’-UTR. .... 33
3.3.4 Criterion 4: Target site locates in accessible regions. ... 34
Chapter 4 Results ... 37
4.1 Case study: miR-124 ... 37
4.2 has-miR-124 regulated the RYK and ARAF ... 42
4.3 Comparison with MirTarget ... 43
Chapter 5 Discussions ... 46
5.1 Identification of downregulated genes based on microarray data ... 46
5.2 Parameter optimization of iScan ... 46
5.3 The definition of a target site is accessible or not will affect the performance of our method ... 47
5.4 Adding other useful criteria and applying scoring function for filtering process ... 47
5.5 Prospective works ... 48
List of Figures
Figure 1.1 Central dogma of molecular biology. ... 1
Figure 1.2 Biogenesis of microRNA (He, L. and G.J. Hannon, 2004). ... 4
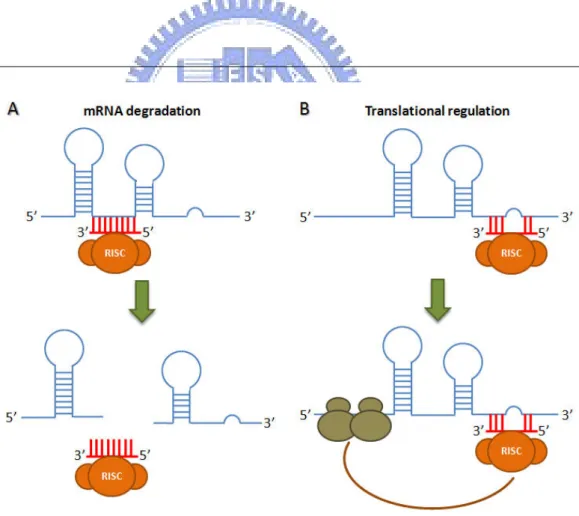
Figure 1.3 miRNA regulation functions. ... 5
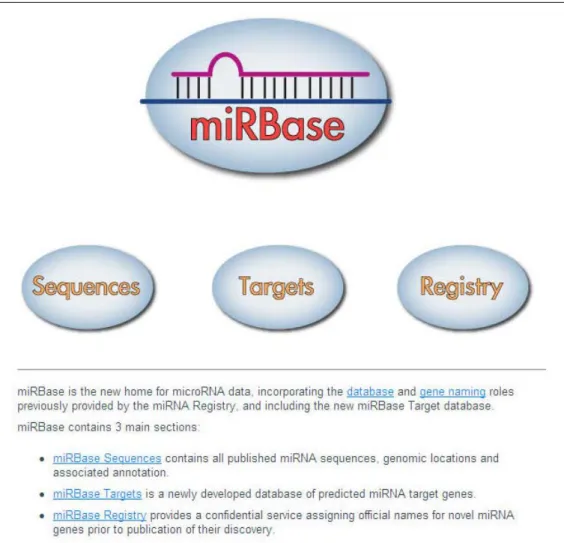
Figure 2.1 Web page of miRBase. ... 8
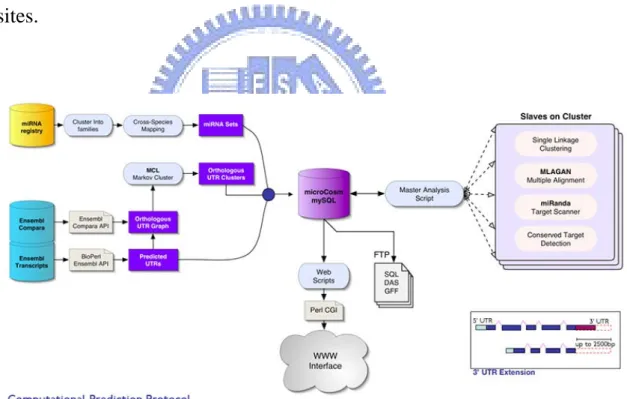
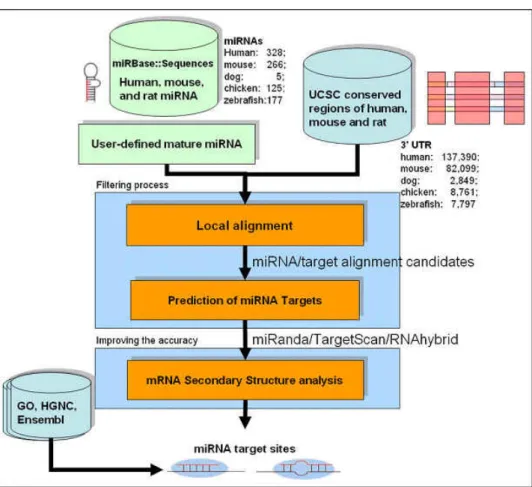
Figure 2.2 Computational prediction protocol of miRBase::Targets. ... 9
Figure 2.3 Web page of TarBase. ... 10
Figure 2.4 Experimentally supported data of each species in TarBase. ... 11
Figure 2.5 Web page of miRNAMap. ... 12
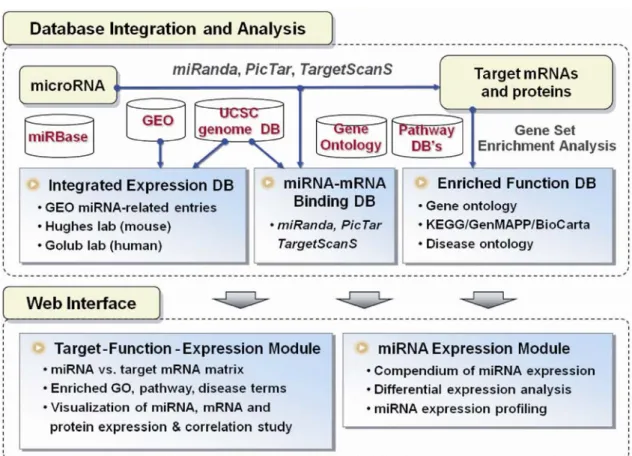
Figure 2.6 Overview schema of miRGator. ... 13
Figure 2.7 System flow of miRTar. ... 14
Figure 2.8 Web page of microRNA.org. ... 15
Figure 2.9 Web page of miTarget. ... 16
Figure 2.10 General scheme of miRNA:mRNA interactions. ... 17
Figure 2.11 System flow of miRanda. ... 19
Figure 2.12 Web page of RNAhybrid. ... 20
Figure 2.13 Web page of TargetScan. ... 21
Figure 2.14 The simple flowchart for MirTarget. (Wang, X, 2006) ... 23
Figure 3.1 The growth of miRBase from 2002 to 2008. ... 25
Figure 3.2 Web page of Sfold. ... 26
Figure 3.3 Cluster analysis of GDS596. ... 28
Figure 3.4 System flow. ... 30
Figure 3.5 Criteria of identifying miRNA targets. ... 33
Figure 3.6 Criterion 3 of identifying miRNA targets. ... 34
Figure 3.7 Energetic cost to free base-pairing interactions (Long, D., et al. 2007). ... 35
Figure 3.8 Criterion 4 of identifying miRNA targets. ... 35
Figure 4.1 Bead-array miRNA expression profile of miR-124. ... 37
Figure 4.2 The amount of downregulated genes at each time point. ... 38
Figure 4.3 The number of target sites satisfy the four criteria. ... 39
Figure 4.4 Gene expression profiles of RYK and miR-124. ... 42
Figure 4.5 Gene expression profiles of ARAF and miR-124. ... 43
List of Tables
Table 2.1 Database of miRNA ... 7
Table 2.2 Comparison of miRNAMap 1.0 and 2.0. ... 12
Table 2.3 The top 15 contributing features. ... 17
Table 2.4 Methods and resources of miRNA target prediction programs. . 18
Table 3.1 Resources of biological data. ... 24
Table 3.2 Resources of computational tools. ... 24
Table 3.3 Details of expression profiles. ... 27
Table 3.4 The 13 overlapping human tissues. ... 29
Table 3.5 Score of each type of pairs. ... 31
Table 3.6 Four criteria of filtering process. ... 32
Table 4.1 39 experimentally targets of has-miR-124 predicted by MRT. ... 40
Chapter 1 Introduction
1.1 Background
1.1.1 Non-coding RNA
As shown in Figure 1.1, the central dogma of molecular biology normally flows from DNA to RNA to protein. Recently, a large number of non-coding RNAs (ncRNAs), for example, microRNAs (miRNAs) [1-4], small interfering RNAs (siRNAs) and Piwi-interacting RNAs (piRNAs) [5-7] have been discovered [8].
These non-coding RNAs (ncRNA) are any RNA molecule encoded by genes that are transcribed from DNA but not translated into protein and it can separate into several classes. The descriptions and functions of each class of these non-coding RNAs was listed Table 1.1.
Table 1.1 Methods and resources for miRNA target prediction.
Class Description Function
miRNA microRNA Post-transcriptional regulation of transcripts from a wide range of genes
Primary
siRNA Small interfering RNA
Binding to complementary target RNA; guide for initiation of RdRP-dependent secondary siRNA synthesis
Secondary
siRNA Small interfering RNA
Post-transcriptional regulation of transcripts; formation and maintenance of
heterochromatin
tasiRNA Trans-acting siRNA Post-transcriptional regulation of transcripts natsiRNA
Natural antisense transcript-derived siRNA
Post-transcriptional regulation of genes involved in pathogen defense and stress responses in plants
piRNA Piwi-interacting RNA
Suppression of transposons and
retroelements in the germ lines of flies and mammals
1.1.2 microRNA
Discovered in nematodes in 1993, microRNAs (miRNAs) are a class of small non-coding RNA of about 21~23nt in length which can control gene expression (regulating mRNA stability and translation) by binding to the 3’-UTR of mRNA.
The first miRNA, lin-4, was found in Caenorhabditis elegans in 1993[9]. Lin-4 represses the expression of lin-14, which encodes a nuclear protein. The partial complementarity between lin-4 and the sites in the 3’-untranslated region (3’-UTR) of lin-14 mRNA caused the negative regulation of lin-14 by lin-4 [10]. A few years later, the second miRNA,
let-7, was discovered, in worm again [11]. Let-7 represses the expression of
the lin-41 and hbl-1 mRNAs by binding to their 3’-UTRs. Let-7 is conserved throughout metazoans and the discovery of let-7 brought out the subsequent large-scale searches for additional miRNAs, established miRNAs as a new and large class of gene regulators. At presents, more and more miRNAs were identified in several species but the main function of miRNAs is still unclear.
1.1.3 microRNA Biogenesis
The biogenesis of miRNAs is shown in Fig. 1.2 [4]. MiRNA genes first transcribe to pri-miRNAs by RNA polymerase II. The pri-miRNAs are processed to precursor miRNAs (pre-miRNAs) by the RNase endonuclease Drosha inside the nucleus. These pre-miRNAs are ~70 nucleotides with a hairpin structure. Pre-miRNAs are transported to cytoplasm by Exportin 5. The pre-miRNAs are then processed into miRNA:miRNA* duplexes by the Dicer. Only one strand of this duplex becomes a mature miRNA which is assembled into the RNA-induced silencing complex (RISC) and act on its target by translational repression or mRNA cleavage.
Figure 1.2 Biogenesis of microRNA (He, L. and G.J. Hannon, 2004).
1.1.4 miRNA Functions
miRNAs function in a broad range of biogenesis processes in plants and animals. It perform many cellular processes such as developmental timing, cell death, hematopoiesis and patterning of the nervous system in animals [12]. Lin-4 and let-7 of C. elegans play essential roles in controlling timing events during larval development. MiRNA miR-196 regulates the homebox transcription factors of HoxB8 which indicated its role in development [13]. Moreover, miR-1 plays a crucial role in the development of heart and skeletal muscle. All these examples above imply the importance of miRNA in cellular processes.
miRNAs regulate their target genes via two main mechanisms, target mRNA cleavage and transcriptional repression without RNA cleavage shown as Fig. 1.3. In plants, most of miRNAs have perfect or near perfect complementarity to their targets [14] and cleaving the mRNA y binding to their targets. Contrast to miRNAs in plant, miRNAs is imperfectly complementary to their targets which usually located in 3’-UTR of target genes. The complementarity between animal miRNAs and their targets are usually restricted to the 5’ region of miRNAs (nucleotides 2-8 or 2-7) [15, 16]. The mRNA degradations were considered always happen in plants and translational regulations were always found in animals. However, mRNA degradations were also occurred in animals.
1.2 Motivation
miRNAs play an important role in many cellular processes. Nevertheless, the specific function of most of miRNAs is still unknown. Presently, the research of miRNAs and its target becomes more and more popular. Several computational prediction programs, for example, miRanda[17], RNAhybrid[18, 19] and TargetScan[15], have been developed for identifying miRNA targets. However, for each of these programs, the main method which is used to predict miRNA target is very different. It is hard to decide which one has the better accuracy. Owing to increase the accuracy of prediction results, in this work, we provide a systematic method to identifying miRNA targets.
1.3 The Specific Aim
In this work, we proposed a systematic method of identifying miRNA targets in human genome and provide some additional information of miRNAs and its targets. Users can input the overexpression profiles of a specific miRNA. Using the expression data, some existing computational prediction programs and useful filter features observed from the experimentally supported targets to identify the potential miRNA target genes. The main contribution of this work is improving the accuracy by setting some criteria which are the features of miRNA targets we observing from the experimentally data retrieved from TarBase[20]. Moreover, we also collected some gene expression data of miRNAs and its targets to support our prediction results.
Chapter 2 Related Works
Research of identifying miRNA targets is the most useful way to understand the functions of miRNA. Several prediction tools based on different methods were developed for finding the potential miRNA targets. To simplify the using of these prediction tools, various web servers were be established. Furthermore, numerous databases were built for systematizing the information of both miRNA and its targets. In this chapter, we introduce some existing miRNA target prediction tools, web servers and databases.
2.1 miRNA Target Databases
Table 2.1 Database of miRNA
DB Name Data Source Species Prediction
Method Features miRBase::Targets miRBase::Sequences 4 insects 16 vertebrates 2 habitude miRanda -
TarBase Literatures 8 organisms - Experimentally validate targets miRNAMap
miRBase TarBase
UCSC genome browser
2 insects 9 vertebrates 1 worm miRanda TargetScan RNAhybrid
3 criteria and Gene expression data miRanda - human drosophila zebrafish miRanda
TargetScan - 5 species TargetScan Seed complementary miRGator miRBase
UCSC genome browser
human mouse
miRanda TargetScans PicTar
Gene expression data
microRNA.org miRBase
UCSC genome browser
Human Mouse rat
At present, lots of databases were developed for housing information of miRNA and its targets such as miRBase::Targets contains the potential miRNA targets in almost all genomes and TarBase integrated the experimentally tested miRNA target sites. In Tab. 2.1, we list some miRNA targets database and describe the data source, species, prediction methods and special features of each database.
2.1.1 miRBase::Targets
A comprehensive database, miRBase[21], houses the miRNA data and it divides into three parts. One is miRBase::Registry which provides a confidential service assigning official names for novel miRNA genes prior to publication of their discovery, another is miRBase::Sequences, containing all the published miRNA sequence, genome location and association annotations and the other is miRBase::Targets[22] that stores computationally predicted miRNA target genes across several species. miRBase::Targets version 5 released in 2007, the miRNA sequences are obtained from miRBase::Registry and target gene sequences from Ensembl. The potential miRNA targets are identified by miRanda algorithm which uses dynamic programming alignment to identify highly complementary sites.
2.1.2 TarBase
Figure 2.3 Web page of TarBase.
TarBase[20] is the database which provides experimentally supported miRNA targets. They collect the experimentally verified miRNA target in at least 8 organisms include human, mouse, virus, fruit fly, worm, zebrafish, rat and plant. For each tested target sites, TarBase described the miRNA that binds it, the gene in which it occurs, the experiments that were conducted to test it and the paper from which all data were extracted. The current release, version 4.0, contains 128 miRNA, 570 target genes and 763 target sites.
Figure 2.4 Experimentally supported data of each species in TarBase.
2.1.3 miRNAMap
A previous research of our group, miRNAMap[23], is the database collects experimentally verified miRNAs and target genes in several metazoan genomes includes human, mouse, rat and etc. miRNAMap employed three computational tools, miRanda, RNAhybrid and TargetScan, to identify miRNA targets in 3’UTR of genes. In the latest version of miRNAMap (version 2.0)[24], we integrated more species and prediction tools. Besides, we also consider the target accessibility of each target site. The advancements and new features miRNAMap 2.0 is listed in Table 2.1.
Figure 2.5 Web page of miRNAMap.
Table 2.2 Comparison of miRNAMap 1.0 and 2.0.
Features miRNAMap 1.0 miRNAMap 2.0
Known miRNAs miRBase (version 6.0) miRBase (version 9.2)
Supported species human, mouse, rat and dog 2 insects, 9 vertebrates and 1 worm Experimental
miRNA targets Surveying literature TarBase and Surveying literature miRNA expression
profiling
Lu. et al miRNA profiling in human
Lu. et al miRNA profiling in human Q-PCR miRNA profiling in human Expression profiles
of miRNA targets -
NCBI-GEO-GDS596 (76 human tissues)
miRNA target
prediction tools miRanda
miRanda, RNAhybrid and TargetScan Criteria for filtering the predicted miRNA targets -
predicted by at least two tools target genes contained multiple sites target site is accessible
Accessible region of miRNA target sites - Sfold Tissue specificity of human miRNAs -
Q-PCR miRNA profiling (18 human tissues)
2.1.4 miRGator
miRGator[25] is a system integrates target prediction, functional analysis, gene expression and genome annotation of miRNAs supports the human and mouse genomes. They use miRanda, PicTar and TargetScanS to find out miRNA target genes and integrated functional annotation of both miRNAs and its targets including expression, function, pathway, disease terms. The schema of miRGator is shown in Fig. 2.2.
2.2 miRNA Target Prediction Web Server
To provide a convenient environment for researchers who are interested in the regulations of miRNA, many useful miRNA target prediction web servers were developed.
2.2.1 miRTar
Figure 2.7 System flow of miRTar.
named miRTar. It allows user input a user-defined miRNA sequence or the accession number of known miRNA for identifying miRNA targets against the conserved mRNA sequences of mammalian genes. Besides, miRTar also provided some additional information such as the secondary structure between miRNA and its targets. MiRTar can be accessed at http://miRTar.mbc.nctu.edu.tw/.
2.2.2 microRNA.org
microRNA.org[26] is a resource of miRNA target predictions and miRNA expression profiles. The target prediction is based on the development of miRanda algorithm that computed optimal sequence complementarity between mature miRNA and its target using a weighted dynamic programming algorithm. In addition to miRNA target prediction, they also integrated some miRNA expression profiles including 172 human, 64 mouse and 16 rat small RNA libraries extracted from major organs and cell types. microRNA.org is available at http://www.microrna.org.
2.2.3 miTarget
Figure 2.9 Web page of miTarget.
iRNA/target duplex. In contrast with those programs, miTarget[27] using a support vector machine (SVM) Among the existing miRNA target prediction programs, most of them identified the targets by considering the complementary between miRNA and its target and the thermodynamics of m
classifier for miRNA target prediction.
The SVM features which were designed based on the RNA secondary structure prediction results produced by RNAfold program in the Vienna RNA Package [28, 29] and were categorized into three elements: structure
features, thermodynamic features and position-based features. The general scheme of miRNA:mRNA interactions were shown in Fig. 2.10. Finally, 41 features were chose to training the SVM model. Table 2.3 list the top 15 contributing features.
Figure 2.10 General scheme of miRNA:mRNA interactions.
ble e top 15 atures.
nk Score
Ta 2.3 Th contributing fe
Ra Rank Feature
1 81.9 Position five 2 79.6 5' part free energy 3 79.1 Position six
4 78.9 Position four
5 78.9 AU matches at the 5' part 6 77.6 Mismatches at the 5' part 7 76.6 Matches at the 5' part 8 73.9 Total GU matches 9 73.4 Position seven 10 72.9 Position two
11 71.4 GU match at the 5' part 12 70.8 GU match at the 3' part 13 70.3 Total AU matches 14 68.8 Position three 15 68.6 Total free energy
2.3
r methods were based on ther
h of the three prediction tools, miRanda, RNAhybrid and TargetScan, we integrated in this work will be described in detail following.
Methods f miRNA target prediction program
ility availability
miRNA Target Prediction Software
At present, different computational methods have been developed for identifying miRNA targets (Table 2.1). Because of the challenge of predicting miRNA targets, there are several methods which can divide into different categories. The most widely used method is focus on the complementarity between miRNA and its targets and some methods require strict complementarity to the seed region of miRNA [15, 16]. Except the complementarity between two sequences, othe
modynamics and binding structure [18, 30, 31]. Besides, SVM is also the method used to predict miRNA targets [27].
For eac
Table 2.4 and resources o s.
Tool Type of method Method
availab
Data
Refs
miRanda Complementarity Download Yes [17]
miRanda miRBase Complementarity Online
search Yes [22] TargetScan Seed complementarity
earch Online
s Yes [15]
TargetScanS Seed complementarity Online es
search Y [16]
DIANA microT Thermodynamics Download Yes [31]
PicTar Thermodynamics Yes [30]
RNAhybrid
istical model load Thermodynamics
and stat Down [18]
miT rget SVMe Online
Search [27]
a
Tar Experimentally validated
ts N/A Yes [20]
Base
2.3.1 miRanda
MiRanda[17] is the second published method of predicting miRNA targets. It identifies the potential miRNA target binding sites by looking for the high-complementarity regions on the target sequences using a weighted dynamic programming algorithm (Fig 2.3). The scoring matrix used by this algorithm is built based on that the bases at the 5’ end of the miRNA are rewarded more than those at the 3’ end. The binding sites exhibiting perfect or almost perfect match at the seed region of miRNAs display a better score. The resulting binding sites are then evaluated thermodynamically, using the Vienna RNA folding package [28, 29].
2.3.2 RNAhybrid
RNAhybrid[18] recognizes regions in the 3’-UTRs that have the potential to form a thermodynamically favorable duplex with a specific miRNA. The core algorithm of RNAhybrid is an extension of RNA secondary structure prediction. Instead of a single sequence folding back to itself like MFold, RNAhybrid determined the most favorable hybridization site between miRNA and its potential target using an artificial linker. Intra-molecular hybridizations base pairing between target nucleotides or between miRNA nucleotides are not allowed. The time complexity of this algorithm is linear in the target length, it allows many long sequences to be search in a short time. RNAhybrid is available at http://bibiserv.techfak.uni-bielefeld.de/rnahybrid/.
2.3.3 TargetScan
TargetScan[15] is the first method applied for human miRNA target prediction using mouse, rat and fish genomes for conservation analysis. Different from those methods looking for the complementary sites, TargetScan requires the perfect complementarity to the seed region which is the position 2-8 of a miRNA numbered from 5’ end. This approach can successfully reduce the false positive at the beginning of prediction process. Moreover, TargetScan also consider the thermodynamic stability of each potential binding site using RNAFold from the Vienna Package[32].
2.3.4 MirTarget
MirTarget [33] is an algorithm for detecting miRNA targets. The algorithm combines relevant parameters for miRNA target recognition and heuristically assigns different weights to these parameters according to their relative importance. First step of this algorithm, miRNA seed sequence (positions 2–8) was scanned against all human 3’-UTR sequences to identify perfect complementary using a computer hashing technique. Then the level of cross-species conservation of seed pairing was examined. MirTarget evaluated orthologous sequences from five organisms and a gene candidate was rejected if the perfect seed pairing was not found in the orthologs from at least three organisms. The miRNA/target site duplex stability was evaluated by binding free energy (DG). DG values were computed using RNAFold [29]. A candidate target site was rejected if the DG value was higher than -13 kcal/mol. If a candidate site passed these screening filters, local sequence alignment was performed to extend the alignment between miRNA and 22 bases downstream of the seed-binding site in 30-UTR. Bases surrounding the seed sequences are important for target recognition [16]. Thus limited seed extension was evaluated for pairing to miRNA positions 1, 9 and 10. The longest stretch of perfect matches (including positions 2–8) was considered as an extended seed for raw score calculation. Different weights were assigned with the following order to differentiate their relative importance: seed conservation > limited seed extension > duplex binding stability > terminal base match. A score is recorded if it is no less than the threshold value 30.
Chapter 3 Materials and Method
3.1 Materials
In the systematic method for identifying miRNA target we propose in this work, we integrated some biological data source and computational programs. Table 3.1 and Table 3.2 show the biological data sources and prediction programs integrated in this work respectively.
Table 3.1 Resources of biological data. Category Data
Source Version Link Ref.
Genome
Sequence Ensembl 49 http://www.ensembl.org/index.html [34] Known miRNA Sequence miRBase 11.0 http://microrna.sanger.ac.uk/sequences/ [21] Gene expression Profile NCBI GEO - http://www.ncbi.nlm.nih.gov/projects/geo/ [35]
Table 3.2 Resources of computational tools.
Category Tool Name Version Ref.
miRNA Target Prediction
miRanda v 1.9 [17]
RNAhybrid v 2.1 [18] TargetScan v 1.0b [15] Target Accessibility Calculation Sfold [36]
3.1.1 miRNA sequences
miRBase::Sequences provides miRNA sequences data, annotation, references and links to the other resources for all published miRNAs. The latest version (release 11.0) of the database contains 6396 entries representing hairpin precursor miRNAs, expressing 6211 miRNA products from 72 species: a rapidly growth of over 2000 sequences in the past two years.
Figure 3.1 The growth of miRBase from 2002 to 2008.
In this work, we extracted 678 human miRNA from miRBase::Sequences (release 11.0).
3.1.2 Target genes
conserved across species. In target prediction, considering target sites conserved across multiple species is more likely to reduce the false positives and also increasing the prediction efficiency [15, 17, 37]. Thus, in this work we retrieved the 15,314 3’UTR from 7,907 human genes from UCSC Genome Browser [38].
3.1.3 Sfold
Figure 3.2 Web page of Sfold.
Sfold is a RNA secondary structure prediction tool using statistical algorithm. In addition, Sfold also can be employed to predict the accessible target regions for RNA-targeting nucleic acids.
forward step, it computes the equilibrium partition functions for all substrings of an RNA sequence. In the backward step, it takes a recursive sampling algorithm to draw secondary structures.
For prediction of accessible sites for targeting by antisense oligonucleotides, Sfold using a probability profiling approach based on the sampling algorithm[39]. On a profile for width W, the probability that W consecutive bases are all unpaired is plotted against the first base o f the segment. The target site was considered as accessible if there is at least one peak > 0.5, the target site was considered moderate for a peak with probability between 0.3 and 0.6, and the potential was low for a site with probability < 0.3 of being single-stranded. Sfold 2.0 application server is now available at http://sfold.wadsworth.org/.
3.1.4 Expression profiles of miRNA and target genes
In this work, we integrated two data sets of miRNA expression profiles which were obtained by different experimental method, Q-PCR and miRNA-based array[40] respectively.
Table 3.3 Details of expression profiles.
Category Author Method Description Ref.
miRNA
Q-PCR 224 human in 18 major normal tissues in human Lu et al. miRNA-bead array 217 mammalian miRNAs
from 334 human samples [40] Target Gene Su et al. gene expression
array-based
Coding genes in 79 human
All 224 human in 18 major normal tissues in human were detected by using a real-time PCR-based 220-plex miRNA expression profiling method to determine the tissue-specificity to human miRNAs. In the Lu study, a systematic expression analysis of 217 mammalian miRNAs from 334 human samples was detected by a bead-based flow cytometric miRNA expression profiling method.
Except the expression profiles of miRNAs, we also collected the gene expression profiles of coding genes in 79 human tissues. These data were obtained from NCBI GEO (GEO accession: GSD596).
Since the miRNA downregulates its target gene, the expression profile of miRNA and its target g
Pearson correlation coefficient is computed from the expression profiles both miRNA and target gene for each miRNA and its target gene (coding gene). There are 13 overlapping human tissues between the Q-PCR data set of the miRNA expression profiles and the GDS596 data set of the target gene expression profiles. The details of the 13 overlapping tissues are listed in Table 3.4.
Table 3.4 The 13 overlapping human tissues.
issue Index Tissue
enes are typically negatively correlated. The
Index Tissue Index Tissue Index T
1 Brain 5 Lung 9 Prostate 13 Trachea 2 Heart 6 Muscle 10 estis T
3 Kidney 7 Ovary 1 1 Thymus 4 Liver 8 Placenta 12 Thyroid
3.2 System flow
Fig. 3.4 shows the flowchart of the systematic method of identifying miRNA targets we propose in this work.
Figure 3.4 System flow.
The inputs should be a specific miRNA and its overexpression profiles. First, we identify the downregulated genes by analysis the miRNA overexpression profiles. This approach narrow down the search scope of targets successfully and let the prediction process be more efficiently. To support the input miRNAs and targets, the sequences of both known miRNAs and targets were retrieved from miRBase (release 11.0, April 2008)[21] and Ensembl (release 49, March 2008) [34] respectively.
For accelerating the identifying of miRNA targets against the prepared target sequences, we applied a filtering strategy based on dynamic programming which named iScan. iScan is a sequence local alignment program using the simple sum-of-pair scoring function (SP scoring function). For each kind of pair, G:C, A:T and G:U, iScan assigned score 6, 4 and 2 respectively. Otherwise, penalties of -3 and -5 are assigned for mismatched pairs and a gap respectively. After this filtering process, only those fragments which the score of alignment to a specific miRNA sequence exceed the cutoff value would be retained. These retained fragments are the candidates of miRNA targets and used as the search
database.
Table 3.5 Score of each type of pairs.
G:C A:T G:U mismatch gap
Score 6 2 4 -3 -5
Subsequent to the filtering process, three computational prediction tools, miRanda, TargetScan and RNAhybrid, are applied for identifying miRNA targets.
To increase the accuracy of miRNA target prediction, we set four criteria for filtering the potential miRNA targets predicted by the three computational programs described above. The first criterion is target site was predicted by at least two tools among miRanda, TargetScan and RNAhybrid. The second one is target gene contains multiple target sites. Third, target site locates in accessible regions which were calculated by Sfold. The last one is target site locates in the both ends of target 3’-UTR. All of these criteria were observing from the experimentally determined miRNA target sites which were retrieved from TarBase and the detail about these criteria will be elaborated in the following section of this chapter. The results which remain after the filtering of these four criteria are the potential miRNA targets of this specific miRNA.
The prediction algorithm of our method was named MRT. Besides the basic information of the relationship between miRNA and its targets, we also provide the expression data of both miRNA and its target to support the prediction results.
3.3 Filtering process of miRNA target prediction
In order to reduce the false positive and retain the more potential miRNA targets, we set four criteria by observing the experimentally data we retrieved from TarBase and surveying previous researches. The detail of these criteria will be described following.
Table 3.6 Four criteria of filtering process.
Description Number Percentage
Target site was predicted by at least two tools 28 35% Target gene contains multiple target sites 45 56.25% Target site locates in 5’ end or 3’ end of target 3’-UTR 55 68.75% Target site locates in accessible regions 10 1.25%
3.3.1 Criterion 1: Target site was predicted by at least two
tools.
In this work, three common used computational prediction programs, miRanda, RNAhybrid and TargetScan, were applied to identify miRNA targets. This criterion reserve candidate miRNA targets which were predicted by at least two tools (Fig. 3.4).
Figure 3.5 Criteria of identifying miRNA targets.
3.3.2 Criterion 2: Target gene contains multiple target
sites.
Previous research indicated that one gene can contain several miRNA target sites. Thus, this criterion keeps the miRNA targets that contain more than two target sites. In the 80 experimentally data we retrieved from TarBase, there are 48 unique genes and 15 of them contain multiple target sites. For example, the C. elegans miRNA let-7 binds to night and eight sites in NRAS and KRAS respectively [42]. Otherwise, one of homebox (HOX) clusters, HOXA7, also be regulated by miR-196 with 4 binding sites[43]. Thus, after this filtering process, only those genes contain multiple target sites would be kept.
3.3.3 Criterion 3: Target site locates in 5’ end or 3’ end of
target 3’-UTR.
Previous researches indicated that the function of a target binding site is related to its location in 3’-UTR. The effective target sites preferentially reside near the both end of the 3’-UTR[44, 45].
Examined the experimentally data get from TarBase, we divide whole 3’-UTR into three equal parts (as Fig 3.5A), there are about 68.75% target sites located in the both ends. To be stricter, we separated each 3’-UTR into four equal parts (as Fig 3.5B) and there are still 48.75% of these target sites reside in the quarter parts of both ends. Thus, this criterion keeps the potential target sites which locate in the both ends of the target 3’UTR.
Figure 3.6 Criterion 3 of identifying miRNA targets.
3.3.4 Criterion 4: Target site locates in accessible regions.
The structural elements in RNA secondary structure include helix, hairpin loop, bulge loop, interior loop and multi-branched loop. These elements make the RNA secondary structure more complicated.
Several studies suggested that the structure of miRNA target would affect the miRNA biding ability. The sequence context that surrounds the miRNA target sites influences the binding affinities of miRNA/target duplex. Kertesz et al. [46] indicated that the secondary structures contribute to target recognition, because there is an energetic cost to free base-pairing interactions within mRNA in order to make the target accessible for
miRNA binding (Fig. 3.6). Long at el. [47] posited the accessible model of miRNA target sites for predicting miRNA targets and successfully interpreted the published data on the in vivo of C. elegans reporter genes that contain modified lin-41 3’-UTR sequences.
Figure 3.7 Energetic cost to free base-pairing interactions (Long, D., et al. 2007).
In this work, if the miRNAs hybridize to the target sites are located in the accessible regions are more likely to be real, shown as Fig. 3.7. The accessibility of target sequence is calculated by Sfold.
Chapter 4 Results
4.1 Case study: miR-124
In this work, we used miR-124 as an example. miR-124 is highly expressed in brain and kidney[40]. miR-124a was first identified by cloning studies in mouse[48] and its expression was later verified in human embryonic stem cells[40, 49]. There are 183 known miR-124 targets in TarBase.
Figure 4.1 Bead-array miRNA expression profile of miR-124.
We downloaded the miR-124 overexpression profiles from the NCBI GEO database[35] for one published study (accession GSE6207). In the Wang study[33], miR-124 and negative control miRNA were transfected
into HepG2 cell line using the Reverse Transfection protocol recommend by Ambion. The changes in global gene expression profiles were evaluated by microarray experiments at 4, 8, 16, 24, 32, 72, and 120 h post transfection using Affymetrix human U133Plus2 chip.
To narrow down the candidate target database, we analysis the expression profiles to identify the downregulated genes before applying the computational prediction programs. Array signals were normalized using R which is a project of statistical computing. A gene was defined as downregulated if the expression reduction was at least 50% compared with negative control (fold change < -1).
Figure 4.2 The amount of downregulated genes at each time point.
Examined the expression data, there were only a small number of genes be downregulated by miR-124 at early stage (4 hour and 8 hours). The amount of downregulated targets increasing rapidly during 16 hour to 72
hour. Transfection time point at 72 hour has the most downregulated genes. However, the rate of downregulated targets is slow down at the later points. The amount of downregulated genes at each time point were shown in Fig. 4.2.
In this work, 744 genes were considered as the candidate targets and there are 46 genes were recorded in TarBase as the experimentally supported target genes of miR-124. Go through the system flow described above, 227 of these candidate genes were predicted as the potential targets of miR-124 and contained 709 target sites.
Shown as Fig.4.3, There were a large number of target sites satisfied criterion 2, target gene contains multiple target sites, and criterion 3, target site locates in 5’ end or 3’ end of target 3’-UTR. Nevertheless, only a few percentages of predicted target sites satisfied criterion 1, target site was predicted by at least two tools, and criterion 4, target site locates in accessible regions.
As described above, there were 46 experimentally tested miR-124 target genes in the candidate targets. 39 of these experimentally tested miR-124 target genes were predicted as the potential targets by the systematic method. Furthermore, there are three genes were satisfied all of the four criteria we described above and also known as the target of miR-124.
Table 4.1 39 experimentally targets of has-miR-124 predicted by MRT.
Gene Type Indirect Support Paper
ACAA2 Downregulation/ Cleavage
Microarray assay AND Real-time RT-PCR assay
Lim et al, 2005; Wang et al, 2006
AP1M2 Downregulation/ Cleavage
Microarray assay Lim et al, 2005
ARAF1 Downregulation/ Cleavage
Microarray assay Lim et al, 2005
ATP6V0E Downregulation/ Cleavage
Microarray assay AND Real-time RT-PCR assay
Lim et al, 2005; Wang et al, 2006
B4GALT1 Downregulation/
Cleavage
Microarray assay Lim et al, 2005
FN5 Downregulation/ Cleavage
Microarray assay Lim et al, 2005
C14orf24 Downregulation/ Cleavage
Microarray assay Lim et al, 2005
FLJ20364 Downregulation/ Cleavage
Microarray assay Lim et al, 2005
CD164 Downregulation/ Cleavage
Microarray assay AND Real-time RT-PCR assay
Lim et al, 2005; Wang et al, 2006
CDCA7 Downregulation/ Cleavage
Microarray assay Lim et al, 2005
Cleavage
CDK4 Downregulation/ Cleavage
Microarray assay Lim et al, 2005
CHSY1 Downregulation/ Cleavage
Microarray assay Lim et al, 2005
ELOVL1 Downregulation/ Cleavage
Microarray assay Lim et al, 2005
ELOVL5 Downregulation/ Cleavage
Real-time RT-PCR assay Wang et al, 2006
F11R Downregulation/ Cleavage
Microarray assay Lim et al, 2005
G3BP Downregulation/ Cleavage
Microarray assay Lim et al, 2005
HADHSC Downregulation/ Cleavage
Microarray assay Lim et al, 2005
ITGB1 Downregulation/ Cleavage
Microarray assay Lim et al, 2005
LASS2 Downregulation/ Cleavage
Microarray assay Lim et al, 2005
LITAF Downregulation/ Cleavage
Microarray assay Lim et al, 2005
LRRC1 Downregulation/ Cleavage
Microarray assay Lim et al, 2005
NEK6 Downregulation/ Cleavage
Microarray assay Lim et al, 2005
NME4 Downregulation/ Cleavage
Microarray assay Lim et al, 2005
PLOD3 Downregulation/ Cleavage
Microarray assay Lim et al, 2005
POLR3G Downregulation/ Cleavage
Microarray assay Lim et al, 2005
PTBP1 Downregulation/ Cleavage
Microarray assay Lim et al, 2005
PTPN12 Downregulation/ Cleavage
Microarray assay Lim et al, 2005
RYK Downregulation/ Cleavage
Microarray assay Lim et al, 2005
SLC15A4 Downregulation/ Cleavage
Microarray assay Lim et al, 2005
SUCLG2 Downregulation/ Cleavage
Real-time RT-PCR assay Wang et al, 2006
SURF4 Downregulation/ Cleavage
Real-time RT-PCR assay Wang et al, 2006
SYPL Downregulation/ Cleavage
Microarray assay Lim et al, 2005
TEAD1 Downregulation/ Cleavage
Microarray assay Lim et al, 2005
TOM1L1 Downregulation/ Cleavage
Microarray assay Lim et al, 2005
Cleavage
UHRF1 Downregulation/ Cleavage
Microarray assay Lim et al, 2005
VAMP3 Downregulation/ Cleavage
Microarray assay AND Real-time RT-PCR assay
Lim et al, 2005; Wang et al, 2006
ZBED3 Downregulation/ Cleavage
Microarray assay Lim et al, 2005
4.2 has-miR-124 regulated the RYK and ARAF
RYK and ARAF are known as two targets of has-miR-124 [49]. In the overexpression profiles of miR-124 (GSE6207), both RYK and ARAF were first downregulated by miR-124 at 72 h. The gene expression profiles between RYK and miR-124 were shown in Fig. 4.2 and the gene expression profiles between ARAF and miR-124 were shown in Fig. 4.3. It is obvious that the both RYK and ARAF negatively correlated with miR-124. The Pearson’s correlations of RYK and ARAF are -0.48 and -0.62 respectively.
Figure 4.5 Gene expression profiles of ARAF and miR-124.
For increasing the accuracy of prediction, four criteria were applied for filtering out the false target sites. Either RYK or ARAF satisfied all of these four criteria, were predicted by at least two tools, contain multiple target sites, target sites locate in the both end of target 3’-UTR and target sites locate in accessibility.
4.3 Comparison with MirTarget
As introduced before, MirTarget is an algorithm for detecting miRNA targets combining relevant parameters, with assigned different weights according to the relative importance. A gene was defined as a target of a specific miRNA if the score is equal to or greater than thread hold value 30.
Table 4.2 Comparison of MirTarget and MRT.
Features MirTarget MRT
Known miRNAs miRBase (version 7.0) miRBase (version 11.0) Supported species human, mouse, rat, dog,
chicken
2 insects, 9 vertebrates and 1 worm Experimental miRNA
targets
- TarBase and Surveying literature miRNA expression
profiling
- Lu. et al miRNA profiling in human Q-PCR miRNA profiling in human Expression profiles of miRNA targets - NCBI-GEO-GDS596 (76 human tissues) miRNA target prediction tools
- miRanda, RNAhybrid and TargetScan
Criteria for filtering the predicted miRNA targets
- predicted by at least two tools target genes contained multiple sites target site is accessible
Accessible region of miRNA target sites
- Sfold Tissue specificity of
human miRNAs
- Q-PCR miRNA profiling (18 human tissues)
In the Wang study, they predicted the potential miRNA targets of miR-124 using MirTarget. Overall 8810 target genes, 131 candidate genes received prediction scores of MirTarget and 85 target genes (Table 4.3) were predicted as targets of miR-124 (score ≧30). Of these 85 predicted target genes, 76 were represented on the microarray (GSE6207).
However, 20 of these 76 potential miR-124 targets were the experimentally supported targets recorded in TarBase. There are 5 target genes were also predicted by our method.
Shown as Fig. 4.6, there are 39 and 20 known miRNA targets predicted by MRT and MirTarget respectively. Only 5 of these 41 overlapping targets were predicted by both MRT and MirTarget. There is 144 known miR-124 targets did not predicted by MRT and most of these known targets were filtering out during the microarray analysis process before computational prediction. Thus, identifying a downregulated gene from
microarray data is relevant to the prediction of miRNA targets in the method we proposed. 41 targets were predicted by both of these programs and the coverage ratio is 53.94%.
Chapter 5 Discussions
5.1 Identification of downregulated genes based on
microarray data
In order to increasing the accuracy of target prediction, we analysis the overexpression profiles of a specific miRNA. There are many way to analysis the expression profiles. The results of different analysis were various. For example, in this work, we normalize the microarray signal by using R. A gene was defined as downregulated if the expression reduction was at least 50% compared with negative control. However, there is still some real target genes of miR-124 which recorded in TarBase were filtered out by this filtering process. Thus, the definition of a group of downregulated genes without losing the real target genes is an important issue.
5.2 Parameter optimization of iScan
Before using the computational program to identifying miRNA targets we applied a sequence local alignment program, iScan, to filtering out the fragments if their alignment scores do not exceed the cutoff.
However, each of the prediction tools integrated in this work were used different methods. Such as TargetScan is focus on the complementary between the seed region of miRNA and its targets. Instead of calculating the alignment score between the whole length of potential target site and miRNA, focus on the alignment between the seed region of miRNA and its targets might keep more possible targets. Thus, toward different
computational target prediction programs setting different parameters may increase the accuracy of prediction.
5.3 The definition of a target site is accessible or not
will affect the performance of our method
To calculate the accessibility of target sequence, Sfold was applied in our method. However, the cost time of predicting the sequence accessibility is depend on the length of target genes. It might cost lots of time for calculating the accessibility of a long sequence. It is not a time-consuming way to predict target accessibility.
A target site was considered as accessible if the average of accessibility of the target site is > 0.5. However, the complementary between miRNA and its targets might be imperfect and previous studies indicated that most of the target sites were perfectly complementary to the seed region of the specific miRNA. Therefore, considering the accessibility of the position 2-7 of the target site 3’ end maybe can let the prediction more accuracy.
5.4 Adding other useful criteria and applying scoring
function for filtering process
To increase the accuracy of target prediction, we set four criteria which were the features observed from the experimentally tested targets for filtering the potential miRNA targets predicted by the three computational prediction tools applied in our method. However, in addition to these
criteria we set, there still are other features were related to miRNAs and its targets. We can discover other features and set them as our criteria for improving our prediction. Moreover, these features have different relative importance. If we applying a scoring function for these criteria may improve our prediction.
5.5 Prospective works
To improvement the system of identifying miRNA targets, setting other useful criteria by observing the known miRNA targets, integrated other computational programs with different methods and adjust the parameters of iScan for each program integrated in this system.
Chapter 6 Conclusion
miRNA controls many cellular processes, it is important to identify their targets with high accuracy. In this work, we propose a systematic method of identifying miRNA targets. Users should provide the expression profiles of the specific miRNA for us to identify a group of potential miRNA target genes. In this approach, we can observe the reduction of mRNA level, not just the amount of protein deriving from mRNA. Then three common used computational prediction tools were integrated for finding miRNA targets. To increase the accuracy of miRNA target prediction, we observed the experimentally tested miRNA target sites and developed several criteria. Moreover, we also provided the expression profiles of both miRNA and its target gene to describe miRNA/target relationship. Finally, in this work, we concentrate the miRNA target identification in human genome. However, this systematic approach is suitable for each species but with different parameters.
Reference
1. Lau, N.C., et al., An abundant class of tiny RNAs with probable regulatory roles
in Caenorhabditis elegans. Science, 2001. 294(5543): p. 858-62.
2. Lee, R.C. and V. Ambros, An extensive class of small RNAs in Caenorhabditis
elegans. Science, 2001. 294(5543): p. 862-4.
3. Lagos-Quintana, M., et al., Identification of novel genes coding for small
expressed RNAs. Science, 2001. 294(5543): p. 853-8.
4. He, L. and G.J. Hannon, MicroRNAs: small RNAs with a big role in gene
regulation. Nat Rev Genet, 2004. 5(7): p. 522-31.
5. Girard, A., et al., A germline-specific class of small RNAs binds mammalian
Piwi proteins. Nature, 2006. 442(7099): p. 199-202.
6. Aravin, A., et al., A novel class of small RNAs bind to MILI protein in mouse
testes. Nature, 2006. 442(7099): p. 203-7.
7. Kim, V.N., Small RNAs just got bigger: Piwi-interacting RNAs (piRNAs) in mammalian testes. Genes Dev, 2006. 20(15): p. 1993-7.
8. Chapman, E.J. and J.C. Carrington, Specialization and evolution of endogenous
small RNA pathways. Nat Rev Genet, 2007. 8(11): p. 884-96.
9. Lee, R.C., R.L. Feinbaum, and V. Ambros, The C. elegans heterochronic gene
lin-4 encodes small RNAs with antisense complementarity to lin-14. Cell, 1993.
75(5): p. 843-54.
10. Ha, I., B. Wightman, and G. Ruvkun, A bulged lin-4/lin-14 RNA duplex is
sufficient for Caenorhabditis elegans lin-14 temporal gradient formation. Genes
Dev, 1996. 10(23): p. 3041-50.
11. Reinhart, B.J., et al., The 21-nucleotide let-7 RNA regulates developmental
timing in Caenorhabditis elegans. Nature, 2000. 403(6772): p. 901-6.
12. Kosik, K.S., The neuronal microRNA system. Nat Rev Neurosci, 2006. 7(12): p.
911-20.
13. Wienholds, E. and R.H. Plasterk, MicroRNA function in animal development. FEBS Lett, 2005. 579(26): p. 5911-22.
14. Rhoades, M.W., et al., Prediction of plant microRNA targets. Cell, 2002. 110(4): p. 513-20.
15. Lewis, B.P., et al., Prediction of mammalian microRNA targets. Cell, 2003.
115(7): p. 787-98.
16. Lewis, B.P., C.B. Burge, and D.P. Bartel, Conserved seed pairing, often flanked
by adenosines, indicates that thousands of human genes are microRNA targets.
Cell, 2005. 120(1): p. 15-20.
17. Enright, A.J., et al., MicroRNA targets in Drosophila. Genome Biol, 2003. 5(1): p. R1.
18. Rehmsmeier, M., et al., Fast and effective prediction of microRNA/target
duplexes. Rna, 2004. 10(10): p. 1507-17.
19. Kruger, J. and M. Rehmsmeier, RNAhybrid: microRNA target prediction easy,
fast and flexible. Nucleic Acids Res, 2006. 34(Web Server issue): p. W451-4.
20. Sethupathy, P., B. Corda, and A.G. Hatzigeorgiou, TarBase: A comprehensive
database of experimentally supported animal microRNA targets. Rna, 2006.
12(2): p. 192-7.
21. Griffiths-Jones, S., et al., miRBase: tools for microRNA genomics. Nucleic Acids Res, 2008. 36(Database issue): p. D154-8.
nomenclature. Nucleic Acids Res, 2006. 34(Database issue): p. D140-4.
23. Hsu, P.W., et al., miRNAMap: genomic maps of microRNA genes and their target
genes in mammalian genomes. Nucleic Acids Res, 2006. 34(Database issue): p.
D135-9.
24. Hsu, S.D., et al., miRNAMap 2.0: genomic maps of microRNAs in metazoan
genomes. Nucleic Acids Res, 2008. 36(Database issue): p. D165-9.
25. Nam, S., et al., miRGator: an integrated system for functional annotation of
microRNAs. Nucleic Acids Res, 2008. 36(Database issue): p. D159-64.
26. Betel, D., et al., The microRNA.org resource: targets and expression. Nucleic Acids Res, 2008. 36(Database issue): p. D149-53.
27. Kim, S.K., et al., miTarget: microRNA target gene prediction using a support
vector machine. BMC Bioinformatics, 2006. 7: p. 411.
28. Hofacker, I.L., RNA secondary structure analysis using the Vienna RNA package.
Curr Protoc Bioinformatics, 2004. Chapter 12: p. Unit 12 2.
29. Hofacker, I.L., Vienna RNA secondary structure server. Nucleic Acids Res, 2003.
31(13): p. 3429-31.
30. Krek, A., et al., Combinatorial microRNA target predictions. Nat Genet, 2005.
37(5): p. 495-500.
31. Kiriakidou, M., et al., A combined computational-experimental approach
predicts human microRNA targets. Genes Dev, 2004. 18(10): p. 1165-78.
32. Wuchty, S., et al., Complete suboptimal folding of RNA and the stability of
secondary structures. Biopolymers, 1999. 49(2): p. 145-65.
33. Wang, X., Systematic identification of microRNA functions by combining target prediction and expression profiling. Nucleic Acids Res, 2006. 34(5): p. 1646-52.
34. Flicek, P., et al., Ensembl 2008. Nucleic Acids Res, 2008. 36(Database issue): p. D707-14.
35. Barrett, T., et al., NCBI GEO: mining tens of millions of expression
profiles--database and tools update. Nucleic Acids Res, 2007. 35(Database
issue): p. D760-5.
36. Ding, Y. and C.E. Lawrence, A statistical sampling algorithm for RNA
secondary structure prediction. Nucleic Acids Res, 2003. 31(24): p. 7280-301.
37. Stark, A., et al., Identification of Drosophila MicroRNA targets. PLoS Biol, 2003.
1(3): p. E60.
38. Mangan, M.E., et al., UCSC Genome Browser: Deep support for molecular
biomedical research. Biotechnol Annu Rev, 2008. 14: p. 63-108.
39. Ding, Y. and C.E. Lawrence, Statistical prediction of single-stranded regions in
RNA secondary structure and application to predicting effective antisense target sites and beyond. Nucleic Acids Res, 2001. 29(5): p. 1034-46.
40. Lu, J., et al., MicroRNA expression profiles classify human cancers. Nature, 2005. 435(7043): p. 834-8.
41. Su, A.I., et al., A gene atlas of the mouse and human protein-encoding
transcriptomes. Proc Natl Acad Sci U S A, 2004. 101(16): p. 6062-7.
42. Johnson, S.M., et al., RAS is regulated by the let-7 microRNA family. Cell, 2005.
120(5): p. 635-47.
43. Yekta, S., I.H. Shih, and D.P. Bartel, MicroRNA-directed cleavage of HOXB8
mRNA. Science, 2004. 304(5670): p. 594-6.
44. Gaidatzis, D., et al., Inference of miRNA targets using evolutionary conservation
and pathway analysis. BMC Bioinformatics, 2007. 8: p. 69.
45. Grimson, A., et al., MicroRNA targeting specificity in mammals: determinants
46. Kertesz, M., et al., The role of site accessibility in microRNA target recognition. Nat Genet, 2007. 39(10): p. 1278-84.
47. Long, D., et al., Potent effect of target structure on microRNA function. Nat Struct Mol Biol, 2007. 14(4): p. 287-94.
48. Lagos-Quintana, M., et al., Identification of tissue-specific microRNAs from
mouse. Curr Biol, 2002. 12(9): p. 735-9.
49. Lim, L.P., et al., Microarray analysis shows that some microRNAs downregulate