E n v i r o n m e n t a l
C o n t a m i n a t i o n
a n d T o x i c o l o g y
© 1996 Springer-Verlag New York Inc.Monitoring Lead Pollution Near a Storage Battery Recycling Plant in Taiwan,
Republic of China
C.-Y. Yeh ~, H.-Y. Chiou 1, R.-Y. Chen 1, K.-H. Yeh I, W.-L. Jeng 2, B.-C. Han l School of Public Health, Taipei Medical College, Taipei, Taiwan, Republic of China 2 Institute of Oceanography, National Taiwan University, Taipei, Taiwan, Republic of China Received: 27 May 1995/Revised: 15 September 1995
Abstract. This study presents the distribution of blood lead levels and lead in various environmental samples (water, sedi- ments, soils, and air) near the Shing-Yie storage battery recycl- ing plant in Taiwan before (July 1990 to June 1991) and after (July 1992 to June 1993) amelioration. Before amelioration, the average blood lead levels in the neighborhood of the plant were in the range of 10.55 + 5.7 to 12.28 + 7.9 txg/dl. After amelioration, relatively lower average concentrations of blood lead (range 8.35 -+ 3.0 to 9.13 -+ 2.5 txg/dl) were generally found; however, these averages were still higher than that (7.79 _+ 3.5 ixg/dl) from other lead-unpolluted areas of Taiwan. An exceedingly high geometric mean (GM) lead concentration (128 txg/L) was found in the downstream river water of the Tawulum River passing by the plant. The concentrations of lead (GM = 372 and 418 txg/g) in the downstream river sedi- ments were higher than those (GM = 123 and 158 p,g/g) in the upstream river sediments before and after amelioration, respectively. Furthermore, lead species in river sediments were analyzed by a sequential leaching technique. The sum of phases I, II, and III accounted for 83.7% of total lead at station R2 (nearest to the plant). Maximum lead concentration (GM = 2402 Ixg/g) in dust at the soil surface from station SL (nearest to the plant) was much higher than those from the other stations by about 18 times before amelioration. However, the maximum value dropped to 1,155 txg/g after amelioration. On the whole, the geometric mean concentration of lead in dust at the soil surface nearest to the plant was > 1,000 Ixg/g and decreased to <100 I~g/g in the 15-30 cm depth soil about 2 km away from the plant. Before amelioration, the geometric mean lead concentration of 4.57 ixg/m 3 (range 0.102-37.6 ~g/m ~) in the air near the plant was higher than that at the background locations, the geometric mean value of which was 0.08 Ixg/m 3.
Correspondence to: B.-C. Han
Taiwan is a modern industrialized island country with a popula- tion of about 21 million and a strong economy. However, due to dense population and rapid industrial expansion, the different environments of Taiwan are suffering an ever-increasing impact from various human activities (Han et al 1992b; Han et al.
1994b; Jeng and Han 1994). Heavy metal pollution is the most serious and one of the most studied environmental problems in Taiwan. Lead exposure remains a significant public health concern (Jang 1989; Rabinowitz et al. 1992) due to the fact that the metal is widespread in our environment and has been shown to be toxic even at low doses, especially for the fetus or for children (Needleman et al. 1990; Greene et al. 1992).
Exposure of lead for the general public comes mainly from the airborne dust containing lead particulates and food or water contaminated by lead. However, as a special case, a five-month- old female infant died as a result of long-term feeding with an ancient Chinese medicine, "Ba-pao-neu-hwang-san". The drug contained lead at 44,000 txg/g. This medicine is still widely used by ordinary people (Chi et al. 1993).
In Taiwan with the increasing awareness of lead as an envi- ronmental hazard, there is growing inquiry regarding tissue levels and recognition of groups at high risk. In 1987, a case of lead poisoning occurred in workers at a lead battery recycling factory in northern Taiwan. Jang (1989), Rabinowitz et al.
(1991, 1992), and Wang et al. (1992) conducted a follow-up study of the impact of the factory's lead contamination on the incidence of occupational and environmental diseases. Their studies found that the blood lead level exceeded 40 Ixg/dl in 85% of the factory workers. The blood lead level of children from a neighboring kindergarten was found to be higher than that of the control group, and a decrease in their IQ was also seen (Jang 1989). An examination of students from a nearby elementary school revealed that lead content in their teeth was higher than that of the teeth of their Taipei City counterparts (Rabinowitz et al. 1991). In addition, Wang et al. (1992) also reported that (1) air lead levels were 12.9---11.4 and 12.8 -- 8.00 ixg/m 3 at 50m and 100m, respectively, from the Shing-Yie smelter compared to 1.2-1.9 Ixg/m 3 1 km away, (2) lead concentrations in the surface soil near the smelter were
228 C.-Y. Yeh et al. North
\\
$8
$7
l
,
"W"
__~____
0
500m
""~ ,-
~ \ ~ C5~
,
.
- ' . . "
,
&
\
A4
~
/
N .~borUOOa
\
N~gh~r~OO
~
]
I
/
,S'
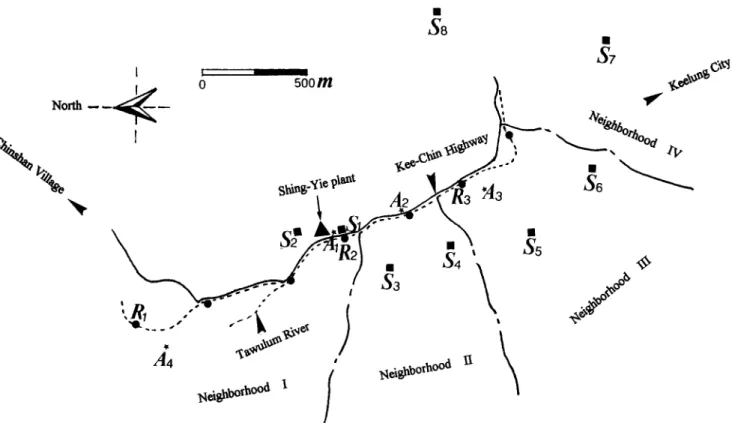
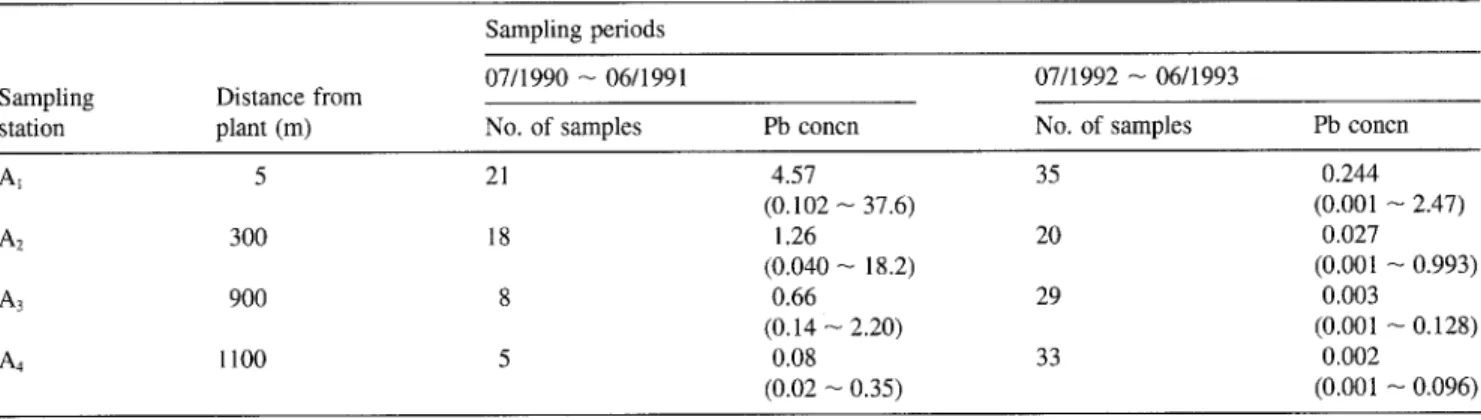
Fig. 1. Sampling locations of human blood, river water (o), sediments (e), soils (m), and air (*) around the Shing-Yie storage battery recycling plant (A)
up to 4,100 + 3,500 txg/g and decreased to 21.8 -+ 12.5 p,g/g in the 15-30 cm depth soil, and (3) 22 out of 36 exposed children had a blood lead level exceeding 15 p~g/dl. However, there is much circumstantial evidence that lead in environmental samples had an important influence on human uptake (Thornton et al. 1990; Mielke 1991, 1992; Francek et al. 1994), but there was a pressing need for further research. Furthermore, there is little information on the relationships between lead in environ- mental samples and exposure assessment of humans. Therefore, this study presents the distribution of blood lead levels and lead in various environmental samples (such as water, sediments, soils, and air) near the Shing-Yie storage battery recycling plant before (July 1990 to June 1991) and after (July 1992 to June 1993) amelioration (some measures taken to reduce pollution, e.g., installing dust collectors). The paper also preliminarily evaluated the relationship between lead concentrations in the environment and blood lead levels in humans. Furthermore, the purpose of this work was to better understand the lead contamination impact on the environment and human health near a storage battery recycling plant.
Materials and Methods
Environmental samples including tap water, river water, sediments, soils, and air were sampled around the Shing-Yie storage battery recycl- ing plant of Keelung in northern Taiwan during two periods--before (July 1990 to June 1991) and after (July 1992 to June 1993) ameliora- tion. Although water wells were few in the area, analyzing well water was also included since some people might be exposed to the well water. Sampling for fiver water, sediment, soil, and air was done every season. Sampling locations are shown in Figure 1. It is noted that all
sampling stations are mostly located in the south of Kee-Chin highway. This was based on the residential quarter being in the south of Kee- Chin highway, and non-residential areas (bumpy hills) in the north.
Water samples were returned to the laboratory in an icebox and refrigerated at 4°C until processed. All samples were analyzed for total lead concentrations after acidification to pH 2 with conc. HNO3 by measuring pH with a pH meter, and determined by differential pulse anodic stripping voltammetry (DPASV; EG&G model 384B Polaro- graphic Analyzer).
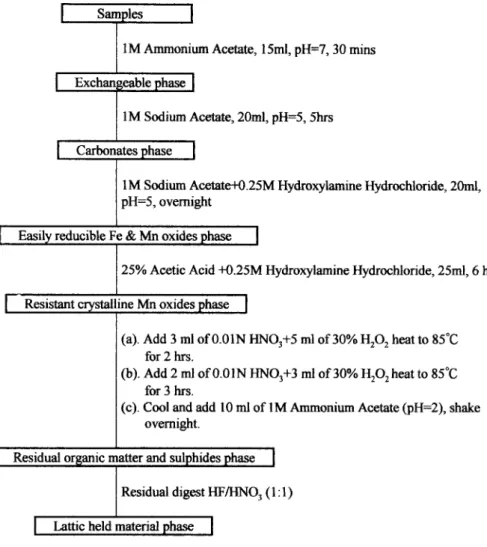
Sediments in the river bed were collected along with the river water, dried overnight, and sieved (<63 Ixm mesh) to obtain the mud fraction. Soil surface dust was collected by brushing, and surface soil samples were taken from 0-15 and 15-30 cm depths at various locations. Accurately, 0.20 g of the dried and homogenized samples were placed in a 50 ml capped polypropylene centrifuge tube with different reagents to release different phases of lead as shown in Figure 2 (Han et al. 1992a). Total lead concentrations were determined by flame AAS (Hitachi Z-8000) at 283.3 nm.
Total particulates in air were collected with a Kimoto and Anderson high volume sampler from 4 different sites, i.e., 50, 100, 950, and 1200 m away from the Shing-Yie plant. The loaded glass fiber filters were digested and analyzed for the lead concentrations using graphite AAS (Han et al. 1994a).
A total of 931 men and 843 women aged 8 to 65 years residing within 2 km around the Shing-Yie plant participated in the study on a volunteer basis after issuing public notice. Ten percent of the popula- tion was sampled as representative. Each family was asked to fill out a questionnaire regarding their birth date, education, and occupational status (especially any occupational exposure to lead), whether they lived beside a main street with major traffic, and other background in- formation.
Whole blood samples were taken by venipuncture in a vacuum- collection tube with top color green containing sodium heparin as anticoagulant. The samples were stored in a refrigerator and analyzed
I
Samples
I
1M Ammonium Acetate, 15ml, pH=7, 30 mins
] Exchangeable phase [
1M Sodium Acetate, 20ml, pH=5, 5hrs
[ Carbonates phase [
I M Sodium Acetate+0.25M Hydroxylamine Hydrochloride, 20ml, pH=5, overnight
Easily reducible Fe & Mn oxides phase I
25% Acetic Acid +0.25M Hydroxylamine Hydrochloride, 25ml, 6 hrs
" Resistant crystalline Mn oxides phase [
(a). Add 3 ml of0.01N HNO3+5 ml of 30% H20 z heat to 85°C for2 hrs.
(b). Add 2 ml of0.01N HNO3+3 ml of 30% H202 heat to 85°C for 3 hrs.
(c). Cool and add 10 ml of IM Ammonium Acetate (pH=2), shake overnight.
Residual organic matter'and sulphides phase [
Residual digest HF/HNO 3 (1 : 1)
] Lattic held material phase ]
Fig. 2. Flow chart showing the sediment and soil sequential extraction scheme (after Han et al. 1992a)
as soon as possible (within 24 h) (Berode et al. 1991). The blood of inhabitants were 5 ml samples for measurements of lead, zinc proporphyrin (ZPP), hemoglobin (Hb), and serum ferritin. Determina- tion of blood lead levels was performed by graphite AAS (Han et al. 1991).
For statistical analyses, left skewed data were normalized by loga- rithmic transformation. Accordingly, geometric mean (GM) values were reported. A one-way analysis of variance (ANOVA), students t- tests, and paired t-test were used to study differences of blood lead levels between four neighborhoods and sampling periods of each neigh- borhood.
Results a n d Discussion
Quality Assurance o f Lead in Blood and Environmental Samples
Replicate analysis of standard reference materials (SRM) (river water SLRS-2; fiver sediment CRM 320; light sandy soil BCR 142; metals on filter media 2676C; ContoxBlood lead controls) from the National Research Council Canada, the Commission of the European Communities, the U.S. National Bureau of Standards, and the KLI Company showed good accuracy (<20%) with all results comparable with certified values. For example, 0.130 _+ 0.020 ~g/L was found as compared to the SRM for river water reference value of 0.129 + 0.011 ~g/L. On the other hand, replicate analysis of various SRM in the
experiments also showed good precision (coefficients of varia- tion were 19% for blood, 15% for river water, 2.7% for river sediment, 1.6% for light sandy soil, and 7.9% for air filter paper). The certified and experimental values for each SRM are listed in Table 1.
Blood Lead Concentrations
Mean, standard deviation, and students t-test of the observed blood lead level distributions in four neighborhoods are pre- sented in Table 2. Analysis of variance (ANOVA) revealed that the average blood lead levels differed significantly between sampling neighborhoods and between sampling periods (Table 2). In addition, the results indicate that the average blood lead levels collected from 4 different neighborhoods in July 1992- June 1993 were lower than those in July 1990-June 1991. The reason is that the Shing-Yie plant stopped operation by the EPA of ROC from July 1991 and that some amelioration action was taken. The cause of the high blood lead levels was identified as lead pollution due to discharges from the Shing-Yie lead recycling operation (Han et al. 1991; Wang et aL 1992). How- ever, relatively high average concentrations of blood lead (range from 8.35 -+ 3.0 to 9.13 _+ 2.5 p~g/dl) were generally found in samples from people residing around the Shing-Yie plant in July 1992-June 1993 compared with those (7.79 +_ 3.5 p~g/dl) from other lead-unpolluted areas of Taiwan. From students
230 C.-Y. Yeh et al.
Table 1. Determination of lead in standard reference material (SRM) by FAAS, GAAS, and DPASV
Value obtained Certified Coefficients of Accuracy
SRM Method in our lab. value variation (%) (%)
Blood GAAS 24.0 ± 4.5 p,g/dl 20.0 ± 7.0 ixg/dl 19 +20
River water DPASV 0.130 _+ 0.020 txg/L 0.129 ± 0.011 ixg/L 15 +0.77
River sediment FAAS 40.8 ± 1.1 ~g/g 42.3 ± 1.6 ixg/g 2.7 - 3 . 6
Light sandy soil FAAS 38.0 _+ 0.6 ~g/g 37.8 ± 0.9 ixg/g 1.6 +0.53
Air filter paper GAAS 8.31 _+ 0.7 ixg/paper 7.47 ± 0.011 txg/paper 7.9 +10
FAAS: Flame atomic absorption spectrophotometry GAAS: Graphite atomic absorption spectrophotometry DPASV: Differential pulse anodic stripping voltammetry
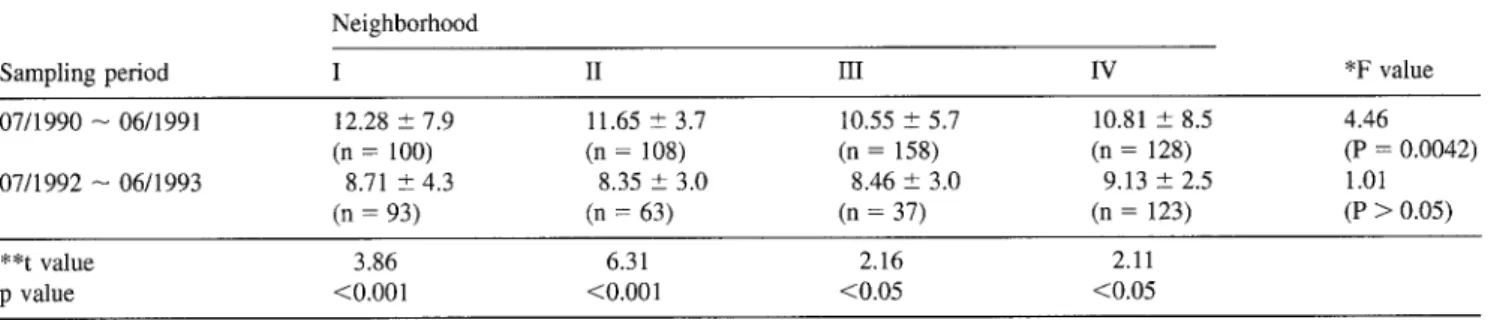
Table 2. Distribution of average blood lead levels (Ixg/dl) in four neighborhoods during two sampling periods. Data are presented as mean +_ 1 s.d.
Neighborhood
Sampling period I II III IV *F value
07/1990 -- 06/1991 12.28 _+ 7.9 11.65 ± 3.7 10.55 ± 5.7 10.81 _+ 8.5 4.46 (n = 100) (n = 108) (n = 158) (n = 128) (P = 0.0042) 07/1992 -- 06/1993 8.71 ± 4.3 8.35 _+ 3.0 8.46 _+ 3.0 9.13 ± 2.5 1.01 (n = 93) (n = 63) (n = 37) (n = 123) (P > 0.05) **t value 3.86 6.31 2.16 2.11 p value <0.001 <0.001 <0.05 <0.05
* Test for four neighborhoods
** Test for two sampling periods of each neighborhood
Table 3. Paired t-test for high average blood lead levels (>15 p,g/dl) collected from four neighborhoods during two sampling periods. Data are presented as mean _+ 1 s.d.
Neighborhood
Sampling period I II III IV Total average
07/1990 - 06/1991 20.25 ± 4.3 18.38 + 3.2 18.44 ± 3.1 19.25 ± 4.0 18.84 ± 3.3 07/1992 -- 06/1993 15.50 ± 6.0 10.88 ± 1.8 12.78 ± 3.0 11.75 ± 2.2 12.44 ± 3.4
Difference of average 4.75 7.50 5.66 7.50 6.40 +_ 3.6
t = 8.79, df = 24, p < 0.001
t-test analysis, the blood lead levels collected from different residential neighborhoods differed significantly (p < 0.05) from those from lead-unpolluted areas. In other words, in the lead-unpolluted area, blood lead had lower concentrations prob- ably because of their remote locations (i.e., away from pollu- tion sources).
Life style may influence lead absorption (Berode et al. 1991). Environmental factors such as living in an area with high traffic density, occupational hobbies, and the age of dwelling may also influence the exposure to lead (Huel et al. 1986; Quinn and Delves 1987; Ducoffre et al. 1990). Because sampling was done on the same group of residents, Table 3 shows the paired t-test for high average blood lead levels ( > 1 5 txg/dl) collected from four neighborhoods during two sampling periods. The results reveal that the two-year average difference of blood lead levels is in the range of 4.75 to 7.50 Ixg/dl. Generally, a review of data shows that the 4 locations had the higher average concen- tration of lead in blood (range from 18.38 -+ 3.2 to 20.25 _+ 4.3 ixg/dl) during July 1990 to June 1991, but decreasing levels
(range from 10.88 - 1.8 to 15.50 - 6.3 p,g/dl) have been ob- served significantly (p < 0.001) because a program has been implemented by EPA to reduce the pollution in this area.
L e a d in Various E n v i r o n m e n t a l S a m p l e s
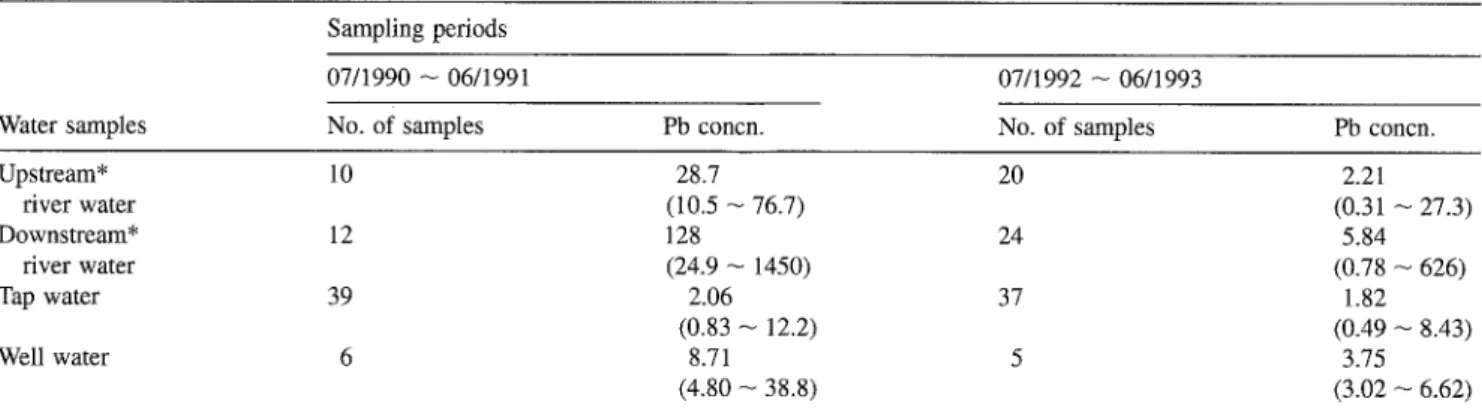
The results of analysis for lead concentrations in water, sedi- ments, soils, and air collected from different locations during two periods are listed in Tables 4-8. Table 4 shows the geometric mean concentrations of lead in various water bodies. The Tawu- lum River was particularly affected by lead. The total lead concentrations (GM = 128 and 5.84 p.g/L) in downstream river water were higher than those (GM = 28.7 and 2.21 ixg/L) in upstream river water during the periods from July 1990-June 1991 and July 1992-June 1993, respectively. The high lead concentrations in downstream river water apparently reflect a local anthropogenic input of pollutants, especially lead (Han
Table 4. Geometric mean lead concentrations 0xg/L) in river, tap, and well water during two sampling periods Sampling periods
07/1990 - 06/1991 07/1992 - 06/1993
Water samples No. of samples Pb concn. No. of samples Pb concn.
Upstream* 10 28.7 20 2.21 river water (10.5 - 76.7) (0.31 - 27.3) Downstream* 12 128 24 5.84 fiver water (24.9 - 1450) (0.78 -- 626) Tap water 39 2.06 37 1.82 (0.83 -- 12.2) (0.49 -- 8.43) Well water 6 8.71 5 3.75 (4.80 - 38.8) (3.02 -- 6.62)
* Using the Shing-Yie plant as the division point: sampling sites located north of the plant are classified as upstream, and those located south of the plant are classified as downstream
( ) = Two extreme values
Table 5. Geometric mean lead concentrations (Ixg/g) in Tawulum River sediments during two sampling periods Sampling periods
07/1990 - 06/1991 07/1992 -- 06/1993
River section No. of samples Pb concn. No. of samples Pb concn.
Upstream* 6 123 25 158
(80.2--272) (3.53--4397)
Downstream* 12 372 30 418
(203--920) (17.9--2023)
* Using the Shing-Yie plant as the division point: sampling sites located north of the plant are classified as upstream, and those located south of the plant are classified as downstream
( ) = Two extreme values
Table 6. The chemical forms of lead (~g/g) in fiver sediments collected from three stations (during 7/1990 - 6/1991) Pb phases*
Sampling
station I II III IV V VI Total**
RI 4.12 23.2 31.3 23.7 8.07 42.3 132 (3.11)*** (17.5) (23.7) (17.5) (6.11) (32.0) R2 146 223 615 102 17.4 72.5 1176 (12.4) ( 19.0) (52.3) (8.67) (1.48) (6.16) R3 70.5 78.2 54.3 73.8 22.5 36.3 335 (21.0) (23.3) ( 16.2) (22.0) (6.71 ) (10.8)
*I: Exchangeable phase; II: Carbonates phase; III: Easily reducible Fe-Mn oxides phase; IV: Moderately reducible Fe-Mn oxides phase; V: Organic phase; VI: Residual phase
**Total: I + I I + I I I + I V + V + V I ***( ): percent of total
The geometric mean concentrations of lead in drinking water (including well water) ranged from 1.82 to 8.71 Ixg/L. All data were within the limits of standard drinking water set by the EPA of ROC.
Concentrations of lead in sediments are so much higher than those in the overlying water that even a small fraction may represent an impoitant source for potential risk (Bryan et al. 1985; Gunn et al. 1991). Table 5 shows that the geometric mean lead concentrations in the river sediment varied with sampling period and location. The concentrations of lead (GM = 372 and 418 p~g/g) in the downstream river sediments
were significantly higher (p < 0.05 and 0.06) than those (GM = 123 and 158 Ixg/g) in the upstream river sediments during the periods from July 1990-June 1991 and July 1992- June 1993, respectively; this might be due to a contribution of lead pollutants discharged from the land pollution sources, especially the plant.
Furthermore, lead species in sediments such as exchangeable (phase I), carbonates (phase II), easily reducible Fe and Mn oxides (phase III), resistant crystalline Mn oxides (phase IV), residual organic matter and sulphides (phase V), and lattice held material (phase VI) were analyzed by a sequential leaching
232 C.-Y. Yeh et al.
Table 7. The chemical forms of lead (Ixg/g) in dust at the soil surface collected from five stations (during 7/1990 - 6/1991) Pb phases*
Sampling Distance from
station plant (m) I II III IV V VI Total**
St 10 960 1760 366 406 38.1 60.2 3590 (26.7) (49.0) (10.2) (11.3) (1.06) (1.68) $2 20 290 332 510 118 24.7 100 1374 (21.1 ) (24.2) (37.1) (8.58) ( 1.80) (7.27) $3 1000 31.5 21.0 20.2 42.5 19.7 16.3 151 (20.9) (13.9) (13.4) (28.1) (13.1) (10.8)
*I: Exchangeable phase; II: Carbonates phase; III: Easily reducible Fe-Mn oxides phase; IV: Moderately reducible Fe-Mn oxides phase; V: Organic phase; VI: Residual phase
**Total: I + I I + I I I + I V + V + V I ***( ) : I - V I / t o t a l × 100%
Table 8. Geometric mean lead concentrations
(~g/m 3)
in air samples from four stations during two sampling periods Sampling periods07/1990 -- 06/1991 07/1992 -- 06/1993
Sampling Distance from
station plant (m) No. of samples Pb conch No. of samples Pb concn
AI 5 21 4.57 35 0.244 (0.102 -- 37.6) (0.001 -- 2.47) A2 300 18 1.26 20 0.027 (0.040 -- 18.2) (0.001 -- 0.993) A3 900 8 0.66 29 0.003 (0.14 -- 2.20) (0.001 -- 0.128) A4 1100 5 0.08 33 0.002 (0.02 ~ 0.35) (0.001 -- 0.096)
( ) = Two extreme values
technique (Table 6). The results show that the highest lead concentration of 146 ixg/g in the exchangeable phase was ob- tained from the sediment of station R2. This result reveals that the exchangeable lead in sediment collected from station R~ was 2.07-35.4 times higher than that from other stations. In addition, the sum of phases I, II, and III accounts for 83.7% of total lead at station R2. This might suggest that station R2 seems to be influenced by the local anthropogenic input of chemicals, especially lead. In other words, lead speciation re- sults reveal that the lead preferentially accumulated in the ex- changeable, carbonate, and easily reducible Fe-Mn oxides frac- tions. The lead pollution source in sediments was the storage battery recycling plant (Han e t al. 1991, 1992b).
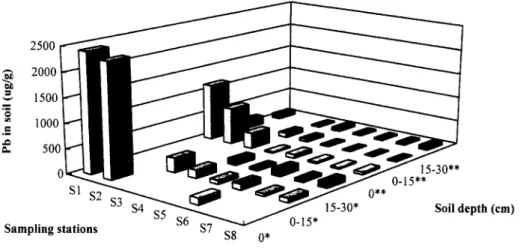
Because blood lead levels can reflect lead concentrations in local soils and dusts (Thornton e t al. 1990), an assessment of the potential health threat from lead in soils and dusts is impera- tive. The dust-hand-mouth route may be a predominant form of lead exposure during early childhood; therefore, the lead concentrations in dust and soils were examined. Figure 3 shows the lead concentrations in soil surface dust and the surface soils sampled at varying distances from the plant during July 1990-June 1991 and July 1992-June 1993. Maximum geomet- ric mean lead concentrations (2,402 ixg/g) in soil surface dust at station S~ were much higher than those from the other stations by about 18 times in July 1990-June 1991. The highest concen- tration of lead obtained at the station S~ nearest to the Shing- Yie plant might be due to lead pollutants discharged from smelting sources. However, after one year amelioration, the
lead concentration in soil surface dust at station S~ dropped to 1,155 ixg/g. However, when the soil depth was increased to 15-30 cm, the lead concentrations in the soil decreased to
<100 ~g/g.
The data obtained showed that the lead concentrations in dust (zero soil depth) and the surface soils (0-15 and 15-30 cm) during July 1992 to June 1993 were, respectively, 2.08-4.24, 3.01-8.66, and 1.37-5.04 times less than those during July 1991 to June 1992 because a program has been implemented by the plant and EPA to reduce the pollution in this area (Han
e t al. 1993). On the other hand, an inverse relationship was observed between soil lead levels and the sample distance from the Shing-Yie plant (Figure 3). On the whole, the environmental data showed that the geometric mean value of lead in dust at the soil surface near Shing-Yie was > 1000 t~g/g and decreased to <100 ixg/g in 15-30 cm depth soil about 2 km away from the plant. In general, the concentrations of lead in soils were strongly and negatively correlated with the distance from the Shing-Yie plant.
Table 7 shows the result of lead speciation in dust at the soil surface extracted by sequential procedures using several reagents. The results reveal that lead is preferentially accumu- lated in the exchangeable and carbonate fractions. For example, the total lead concentration of 3,590 p.g/g in dust of station $1 was higher than those in dust of the other stations. In addition, the sum of exchangeable and carbonate lead gave a higher percentage (75.7%) of lead in the station $1 dust. This suggests that the lead pollution is dominated synchronously by the Shing-
2500 ..~ 2000 = ,.~ 1500 1000 500 Sampling st ~8 0* epth (cm)
Fig. 3. Geometric mean lead
concentrations in the surface dust (zero soil depth) and the surface soil (0-15 and 15-30 cm) sampled at varying distances from the Shing-Yie plant during July 1990-June 1991 (*) and July 1992-June 1993 (**)
Yie plant. In the present study, the lower traffic volume caused no significant influence on lead concentrations for these areas. In general, the exposure risk due to lead-contaminated dusts and soils is in large areas where dilapidated housing is present and traffic volumes are high (Mielke 1991). Residents of smaller cities generally face a lower lead burden because large tracts of run-down housing are lacking and traffic volumes are low (Mielke 1992).
In 1992, the range of air lead concentration in high polluted cities of Taiwan were 0.3-0.6 ixg/m 3 (Han et al. 1993). However, during July 1990 to June 1991, the geometric mean concentra- tions of lead of 4.57 ]xg/m 3 (from 0.102 to 37.6 txg/m 3) in the air near the Shing-Yie plant were higher than those at the background locations, the mean value of which was 0.08 tzg/m 3. The results indicated that the highest lead in air from station A~ is 57 times more than that in air from station A4 (Table 8). In other words, on average, sampling stations located closer to the Shing-Yie plant had higher lead in their air than sampling stations located further away (Table 8). In addition, the concentrations of lead in air collected from the same station (A1) were below 0.244 ixg/m 3 after July 1992. This demon- strates that the Shing-Yie plant lowered its pollution.
Acknowledgments. We would like to thank Professor T.J. Hsu of the School of Public Health, Taipei Medical College, for making chemical analyses possible in this study. We are grateful to two reviewers for constructive comments and suggestions. This study was supported by grants from the Environmental Protection Bureau of Keelung City and the Environmental Protection Administration of the Republic of China.
R e f e r e n c e s
Berode M, Wietlisbach V, Rickenbach M, Guillemin MP (1991) Life- style and environmental factors as determinants of blood lead levels in a Swiss population. Environ Res 55:1-17
Bryan GW, Langston WJ, Hummerstone LG, Butt GR (1985) A guide of the assessment of heavy-metal contamination in estuaries using biological indicators. Mar Biol Ass UK, Plymouth, Devon, UK, Occasional Publication No. 4
Chi YM, Chen SL, Yang MH, Hwang RC, Chu ML (1993) Heavy metals in traditional Chinese medicine: Ba-pao-neu-hwang-san. Acta Paedi Sinica 34:181-190
Ducoffre G, Claeys F, Bruaux P (1990) Lowering time trend of blood lead levels in Belgium since 1978. Environ Res 51:25-34
Francek MA, Makimaa B, Pan V, Hanko JH (1994) Small town lead levels: A case study from the homes of pre-schoolers in Mt. Pleasant, Michigan. Environ Pollut 84:15%166
Greene T, Ernhart CB, Boyd TA (1992) Contributions of risk factors to elevated blood dentine lead levels in preschool children. Sci Total Environ 115:239-260
Gunn AM, Winnard DA, Hunt DTE (1991) Trace metal speciation in sediments and soils. In: Kramer JR, Allen HE (eds) Metal specia- tion theory, analysis, and application. Lewis Publishers, pp 261-294
Han BC, Chiou HI, Yeh CY, Hsu TJ (1991) The epidemiological study on environmental lead contamination near a battery recycling plant (I). Technical Report (EPA-80-F102-09-42), 102 p, Environmental Potection Administration, Taipei, Taiwan, ROC
Han BC, Chert RY, Yeh CY, Hsu TJ (1993) The epidemiological study on environmental lead contamination near a battery recycling plant (II). Technical Report (EPA-82-F102-09-42), 102 p, Environmental Protection Administration, Taipei, Taiwan, ROC
Han BC, Chen RY, Chiou HI, Yeh CY, Hsu TJ (1994a) Distribution of lead pollution in soil and air around a storage battery recycling plant. J Natl Public Health Assoc (ROC) 13:126-137
Hart BC, Jeng WL, Jeng MS, Hung TC (1994b) Copper intake and health threat by consuming seafood from copper contaminated coastal environments in Taiwan. Environ Toxicol Chem
13:775-780
Han BC, Chiou HI, Chen RY, Yeh CY, Hung TC (1992a) Speciation of lead pollution in water and sediments around a battery recycling plant. J Chin Environ Prot Soc 15:64-74
Han BC, Jeng WL, Hung TC (1992b) Assessment of copper complexing capacity in sediments. J Chin Inst Environ Eng 2:255-262 Huel G, Boudene C, Jouan M, Lazar P (1986) Assessment of exposure
to lead of the general population in the French community through biological monitoring. Int Arch Occup Environ Health 58:131-139 Jang CS (1989) Study of lead recycling factory's occupational and environmental disease (in Chinese). Master's Thesis, National Taiwan University, Department of Public Health, Taipei, Tai- wan, ROC
Jeng WL, Hart BC (1994) Sedimentary coprostanol in Kaohsiung Har- bour and the Tan-Shui estuary, Taiwan. Mar Pollut Bull 28:494-499 Mielke HW (1991) Lead in residential soils: Background and prelimi- nary results of New Orleans. Water Air Soil Pollut 57-58: I 11-119 - - . ( 1 9 9 2 ) Lead dust contaminated U.S.A. communities: Compari-
son of Louisiana and Minnesota. Appl Geochem 6:1-5 Needleman HL, Schell A, Bellinger D, Leviton A, Allred EN (1990)
The long-term effects of exposure to low doses of lead in childhood: An ll-year follow-up report. N Engl J Med 332:83-88 Quinn MJ, Delves HT (1987) UK blood lead monitoring programme
234 C.-Y. Yeh et al.
1984-1987: Protocol and result for 1984. Human Toxicol 6 : 4 5 9 4 7 4
Rabinowitz M, Wang JD, Soong WT (1991) Dentine lead and child intelligence in Taiwan. Arch Environ Health 46:351-360
- - (1992) Children's classroom behavior and lead in Taiwan. Bull Environ Contain Toxicol 48:282-288
Thornton I, Davies DJA, Watt JM, Quinn MJ (1990) Lead exposure in young children from dust and soil in the United Kingdom. Environ Health Persp 89:55-60
Wang JD, Jang CS, Hwang YH, Chen ZS (1992) Lead contamination around a kindergarten near a battery recycling plant. Bull Environ Contain Toxicol 49:23-30