Marine
Freshwater
Research
Marine and Freshwater Research
CSIRO Publishing
PO Box 1139 (150 Oxford St)
Collingwood, Vic. 3066, Australia
Telephone: +61 3 9662 7618
Fax: +61 3 9662 7611
Email: publishing.mfr@csiro.au
Published by CSIRO Publishing
for CSIRO and the Australian Academy of Science
w w w . p u b l i s h . c s i r o . a u / j o u r n a l s / m f r
All enquiries and manuscripts should be directed to:
Volume 53, 2002
© CSIRO 2002
A journal for the publication of original contributions
in physical oceanography, marine chemistry,
© CSIRO 2002 10.1071/MF01136 1323-1650/02/020419
Spatial and temporal variations of the estuarine larval fish community
on the west coast of Taiwan
Wann-Nian Tzeng, Yu-Tzu Wang, Chih-Wei Chang
Department of Zoology, College of Science, National Taiwan University, Taipei, Taiwan 106, ROC
email: wnt@ccms.ntu.edu.tw
MF01136 Variations in an estuarine larval fish community Wann-Nian Tzeng
etal.W.-N.TzengY.-T.Wang, C.-W.Chang
Abstract.
Spatio–temporal variations in the distribution and community structure of the estuarine larval fishes on
the west coast of Taiwan was examined in the estuaries of Shuangchi Creek (SC), Gongshytyan Creek (GST), Tatu
Creek (TT) and Tongkang River (TK). Fish were collected by a net (mesh 0.8–1.8 mm) set against the flood tide
at night during the new- and full-moon periods from September 1997 through December 1998; 28–49 families (56–94
species) were collected from the four estuaries. Fish larvae were abundant from spring to autumn. Fish communities
differed among estuaries: Mugilidae were the most abundant in SC, Terapon jarbua in GST, Stolephorus insularis
in TT and Ambassis urotaenia in TK. The 15 most dominant species constituted 88–94% of the total catch. The
relationship of fish abundance and species diversity to water temperature and salinity differed among estuaries.
Species composition could be classified into northern (SC, GST winter and TT winter) and southern (TK, GST
summer and TT summer) groups. The species composition of the larval fish communities was more diverse in
spring–autumn than in winter, and in southern than in northern estuaries. Monsoon-driven coastal currents may
influence seasonal dispersal and community structure of the estuarine larval fishes on the western coast of Taiwan.
Extra keywords: larval dispersal, community structure, seasonal variation, monsoon, coastal currents, estuary
Introduction
Estuaries are among the most productive ecosystems on the
earth, comparable to areas of coastal upwelling (Haedrich
and Hall 1976). They function as nursery grounds for
estuarine-dependent marine fish populations during their
early life stages because it provides food resources, shelter,
absence of turbulence, and a reduced risk of predation
(Wallace and van der Elst 1975; Blaber and Blaber 1980;
Day et al. 1981; Lenanton 1982; Robertson and Duke 1987;
Blaber and Milton 1990). The species composition and
abundance of fish larvae and juveniles in the estuary are
influenced by physico–chemical and biological factors and
are important indicators for predicting forthcoming fishing
stocks (Haines 1979; Blaber et al. 1985; Stephens et al.
1986, 1988; Tzeng and Wang 1993; Wang and Tzeng
1997).
Studies of the larval and juvenile fish communities in the
estuaries of Taiwan have been limited to specific areas where
environmental protection has been a concern, e.g. the
sewage-polluted Tanshui River estuary (Tzeng and Wang
1992, 1993, 1997) and Yenliao Bay near a nuclear power
plant under construction (Tzeng et al. 1985, 1997; Tzeng and
Wang 1986). Thus, large-scale spatio–temporal variations of
larval fish communities among estuaries in Taiwan are not
clear. This study investigated the larval fish community
structure in estuaries on the west coast of Taiwan with a view
to understanding the effect of coastal currents on the
dispersal of fish larvae and juveniles.
Materials and methods
Study area and sampling design
The coastal waters of western Taiwan comprise the Taiwan Strait, which has a wide and shallow continental shelf, suitable as a spawning and nursery area for coastal fishes. In contrast, the continental shelf on the eastern coast is narrow and strongly influenced by the oceanic Kuroshio Current (Fig. 1). The coastal currents on the western coast that transport larvae to estuaries change direction with the seasonal monsoon (Chu 1963). In winter, the China Coastal Current, induced by the eastern monsoon, flows from the coast of mainland China to the north-east and north-west coasts of Taiwan. In summer, this current is replaced by the south-western monsoon-driven coastal current, which flows from the South China Sea along the western coast of Taiwan.
A net was set against the tidal current in four estuaries, Shuangchi Creek (SC), Gongshytyan Creek (GST), Tatu Creek (TT) and Tongkang River (TK) (Fig. 1), to collect fish larvae and juveniles during the nighttime flood tide around the new- and full-moon periods from September 1997 to December 1998. The mesh size of the net ranged from 0.8 to 1.8 mm, similar to the commercial fishing gear used for collecting fish fry for restocking in Taiwan. The fish were preserved in
95% alcohol after collection and identified to species level when possible (Leis and Rennis 1983; Ozawa 1986; Wang 1987; Okiyama 1988; Leis and Trnski 1989). Surface water temperature and salinity were measured to 0.1°C and 0.1 psu by use of a microprocessor conductivity meter during sampling.
Data analysis
The abundance of fish larvae and juveniles was estimated roughly by the number of fish per hour (CPUE). The cumulative abundance of dominant species among the four estuaries was compared by K-dominance curves. When two different K-dominance curves do not overlap, the upper curve represents the community most dominated by a few species and thus that which is less diverse (Lambshead et al. 1983; Clarke and Warwick 1994). The species diversity of each larval fish community was calculated by use of the Shannon–Wiener index of species diversity (H′) (Pielou 1966) and Simpson’s index of species concentration (Σpi2) (Peet 1974). The
Shannon–Wiener index emphasizes the contribution of rare species, whereas Simpson’s index gives greater weight to dominant species. The similarity of species compositions of fish larvae and juveniles in the four estuaries among sampling dates was analysed by clustering (Bray–Curtis similarity index; unweighted pair-group using arithmetic average) and ordination (multiple dimensional scaling, MDS). Indicator species for each of the seasonal and geographic groups and the species that discriminated groups were examined by the similarity percentage routine (SIMPER; Clarke and Warwick 1994). The data used for clustering and ordination were log (n+1) transformed and selected to span one year from December 1997 through November 1998 because the period investigated differed among estuaries. All computation of diversity indices and cluster and ordination analyses used the software ‘PRIMER 5’ (Clarke and Warwick 1994). Relationships between abiotic and biotic factors of the four estuaries were analysed by Kendall rank correlations (Siegel 1956).
Results
Water temperature and salinity
Trends in water temperature were similar among the GST, SC
and TT estuaries, but there was much less seasonal variation
in the TK estuary where winter water temperatures did not
decline to the same degree as those in the other systems. The
water temperatures in the four estuaries ranged from 14.0 to
33.0°C. Annual mean (± s.d.) water temperatures increased
from 23.2±3.9°C in SC in the north to 29.1±2.5°C in TK in
the south (Fig. 2a). Salinities in the four estuaries varied from
0.3 to 36.5 psu; the annual mean (± s.d.) salinity ranged from
17.5±10.3 in TT to 29.6±7.2 in TK (Fig. 2b). A geographic
cline in mean salinity was not obvious among estuaries;
however, the maximum value of the range was higher in both
SC and TK than in either GST or TT, because SC and TK were
influenced to a greater degree by the highly saline Kuroshio
Current than were GST and TT (Fig. 1).
Seasonal changes in number of species, abundance and
indices of community structure
In total, 30, 33, 26 and 26 samples were collected from the
SC, GST, TT and TK estuaries, respectively: 28 families and
56 species from SC, 49 families and 94 species from GST, 44
families and 73 species from TT and 46 families and 77
species from TK. The dominant species differed among
estuaries. Mugilidae were the most abundant in SC, Terapon
jarbua in GST, Stolephorus insularis in TT and Ambassis
urotaenia in TK (Appendix 1).
The number of species increased from spring to autumn
(April to September) in GST estuary, but no seasonal trend
was apparent in the other three (Fig. 2c). Marked seasonal
variation in abundance (CPUE) was noted in all four estuaries.
Two periods of peak abundance occurred in the northern
estuaries (SC and GST), one in the spring (March–June) and
the other in the autumn (September), but the autumn peak did
not occur in the southern estuaries (TT and TK). The peak
abundance in spring occurred earlier in the south than in the
north (Fig. 2d). Species diversity (H′, 0.2–2.7) and
concentration indices (Σp
i2
, 0.1–1.0) of the larval fish
community greatly fluctuated with season and were inversely
correlated (Figs 2e, 2f). This indicates that the larval fish
community became uneven when dominant species occurred.
Fish abundance was significantly positively correlated to the
number of species except in SC, and was positively correlated
with Σp
i2
only in TK (Table 1).
The effect of temperature and salinity on the number of
species, abundance and community indices differed among
estuaries (Table 1). In SC, there was no significant correlation
of the four biotic factors with temperature or salinity. However
in GST, number of species, abundance and species diversity
(H′) were positively correlated with temperature (P <0.05),
but not with salinity. In TT, the species diversity (H′) and
concentration indices (Σp
i2
) were correlated with salinity
Fig. 1. Sampling sites of fish larvae and juveniles in the estuaries of Shuangchi Creek (SC), Gongshytyan Creek (GST), Tatu Creek (TT) and Tongkang River (TK). Dashed line: 200 m depth contour.
(positively and negatively, respectively; P <0.05). In TK, only
abundance was positively correlated with temperature
(P <0.05). This may be due to different geomorphology and
hydrodynamics among estuaries.
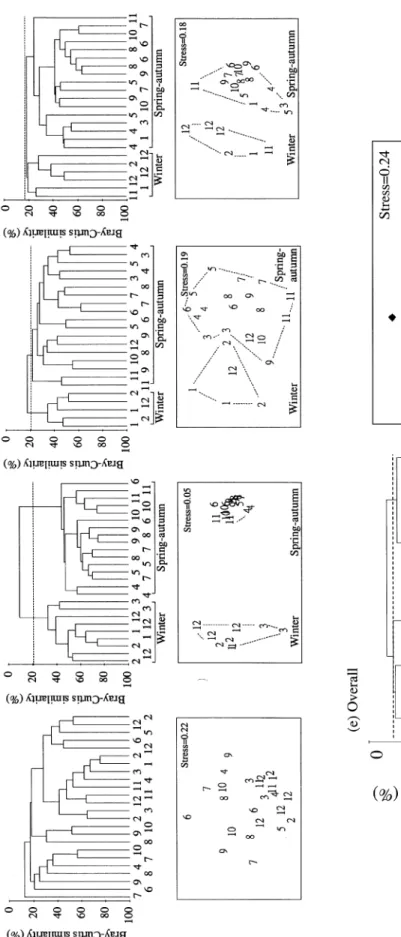
Spatio–temporal similarity of species composition
Cluster and ordination analyses indicated that the species
composition of all estuaries except SC comprised two
seasonal groups at a similarity level of ~20% (Figs 3a–d).
These two seasonal groups were a spring–autumn group
(April–November) and a winter group (December–March).
When the species data from the four estuaries were pooled
together and analysed, the winter groups of both GST and
TT clustered with SC into a northern group, while the
summer groups of both GST and TT were more similar to
TK samples and formed a southern group at a similarity
level of ~10–15% (Fig. 3e). This indicates that the
summer larval fish communities of GST and TT, as well as
that of TK throughout the year, may originate from
southern Taiwan, whereas the winter fish communities of
GST and TT, together with that of SC, derive from
northern Taiwan.
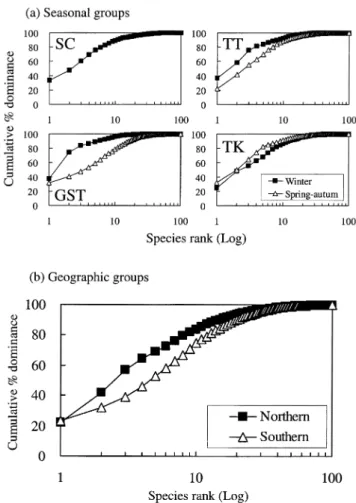
K-dominance curves showed higher cumulative
percentage abundance in winter than in spring–autumn for
both GST and TT estuaries, indicating that the communities
of winter groups were less diverse than spring–autumn
groups and were characterized by few dominant species
(Fig. 4a). Similarly, the northern group was characterized by
fewer dominant species (Fig. 4b).
Similarity percentage of species contribution to clustering
Species contributing to the similarities within seasonal
groups shown in Figs 3a-d and to the southern and northern
groups in Fig. 3e are listed in Tables 2 and 3. The larval
Fig. 2. Seasonal changes in (a) temperature, (b) salinity, (c) number of species, (d) abundance, (e) index of species diversity and (f) index of species concentration in the four estuaries (SC, GST, TT and TK refer to Fig. 1).
fish community of the SC estuary and the winter
assemblages of the GST and TT estuaries were dominated
by few species. The average percentage contribution of
only five species in these groups ranged from 81.3% to
94.0%. Mugilidae spp. and Mugil cephalus were the most
important, contributing 33.4–36.8% of total average
similarity (Table 2). In contrast, the communities of the TK
estuary together with the spring–autumn groups of GST and
TT were more diverse and the average similarity
contributed by the five most important species ranged from
38.3% to 70.1% (Table 2).
Similarly, the larval fish community was more diverse in
the southern than in the northern groups (Table 3). The
average similarity of the top 10 species in the northern group
was 89.7%. Mugilidae spp., Mugil cephalus and Sicyopterus
japonicus were the most important taxa contributing to this
group similarity (67.2%). In the southern group ten species
made relatively even contributions to account for only 63.1%
of the group similarity. Species accounting for the
dissimilarity between these two groups are also listed in
Table 3 and comprised many minor species because the sum
of the average dissimilarity for the top 10 species was only
37.8% (Table 3).
Discussion
An estuary is a semi-enclosed system influenced by both
fresh water and seawater, and freshwater, estuarine and
marine fishes might be expected in such a system (Blaber
and Blaber 1980; Day et al. 1981). However, most larval
fishes collected in this study were estuarine-dependent
marine fishes (e.g. Mugilidae spp., Mugil cephalus and
Terapon jarbua) and estuarine fishes (e.g. Gobiidae spp. and
Ambassis spp.). Few freshwater fishes (e.g. Cyprinidae)
were caught (Tables 2 and 3; Appendix 1). This is because
we collected fishes on flood tides that transported the marine
fishes to the estuaries. The dispersal of larval fishes from
marine spawning grounds to the estuaries is influenced by
coastal currents (Boehlert and Mundy 1988). The coastal
currents on the west coast of Taiwan change direction with
season (Chu 1963). Thus the recruitment of larval fishes to
the estuary will be influenced in spatial and temporal terms
by these coastal currents.
Larval fish communities in three of the four estuaries
were classified into winter and spring–autumn seasonal
groups, which reflected the change of seasonally
monsoon-driven coastal currents on the western coast of Taiwan (Chu
1963). In winter, the north-eastern monsoon-driven,
low-salinity, cold China Coastal Current flows southward and is
impeded by the warm Kuroshio Current in the middle of the
Taiwan Strait. In summer, the south-western
monsoon-driven, high salinity, warm South China Sea surface current
flows through the Taiwan Strait (Jan 1995; Shao et al. 1997).
Most of the larvae in the four estuaries were
estuarine-dependent marine fishes (Wallace and van der Elst 1975;
Blaber and Blaber 1980). In general, larvae of these fishes
passively migrate with the coastal currents from spawning
grounds to estuaries (Boehlert and Mundy 1988). Thus, the
monsoon-driven coastal current on the west coast of Taiwan
may play an important role in the seasonal onshore
movement of fish larvae and juveniles.
The fish communities of the SC estuary and the winter
assemblages of both the GST and TT estuaries clustered
together into a similar group, which was distinct from that
of the TK estuary and the summer assemblages of the GST
and TT estuaries. This suggests that the winter larval fish
community transported from the north by the NE
monsoon-driven China Coastal Current is distributed only as far as
the middle part of the Taiwan Strait. In contrast, the
summer larval fish community transported by the SW
monsoon current from the south reaches the northern part
of the Taiwan Strait. Shao et al. (1997) noted that the fish
fauna differed with latitude on the west coast of Taiwan
under the influence of the seasonal monsoons, and that the
boundary separating northern and southern fish faunas may
be located approximately at Penghu Island in the middle of
Taiwan Strait. Kuo et al. (1999) found that mangrove fish
assemblages on the west coast could be classified into
Table 1. Relationship between abiotic and biotic factors of four estuaries
SC, GST, TT and TK refer to Fig. 1. Temp, temperature; Sal, salinity; Sp, number of species; Ab, abundance; H′, index of species diversity;
Σpi
2, index of species concentration
Temp Sal Sp Ab H′ SC Sal 0.42* Sp –0.03 –0.26 Ab –0.21 0.12 0.18 H′ 0.26 –0.12 0.66*** –0.14 Σpi 2 –0.32 0.08 –0.53*** 0.25 –0.86*** GST Sal 0.16 Sp 0.77*** 0.08 Ab 0.62*** 0.22 0.59*** H′ 0.27* –0.05 0.31* 0.07 Σ pi2 –0.17 0.09 –0.22 –0.04 –0.84*** TT Sal –0.26 Sp 0.12 0.08 Ab 0.25 –0.12 0.47*** H′ 0.03 0.35* 0.39** –0.05 Σ pi2 –0.07 –0.34* –0.27 0.11 –0.85*** TK Sal –0.03 Sp 0.26 0.02 Ab 0.36* 0.04 0.49*** H′ –0.17 0.17 –0.03 –0.41** Σ pi2 0.17 –0.10 0.07 0.40** –0.83***
Fig . 3. C lu st e r de nd ro g ra m s (upp er ) an d MD S or di na ti o n s (l o w er ), ba se d o n Br ay – Cu rtis simi la rit ie s o f la rv al a n d ju v en ile f ish c o mmu n it ie s sa mp le d in (a ) SC , (b ) GS T , (c ) TT , (d ) TK a nd (e ) o v er al l d a ta of a-d. N u m e ra ls 1 – 12 i n d ic at e t h e o rd er o f t h e m ont hs fr om J an u ar y t o D e ce m b e r. w : w int e r, s-a: sp ri ng -a ut um n .
northern and southern groups, which probably arise as a
result of the oceanic currents around Taiwan. This study
indicated that the spatial distribution of the larval fish
community on the west coast of Taiwan changed seasonally.
In the summer, the SW monsoon current transported fish
larvae through the Taiwan Strait. In winter, the dispersal of
larvae transported by the NE monsoon current was impeded
in the middle of the Taiwan Strait by the Kuroshio Current.
The communities of the four estuaries exhibited high
spatial and temporal variations in species diversity. Fish
communities of spring–autumn groups originating in the
south were more diverse than were the winter groups from the
north. Pianka (1966, 1967) proposed that species diversity
was influenced by eight principal factors, i.e. evolutionary
time, ecological time, climatic stability, spatial heterogeneity,
productivity, stability of primary production, competition
and predation. Estuaries are highly variable and unstable
environments (Whitfield 1990), and fish communities living
in such habitats theoretically should reach an equilibrium
state and contain fewer species when interspecific
competition is prevalent (Sanders 1968; de Morais and de
Morais 1994; Harris and Cyrus 2000). The salinities of the
four estuaries fluctuated greatly, with a range of 0.3–36.5 psu.
Highly variable salinities may influence species diversity and
led to dominance of estuarine larval fish communities by a
few species. In addition, the water mass of the coastal current
from the north was more productive than that from the south.
This may lead to the fish communities originating from the
northern group being less diverse and dominated by fewer
species than fish communities originating from the south.
Furthermore, the differences in species composition among
Fig. 4. K-dominance curves for the numbers of species of fish larvae and juveniles of (a) seasonal groups [except SC, which represents all data] and (b) geographic groups (SC, GST, TT and TK refer to Fig. 1).
Table 2. Average similarity percentage contributed by the major species in the seasonal groups of four estuaries
SC, GST, TT and TK refer to Fig. 1
Rank SC % GST % TT % TK %
Whole year Winter group Winter group Winter group
1 Mugilidae spp.A 33.4 Mugil cephalus 34.3 Mugilidae spp.A 36.8 Acanthopagrus schlegeli 16.5
2 Sicyopterus japonicus 18.5 Anguilla japonica 21.3 Sardinella spp. 19.7 Ambassis urotaenia 16.3
3 Ambassis gymnocephalus 14.0 Acanthopagrus latus 17.2 Acanthopagrus spp. 18.0 Mugilidae spp.A 11.1
4 Mugil cephalus 10.6 Mugilidae spp.A 10.2 Acanthopagrus latus 17.0 Gobiidae spp. 10.6
5 Leiognathus nuchalis 4.8 Anguilla marmorata 2.9 Stolephorus insularis 2.5 Omobranshus spp. 8.6
6 Other (51 species) 18.7 Other (27 species) 14.1 Other (24 species) 6.0 Other (39 species) 37.0
Spring–autumn group
Spring–autumn group
Spring–autumn group
1 Terapon jarbua 11.0 Stolephorus insularis 38.8 Gobiidae sp.7 15.7
2 Gobiidae sp.9 7.9 Sillago sihama 9.2 Taenioides cirratus 12.8
3 Gobiidae sp.7 7.5 Gobiidae spp. 7.6 Megalops cyprinoides 8.6
4 Megalops cyprinoides 6.5 Ambassis
gymnocephalus
7.2 Gobiidae spp. 7.7
5 Rhinogobius giurinus 5.4 Mugilidae spp. A 7.2 Rhinogobius giurinus 6.3
6 Other (91 species) 61.7 Other (61 species) 29.9 Other (67 species) 48.8
the four estuaries were not only due to the influence of these
two current systems on the recruitment of larval marine
fishes. Spatial heterogeneity within the estuaries that
provided a diversity of habitat for the estuarine fish species
probably also played a role.
Acknowledgments
The study was financially supported by the Council of
Agriculture (87-AST–1.4-FID–05(09), 88-AST–1.4-FID–
05(18) and 89-AST–1.2-FID–02(06)) and National Science
Council (M–002–006 and
NSC89–2611-M–002–039) of the Republic of China. The authors are
grateful to Messrs C. S. Jean, C. S. Lu, C. S. Chen and
C. L. Chen for collection of specimens, Mrs H. Y. Teng for
specimen sorting, and Mr Brian Jessop for helpful
comments.
References
Blaber, S. J. M., and Blaber, T. G. (1980). Factors affecting the distribution of juvenile estuarine and inshore fish. Journal of Fish
Biology 17, 143–62.
Blaber, S. J. M., and Milton, D. A. (1990). Species composition, community structure and zoogeography of fishes of mangrove estuaries in the Solomon Islands. Marine Biology 105, 259–67. Blaber, S. J. M., Young, J. W., and Dunning, M. C. (1985). Community
structure and zoogeographic affinities of the coastal fishes of the Dampier region of north-western Australia. Australian Journal of
Marine Freshwater Research 36, 247–66.
Boehlert, G. W., and Mundy, B. C. (1988). Roles of behavioral and physical factors in larval and juvenile fish recruitment to estuarine nursery areas. American Fisheries Society Symposium 3, 51–67. Chu, T. Y. (1963). The oceanography of the surrounding waters of
Taiwan. Report of the Institute of Fishery Biology of Ministry of
Economic Affairs and National Taiwan University 1, 29–44.
Clarke, K. R., and Warwick, R. M. (1994). ‘Change in Marine Communities: an approach to statistical analysis and interpretation.’ (National Environment Research Council: Plymouth.)
Day, J. H., Blaber, S. J. M., and Wallace, J. H. (1981). Estuarine fishes. In ‘Estuarine Ecology with Particular Reference to Southern Africa’. (Ed. J. H. Day.) pp. 197–221. (A. A. Balkema: Rotterdam.)
de Morais, T. A., and de Morais, L. (1994). The abundance and diversity of larval and juvenile fish in a tropical estuary. Estuaries
17, 216–25.
Haedrich, R. L., and Hall, C. A. S. (1976). Fishes and estuaries.
Oceanus 19, 55–63.
Haines, E. B. (1979). Interactions between Georgia salt marshes and coastal waters: a changing paradigm. In ‘Ecological Processes in Coastal and Marine Systems’. (Ed. R. J. Livingston.) pp. 35–46. (Plenum Press: New York.)
Harris, S. A., and Cyrus, D. P. (2000). Comparison of larval fish assemblages in three large estuarine systems, KwaZulu-Natal, South Africa. Marine Biology 137, 527–41.
Jan, S. (1995). Seasonal variation of current in Taiwan Strait. PhD Thesis, University of Taiwan, ROC.
Kuo, S. R., Lin, H. J., and Shao, K. T. (1999). Fish assemblages in the mangrove creeks of northern and southern Taiwan. Estuaries 22, 1004–15.
Lambshead, P. J. D., Platt, H. M., and Shaw, K. M. (1983). The detection of differences among assemblages of marine benthic species based on an assessment of dominance and diversity. Journal of Natural
History 17, 859–74.
Leis, J. M., and Rennis, D. S. (1983). ‘The Larvae of Indo–Pacific Coral Reef Fishes.’ (New South Wales University Press: Kensington, Australia.)
Leis, J. M., and Trnski, T. (1989). ‘The Larvae of Indo–Pacific Shorefishes.’ (Hawaii University Press: Honolulu.)
Lenanton, T. C. J. (1982). Alternative non-estuarine nursery habitats for some commercially and recreationally important fish species of south-western Australia. Australian Journal of Marine Freshwater
Research 33, 881–900.
Okiyama, M. (Ed.). (1988). ‘An Atlas of the Early Stage Fishes in Japan.’ (Tokai University Press: Tokyo.)
Ozawa, T. (1986). ‘Studies on the Oceanic Ichthyoplankton in the Western North Pacific.’ (Kyushu University Press: Fukuoka, Japan.)
Peet, R. K. (1974). The measurement of species diversity. Annual
Review of Ecology and Systematics 5, 285–307.
Pianka, E. R. (1966). Latitudinal gradients in species diversity: a review of concept. American Naturist 100, 33–46.
Pianka, E. R. (1967). On lizard diversity: North American flatland deserts. Ecology 48, 333–51.
Pielou, E. C. (1966). The measurement of diversity in different types of biological collections. Journal of Theoretical Biology 13, 131–44.
Table 3. Average similarity and dissimilarity percentages contributed by the major species within and between groups
Rank Northern group % Southern group % Between groups %
1 Mugilidae spp.A 38.4 Gobiidae spp. 9.7 Megalops cyprinoides 4.5
2 Mugil cephalus 16.9 Megalops cyprinoides 8.2 Stolephorus insularis 4.2
3 Sicyopterus japonicus 11.9 Gobiidae sp. 7. 7.5 Gobiidae spp. 4.0
4 Ambassis gymnocephalus 6.1 Rhinogobius giurinus 6.7 Gobiidae sp. 7. 3.9
5 Acanthopagrus latus 4.8 Terapon jarbua 6.3 Rhinogobius giurinus 3.9
6 Anguilla marmorata 3.1 Taenioides cirratus 5.4 Taenioides cirratus 3.7
7 Sillago sihama 2.4 Mugilidae spp.A 5.2 Terapon jarbua 3.7
8 Anguilla japonica 2.2 Stolephorus insularis 5.1 Mugilidae spp.A 3.6
9 Leiognathus nuchalis 1.9 Ambassis gymnocephalus 4.5 Ambassis gymnocephalus 3.2
10 Terapon jarbua 1.9 Sillago sihama 4.5 Mugil cephalus 2.9
11 Other (74 species) 10.3 Other (107 species) 36.9 Other (121 species) 62.2
Robertson, A. L., and Duke, N. C. (1987). Mangroves as nursery sites: comparisons of the abundance and species composition of fish and crustaceans in mangroves and other nearshore habitats in tropical Australia. Marine Biology 96, 193–205.
Sanders, H. L. (1968). Marine benthic diversity: a comparative study.
American Naturalist 102, 243–82.
Shao, K. T., Chen, J. P., and Wang, S. C. (1997). Biogeography and database of marine fishes in Taiwan waters. In ‘Proceedings of the 5th Indo–Pacific Fish Conference, Nouméa, 3–8 November 1997’. (Eds B. Séret and J.-Y. Sire.) pp. 673–80. (Société Française d’Icthyologie/Insitut de Recherche pour le Développement: Paris.) Siegel, S. (1956). ‘Nonparametric Statistics for the Behavioral
Sciences.’ (McGraw–Hill: New York.)
Stephens, J. E., Jordan, P. A., Morris, P. A., Singer, M., and Mcgowen, G. (1986). Can we relate larval fish abundance to recruitment or population stability? A preliminary analysis of recruitment to a temperate rocky reef. CALCOFI Report 27, 65–83.
Stephens, J. E., Hose, J. E., and Singer, M. (1988). Fish assemblages as indicators of environmental change in nearshore environments. In ‘Marine Organisms as Indicators’. (Eds D. F. Soule and G. S. Kleppel.) pp. 91–105. (Springer: New York.)
Tzeng, W. N., and Wang, Y. T. (1986). Seasonal occurrence, abundance and diversity of larval fishes in the Shuang-chi River estuary, northeastern Taiwan. In ‘Proceedings of the Symposium on Marine Biology Science’. (Eds H. K. Mok and H. Y. Chen.) pp. 155–63. (Biology Research Centre, National Science Council: Taipei.) Tzeng, W. N., and Wang, Y. T. (1992). Structure, composition and
seasonal dynamics of the larval and juvenile fish community in the mangrove estuary of Tanshui River, Taiwan. Marine Biology 113, 481–90.
Tzeng, W. N., and Wang, Y. T. (1993). Hydrography and distribution dynamics of larval and juvenile fishes in the coastal waters of the Tanshui River estuary, Taiwan, with reference to estuarine larval transport. Marine Biology 116, 205–17.
Tzeng, W. N., and Wang, Y. T. (1997). Movement of fish larvae with tidal flux in the Tanshui River estuary, northern Taiwan. Zoological
Studies 36, 178–85.
Tzeng, W. N., Wang, Y. T., Chen, T. T., and Yu, S. Y. (1985). Investigations of fish larvae and juveniles in the estuaries of northern Taiwan (1982–1983). COA Fisheries Series No. 2. (Taipei, ROC.)
Tzeng, W. N., Wang, Y. T., and Chern, Y. T. (1997). Species composition and distribution of fish larvae in Yenliao Bay, northeastern Taiwan. Zoological Studies 36, 146–58.
Wallace, J. H., and van der Elst, R. P. (1975). The estuarine fishes of the east coast of South Africa. Oceanographic Research Institute Investigation Report No. 42. (Durban, South Africa.)
Wang, Y. T. (1987). Studies on the eggs, larvae and juveniles of fishes in the estuaries of Tanshui and Shuangchi rivers, northern Taiwan. MSc Thesis, University of Chinese Culture, ROC.
Wang, Y. T., and Tzeng, W. N. (1997). Temporal succession and spatial segregation of clupeoid larvae in the coastal waters off the Tanshui River Estuary, northern Taiwan. Marine Biology 129, 23–32. Whitfield, A. K. (1990). Life-history styles of fishes in South African
estuaries. Environmental Biology of Fishes 28, 295–308.
Manuscript received 21 May 2001; revised 10 December 2001; accepted 9 February 2002
Appendix 1. Species composition, developmental stage and geographic distribution of four estuaries from December 1997 through November 1998
SC, GST, TT and TK refer to Fig. 1. Le, Leptocephalus larva; Pr, preflexion larva; Fl, flexion larva; Ge, glass eel; Po, postflexion larva; Ju, juvenile; Yo, young; Te, temperate; Tr, tropic; W, world wide. *dominant stages; –, not caught
Family and species Stage No. of fish Geog.
SC GST TT TK DASYATIDAE Dasyatis akajei Yo – 1 – – Te ELOPIDAE Elops hawaiensis Le – 217 63 337 Tr MEGALOPIDAE Megalops cyprinoides Le – 6526 1107 5988 Tr ALBULIDAE Albula vulpes Le – – – 1 Tr ANGUILLIDAE
Anguilla bicolor pacifica Ge 7 36 – 32 Tr
Anguilla celebesensis Ge – 4 – – Tr
Anguilla japonica Ge 2 204 – 5 Te
Anguilla marmorata Ge*, Yo 87 240 – 76 Tr
MURAENIDAE spp. Le, Ge* – 2 – 2
OPHICHTHYIDAE spp. Le, Ge*, Yo – 7 1 80
NETTASTOMATIDAE sp. Le – – 1 –
CONGRIDAE
Conger myriaster Yo 1 – – – Te
Congridae spp. Le – 1 1 –
CLUPEIDAE
Sardinella spp. Pr, Fl, Po*, Ju, Yo 12 33 814 4 Tr
Ilisha melastoma Pr, Fl, Po*, Ju, Yo – – 211 – Tr
ENGRAULIDAE
Encrasicholina heteroloba Ju – 1 – 2 Tr
Encrasicholina punctifer Ju*, Yo – 19 14 – Tr
Engraulis japonicus Fl, Po, Ju*, Yo,
Ad
8 2 81 1 Te
Stolephorus insularis Fl, Po, Ju*, Yo 10 57 1858 13 Tr
Thryssa chefuensis Fl, Po, Ju*, Yo – 57 643 70 Tr
CHANIDAE
Chanos chanos Po*, Ju, Yo 13 168 9 158 Tr
CYPRINIDAE Carassius auratus Yo – 3 – – Te Paracheilognathus himantegus Yo 1 – – – Te Zacco platypus Yo 6 – – – Te ARIIDAE Arius sp. Yo – – 2 – Tr PLOTOSIDAE Plotosus lineatus Yo – 1 – – Tr SYNODONTIDAE Saurida gracilis Ju 1 – – – Tr Saurida wanieso Ju – – 1 – Tr
Trachinocephalus myops Fl, Po, Ju* – 1 6 – Tr
Synodontidae spp. Po, Ju* – 1 – 2
PARALEPIDIDAE spp. Po, Ju* – 3 1 –
MYCTOPHIDAE
Benthosema pterotum Fl, Po*, Ju*, Yo – – 13 2 W
Myctophidae sp. Fl – – 1 –
BREGMACEROTIDAE
Bregmaceros neonectabanus Ju*, Yo – 1 1 1 Tr
EXOCOETIDAE sp. Yo – – – 1 Tr
BELONIDAE
Strongylura anastomella Yo – 1 – – Te
Appendix 1. (continued)
Family and species Stage No. of fish Geog.
SC GST TT TK
HEMIRAMPHIDAE sp. Ju – – 1 – Tr
POECILIIDAE
Gambusia affinis Ju, Yo* – 49 2 1 Tr
ATHERINIDAE
Atherinomorus lacunosus Yo 1 – – – Tr
Atherion elymus Yo 2 – – – Tr
Hypotherina valenciennei Yo 5 – – – Tr
Hypotherina woodwardi Yo 4 – – – Tr
Atherinidae spp. Po, Ju, Yo* 3 – 1 1
PEGASIDAE sp. Ju – – – 1 Tr SYNGNATHIDAE Hippichthys spicifer Yo 1 9 – – Syngnathidae spp. Yo – – 3 13 SCORPAENIDAE Sebastiscus marmoratus Pr*, Yo – – 1 – Te Scorpaenidae spp. Pr*, Po, Ju – 2 1 31 PLATYCEPHALIDAE spp. Ju*, Yo – 104 8 44 Tr CENTROPOMIDAE
Ambassis gymnocephalus Po*, Ju, Yo 186 2482 530 24 Tr
Ambassis urotaenia Po, Ju*, Yo – – 46 11130 Tr
PERICHTHYIDAE
Lateolabrax japonicus Fl, Ju*, Yo – – 6 – Te
SERRANIDAE spp. Ju – 15 – 30
TERAPONIDAE
Pelates quadrilineatus Yo – 1 – – Tr
Terapon jarbua Po, Ju*, Yo 102 35770 19 723 Tr
KUHLIIDAE
Kuhlia marginata Pr, Fl, Po, Ju*, Yo 12 83 334 5086 Tr
PRIACANTHIDAE
Priacanthus sp. Fl 1 – – – Tr
APOGONIDAE
Apogon spp. Po, Ju* – 25 – 11 Tr
SILLAGINIDAE
Sillago japonica Fl, Po, Ju*, Yo 1 216 60 99 Te
Sillago maculata Po, Ju*, Yo 4 655 31 – Tr
Sillago sihama Po, Ju*, Yo 64 6738 74 67 Tr
Sillaginidae spp. Ju, Yo* – 15 – 31
CARANGIDAE
Caranx lugubris Yo 41 21 – – Tr
Caranx sexfasciatus Yo 12 7 – – Tr
Scomberoides tol Ju*, Yo 7 55 – 12 Tr
Selar crumenophthalmus Po – – 1 – Tr
Trachinotus baillonii Yo – – – 1 Tr
Carangidae spp. Po, Ju*, Yo 5 3 2 13
LEIOGNATHIDAE
Gazza minuta Yo 12 5 – 1 Tr
Leiognathus elongatus Yo – – – – Te
Leiognathus nuchalis Po, Ju*, Yo 30 353 24 12 Tr
Secutor ruconius Yo 1 7 21 13 Tr
Leiognathidae spp. Pr, Fl, Po, Ju, Yo* 1 52 20 229
LUTJANIDAE
Lutjanus argentimaculata Po, Ju* 1 143 – 1 Tr
Lutjanus fulviflamma Ju – 4 – – Tr
Lutjanus russellii Ju*, Yo – 62 – – Tr
Lutjanus vita Ju – 49 – 26
Appendix 1. (continued)
Family and species Stage No. of fish Geog.
SC GST TT TK
GERREIDAE
Gerreomorpha japonica Po, Ju*, Yo 5 1508 – 8 Te
Gerres abbreviatus Po, Ju*, Yo 241 2040 1 8 Tr
Gerres filamentosus Ju*, Yo 89 1624 1 13 Tr
Gerres macrosoma Ju*, Yo 37 9284 173 108 Tr
HAEMULIDAE
Hapalogeny nitens Yo 2 – – – Te
Plectorhynchus sp. Ju – – – 1
Pomadasys spp. Pr, Fl, Po, Ju*, Yo 6 228 9 31
SPARIDAE
Acanthopagrus latus Po, Ju*, Yo 6 811 38 – Tr
Acanthopagrus schlegeli Fl, Po, Ju*, Yo – 281 125 240 Te
Acanthopagrus australis Pr, Po, Ju*, Yo – 4 95 1
SCIAENIDAE spp. Pr, Po*, Ju – 8 1 2
MULLIDAE sp. Ju – – – 1
SCATOPHAGIDAE
Scatophagus argus Ju*, Yo – 158 9 37 Tr
CICHLIDAE spp. Ju*, Yo 1 22 29 6 MUGILIDAE Mugil cephalus Yo 408 904 1 57 Te Mugilidae spp.A Yo 937 10006 405 493 Tr SPHYRAENIDAE Sphyraena barracuda Yo – – 1 – Sphyraenidae spp. Ju*, Yo 1 4 4 3 Tr POLYNEMIDAE Polydactylus plebeius Yo 2 – – – Tr LABRIDAE spp. Po*, Ju 5 72 – 10 Tr SCARIDAE spp. Po*, Ju – 47 1 5 Tr PERCOPHIDAE sp. Po 1 – – – BLENNIIDAE
Omobranchus spp. Po, Ju* 1 6 14 294
CALLIONYMIDAE spp. Pr, Po, Ju*, Yo – 1 13 3
GOBIIDAE
Apocryptodon madurensis Ju – – 40 –
Bathygobius fuscus Po*, Ju, Yo 15 2723 – 4 Tr
Eleotris acanthopoma Po*, Ju, Yo 3 1334 – 477 Tr
Favonigobius reichei Ju, Yo* 4 16 – –
Glossogobius biocellatus Po*, Ju, Yo – 140 – –
Mugilogobius tagala Yo – 3 – –
Periophthalmus cantonensis Yo – 1 – –
Rhinogobius brunneus Po*, Ju, Yo 6 595 55 38 Te
Rhinogobius giurinus Fl, Po*, Ju, Yo 9 5704 1644 3226 Te
Scartelaos viridis Ju – 56 10 –
Sicyopterus japonicus Po, Ju* 367 1157 – 89 Te
Taenioides cirratus Po*, Ju 1 4205 3 2755 Tr
Gobiidae sp. 1 Po*, Ju, Yo – 3119 12 122
Gobiidae sp. 2 Po, Ju*, Yo – 312 – –
Gobiidae sp. 3 Po*, Ju, Yo – – – 230
Gobiidae sp. 4 Po, Ju* – 5773 3 892
Gobiidae sp. 5 Po*, Ju, Yo – 3376 4 367
Gobiidae sp. 6 Po, Ju* – 6 – –
Gobiidae sp. 7 Po, Ju*, Yo – 804 – –
Gobiidae spp. Pr, Fl, Po, Ju*, Yo 37 1956 113 527
GOBIESOCIDAE sp. Po – – 1 –
SIGANIDAE
Siganus fuscescens Ju – 28 1 43 Te
http://www.publish.csiro.au/journals/mfr
Appendix 1. (continued)
Family and species Stage No. of fish Geog.
SC GST TT TK
TRICHIURIDAE
Trichiurus lepturus Po, Yo* – 3 3 – W
BOTHIDAE spp. Po, Ju*, Yo – 350 1 213
PLEURONECTIDAE spp. Ju – 123 1 –
CYNOGLOSSIDAE spp. Pr, Ju*, Yo – 1 2 52
MONACANTHIDAE spp. Po, Ju*, Yo – 4 1 –
TETRAODONTIDAE spp. Ju*, Yo – 26 11 27
DIODONTIDAE spp. Yo – 6 – 14
Total (fish) 2828 113340 8838 34772
Total (family) 28 49 44 46
Total (species) 56 94 73 77