SLUDGE DEWATERING BY ELECTROKINETIC TECHNIQUE:
EFFECT OF PROCESSING TIME AND POTENTIAL GRADIENT
Ching Yuan, Chih-Huang Weng
Department of Civil Engineering, I-Shou University,
1, Hsueh-Cheng Rd. Sec.1, Ta-Hsu Hsiang, Kaohsiung, 840, Taiwan TEL: 886-7-6577711 ext 3314; FAX: 886-7-6577461
E-mail: [email protected] ABSTRACT
A sludge cake (87.8% of moisture content) right after belt press treatment from an wastewater treatment plant was used to investigate the effect of processing time and potential gradient on the water removal by electrokinetic process. The potential gradient ranging from 2.5 to 5.0 V/cm were applied to induce the movement of bound water within the sludge specimen elapsed for 4 ~ 41 hours. Results showed that the direction of electroosmosis flow was from the anode to cathode. Due to the release of H+ and OH- through electrolysis of water, the sludge pH was maintained at 2.4 ~ 6.6 near the anode side and 8.7 ~ 10.7 near the cathode for all cases. As applied potential gradient of 5.0 V/cm for 41 hours, the moisture content of sludge decreases further to 62.6%. The EO permeability and the power consumption throughout the test period are around 0.24 ~ 1.38 10-5 cm2/V-s and 11.5 ~ 249.7 kwh/m3, respectively. It is concluded that increasing either the potential gradient or the processing time would enhance the sludge dewatering efficiency. This study displays that the electrokinetic process is an effective method for sludge dewatering.
KEYWORDS
dewatering, electrokinetic process, potential gradient, processing time, sludge
INTRODUCTION
Sludge dewatering can accomplished by freeze-thaw, centrifuge force, mechanical press and sun-drying. The freeze thaw method is capable to decrease the water content of sludge to 50~60% (Knocke and Trahern, 1987; Lee and Lee, 1995) and even lower to 43% once added with polymer electrolytes (Huang et al., 1999) under low temperature condition. However, the consumption of energy and polymer electrolytes may become limiting factors under economical consideration. The technology by centrifuge force and mechanical press can’t remove the bound water efficiently. Use sunshine to remove water from sludge is an economical way but it need an enough space and time ( 7 days). In Taiwan, mechanical press and sunshine are the two common sludge dewatering methods being used in wastewater treatment plant (WWTP). The water content of sludge can be decreased to 65% ~ 85% and 60% ~70% for the above-mentioned methods, respectively.
Electrokinetic process has been demonstrated to be a cost-effective remediation technology to separate and extract heavy metals and organic contaminants from soils and sludge (Acar et al., 1996; Weng et al., 2000; Yuan et al., 2000). It applies low voltage DC to the porous medium between the electrodes and the pollutants or water will be removed through the electroosmosis (EO) flow driven under an electrical field and the migration of charged ions toward the opposite electrodes (Weng et al., 2000).
The present of this research was to investigate the effect of processing fluid and potential gradient on the sludge dewatering by EK process. Furthermore, the EK phenomenon during
treatment will also be demonstrated.
MATERIALS AND METHODS
Sludge
The sludge cakes used in this research were sampled right after belt press treatment from a local WWTP. The fundamental properties of this sludge sample were listed in Table 1. The pH, water content, organic content, zeta potential, and the metals content of the sludge were analyzed according to Taiwan EPA methods.
Table 1. The Physicochemical Properties of Tested Sludge Characteristics Values Metal Contents Values Moisture content (%) 84.1 Cd (mg/kg) 28.5
Organics (%) 56.9 Cr (mg/kg) 537
Sludge pH 7.2 Cu (mg/kg) 28.5
pHzpc 3.0 Fe (mg/kg) 5265
Average particle size(μm) 6.5 Ni (mg/kg) 167
Pb (mg/kg) ND
Zn (mg/kg) 264
Electrokinetic Experiments
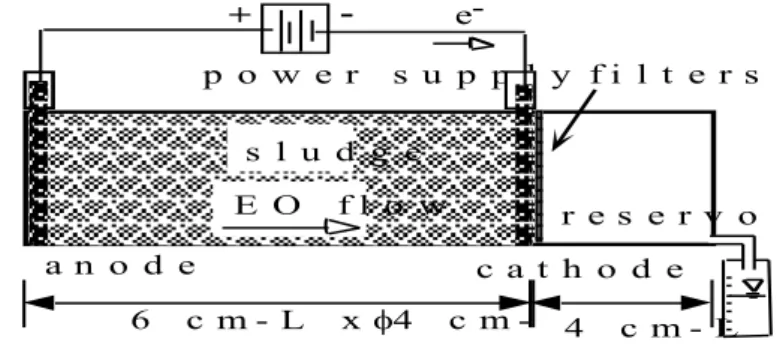
The EK experiments were conducted with acrylic cylindrical cells (Figure 1) consisting of two compartments: sludge specimen chamber (6 cm in length), and cathode reservoir (4 cm in length). A specific amount of the tested sludge with a moisture content of 87.8±3.0 % was placed within the sludge chamber for EK experiments. A fiberglass filter paper was inserted between sludge specimen and cathode reservoir to separate the sludge from the effluent water. Two sets of graphite rod electrodes (0.64 cm in diameter, Union Carbon Co., USA) were installed at each side of the sludge chamber. The detailed EK experimental conditions are listed in Table 2. The electric current, reservoir pH, and the amounts of effluent water were monitored during the tests. The sludge pH, residual water content profiles along the sludge specimen, and the concentration of metals in the effluent were determined at the end of each test. + - e-p o w e r s u e-p e-p l y a n o d e r e s e r v o i r 6 c m - L x 4 c m - 4 c m - L f i l t e r s s l u d g e E O f l o w c a t h o d e
Table 2. The Experimental Conditions for EK Systems Test No. Length of Sludge
Chamber (cm) Areas of graphite electrodes (cm2) Potential gradient (V/cm) Processing time (hours) 1 6 22 2.5 4 2 6 22 2.5 24 3 6 22 5.0 4 4 6 22 5.0 24 5 6 22 5.0 41
RESULTS AND DISCUSSIONS
Electroosmotic Permeability
The direction of electroosmosis flow was found as expected from the anode toward the cathode for all tests. It is resulted from the surfaces of sludge particles are negatively charged during the test periods because the sludge pH profiles along the cell are greater than pHzpc (3.0). The EO permeability, Ke (cm2/V-s), for a cylindrical sludge core of cross-section area of A (cm2) is calculated by Equation (1)
Qe = Ke ieA (1)
where Qe (cm 3
/sec) is defined as EO flow, ie (V/cm) is the applied electric gradient. The results of EO flow collected efficiency in the cathode reservoir and Ke values for all tests were presented in Table 3, respectively. Because of no supplement of processing fluid during the EK dewatering process, it was found that an increase of Ke values as higher electrical voltage applied whereas a decrease with increased elapsed time. The obtained values of Ke (0.24 ~ 1.38 10-5 cm2/V-s) are relatively lower than those (5.2~ 8.2 10-5
cm2/V-s) for the researches of metal removal from sludge by EK process (Weng et al., 1999; Yuan et al., 2000).
Table 3. The Experimental Results of Water Removal from Sludge by Electrokinetic Process Test No. Ke 10-5 cm2/V-s Water Recovery Efficiency a (%) Water Content After Treatment (%) Water Removal Efficiency b (%) Power Consumption (kwh/m3) 1 0.73 96.9 83.9 4.5 11.5 2 0.33 95.8 76.9 12.4 78.1 3 1.38 102.4 73.8 16.0 20.5 4 0.35 104.8 66.7 24.0 199.0 5 0.24 102.7 62.6 28.7 249.7
a: Water Recovery Efficiency = (Water Collected in Cathode Total Water Removed ) 100%
b: Water Removal Efficiency = [(Initial Water Content inSsludge Residual Water Content After Treatment)
Initial Water Content in Sludge〕 100%
Sludge pH Profiles
Water electrolysis which H+ and OH- are continuously released at the anode and cathode, respectively (Equations 2 and 3) is considered as the predominant reaction under electric field.
Cathode: 2H2O + 2e- → H2(g) + 2 OH- (3)
The movement of H+ and OH- will change the sludge pH drastically during the EK process. The sludge pH profiles along the cell affected by the processing time and potential gradient are shown in Fig. 2 and 3, respectively. A general trend of low pH at the anode and high pH at the cathode was found due to the acid front generated at the anode reservoir flushed across the sludge specimen and a great amount of OH- produced at the cathode. The results also show that both higher potential gradient or longer elapsed time in EK process would lower the sludge pH further near the anode side and increase the sludge pH further near the cathode side.
Figure 2 Effect of Processing Time on the Figure 3 Effect of Potential Gradient on the Sludge pH Profiles Sludge pH Profiles
Metal Concentration in the Effluent
The results of metals collected in the cathode reservoir are listed in Table 4. Up to 0.105% of metals was detected in the anode effluent. It shows the amount of metals obtained in the effluent is of insignificant concern.
Table 4. The Amount and Percentage of Metals in the Effluent
Cd (mg/Kg) Cr (mg/Kg) Cu (mg/Kg) Fe (mg/Kg) Ni (mg/Kg) Zn (mg/kg) 1 0 0 0.001 0.004 0.011 0.012 (0%) (0%) (0.004%) (0.0001%) (0.007%) (0.004%) 2 0 0.021 0.005 0.110 0.031 0.009 (0%) (0.004%) (0.017%) (0.002%) (0.019%) (0.04%) 3 0.001 0.020 0.017 0.218 0.015 0.030 (0.024%) (0.004%) (0.058%) (0.004%) (0.009%) (0.011) 4 0.001 0.025 0.017 0.082 0.058 0.021 (0.026%) (0.005%) (0.060%) (0.002%) (0.035%) (0.008%) 5 0.003 0.018 0.023 0.172 0.042 0.019 (0.105%) (0.003%) (0.079%) (0.003%) (0.025%) (0.007%)
Ps: The value in the parenthesis = (Metals in the effluent Total amount of metal)100.
0 2 4 6 8 10 12 14 0 0.2 0.4 0.6 0.8 1 2.5 V/cm 5.0 V/cm 0 2 4 6 8 10 12 14 Sludge pH
Normalized Distance from Anode to Cathode
Original pH= 8.64 24 hr Potential Gradient 0 2 4 6 8 10 12 14 0 0.2 0.4 0.6 0.8 1 4 hr 24 hr 41 hr Sludge pH
Normalized Distance from Anode to Cathode
Original pH = 8.64
Processing Time 5.0 V/cm
Water Removal Efficiency
The efficiency of water removal from sludge by EK process is summarized in Table 3. Around 95.8 ~ 104.8% removed water were collected in the cathode reservoir (Table 3) which is in the allowable error range of 5 % mass balance. As applied potential gradient of 5.0 V/cm, the water removal efficiency was 16.0%, 24.0%, and 28.7% for elapsed time of 4, 24, and 41 hours, respectively (Test 3~5). As increasing the potential gradient from 2.5 V/cm to 5.0 V/cm, the water removal efficiency was increased from 4.5% to 16.0% and 12.4% to 24.0% for processing time of 4 hours and 24 hours (Test 2 and 4), respectively. The results obviously indicated that higher potential gradient and longer processing time will enhance water removal from sludge by EK process.
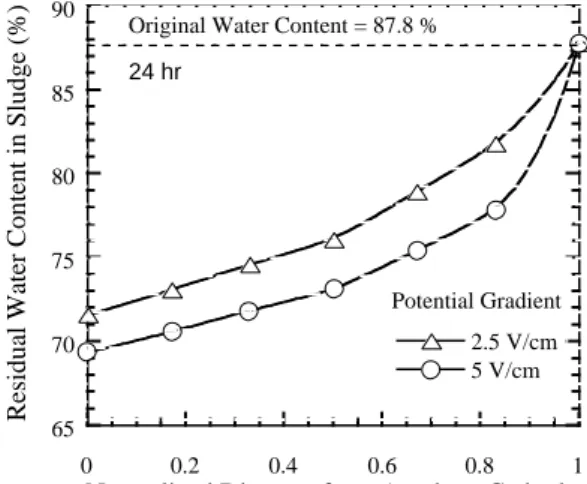
The residual water content profiles along the sludge specimen were shown in Figures 4 and 5. In general, higher bound water removal efficiency was found at the anode side rather than that at the cathode side. The water contents near the anode were73.3%, 71.8% and 54.0% for elapsed time of 4, 24, and 41 hours (Test 3~5), respectively, under applied potential gradient of 5.0 V/cm. As applied higher potential gradient, the water removal efficiency increases (Test 1,3 and Test 2,4). Although the highest total water removal efficiency for this research is only 28.7%, however it reaches as high as 38.5% for the sludge near the anode.
Figure 4. The Residual Water Content in Figure 5. The Residual Water Content in Sludge for EK System at Varied Sludge for EK System at Varied Processing Periods Potential Gradients
Power Consumption
The energy consumption can be calculated based on the following equation:
Eu = P/Vs = (∫VI dt) / Vs (4)
where Eu = energy consumption per unit volume of sludge (watt-hr/m 3
);P = energy expenditure (watt-hr);Vs = the volume of sludge (m3); V = the voltage (V); I = the current (A); t = prcessing time (hr). The energy consumption upon the termination of the experiments is in the range of 11.5 ~ 249.7 kwh/m3. In the tests of constant-voltage condition (Test 3~5), the energy consumption is directly related to the processing time and it resulted in higher water removal efficiency (Figure 6). A same phenomenon was also found for the case of constant processing time: the higher the potential gradient, the more the power consumption.
40 50 60 70 80 90 100 0 0.2 0.4 0.6 0.8 1 4 hr 24 hr 41 hr
Residual Water Content in Sludge (%)
Normalized Distance from Anode to Cathode
Processing Time Original Wtaer Content = 87.8 %
5.0 V/cm 65 70 75 80 85 90 0 0.2 0.4 0.6 0.8 1 2.5 V/cm 5 V/cm
Residual Water Content in Sludge (%)
Normalized Distance from Anode to Cathode
Potential Gradient Original Water Content = 87.8 %
CONCLUSIONS
The results of water removal from sludge by EK process were concluded as follows: 1. Due to no supplement of water in the EK systems, the value of Ke decreases as processing
time increases, whereas there is no impact on the enhancement of water removal efficiency. 2. In this research, the sludge in the vicinity of anode was acidified while the sludge near the
cathode becomes more basic than original sludge.
3. The results indicate that both higher potential and longer processing time in EK systems will enhance the water removal from sludge. Under an potential gradient of 5.0 V/cm, the moisture content of sludge can be lowered from 87.8% to 62.6%, 66.7%, and 73.8% for 4 hrs, 24 hrs, and 41 hrs of processing time.
Figure 6. The Variation of Power Consumption and Water Removal Efficiency with Processing Time
REFERANCES
Acar, Y. B., and Alshawabkeh A. N. (1996). Electrokinetic remidiation. I: pilot-scale tests with lead-spiked kaolinite. J. of Geotec. and Geoenviron. Engrg., 122(3), 173 ~ 185.
Huang, C. P., Yuan R. S., Peng C. K., and Chen M. Y. (1999). The effect of low temperature on the dewatering characteristics of sludge,” Proc. of The 24th Conf. of Wastewater Treatment Technol., 771 ~ 775 (in Chinese).
Knocke, W. R., and Trahern P. (1987). Freeze-thaw conditioning of chemical and biological sludge. Wat. Res., 23, 35 ~ 42.
Lee, D. J. and Lee S. F. (1995). Measurement of bound water in sludge : the use of differential scanning calorimentry (DSC). J. Chem. Tech. Biotechnol. 62, 359 ~ 364.
Weng, C. H., Lin Y. H., and Hsieh Y. H. (2000) Electrokinetic remediation of trichloroethylene contaminated kaolinite. J. of Chinese Institute of Environ. Engrg., 10(4), 279 ~ 289.
Weng, C. H., Yuan C., Chen W. C., Chuang H. P., and Chen R. C. (1999). The feasibility study of metal removal from sludge by surfactant-electrokinetic process. Proc. of The 14th
Conf. of Waste Treatment Technol., 5-9~5-15.
Yuan C., Weng C. H., Chuang H. P., and Chen W. C. (2000). Remediation of Cr(III) contaminated clay by electrokinetic: the effect of processing fluids. Proc. of The 15th Conf. of Waste Treatment Technol., 2-207 ~ 2-214.
0 50 100 150 200 250 300 5 10 15 20 25 30 35 40 0 10 20 30 40 50 Power Consumption (kwh/m 3)
Water Removal Efficiency (%)
Processing Time (hrs)