infiltration method
C . S. S H I N a n d C . Q . C A I
Department of Mechanical Engineering, National Taiwan University, No. 1, Sec. 4, Roosevelt Road, Taipei, 10617, Taiwan, Republic of China Received in final form 10 July 2000
A B S T R A C T Infiltration of foreign materials into a fatigue crack has previously been shown to be able to retard the crack and extend fatigue life. Most of the related studies were empirical and phenomenological in nature. To aid engineering decisions, it would be advantageous if the possible outcome of a repair can be evaluated beforehand. To this end, a crack closure model taking into account the additional closure effect of the infiltrant has been developed and verified against experimental results. With this model, the sensitivity of the repair effect to various parameters such as mechanical properties of the infiltrant, depth of penetration and infiltration load level can be assessed. Keywords closure model; crack arrest; crack infiltration; fatigue crack closure; fatigue damage repair.
Most of the related studies were empirical and I N T R O D U C T I O N
phenomenological in nature. For practical application, it would be advantageous if the possible outcome of a Fatigue fracture accounts for a great number of
mechan-ical failures. When a fatigue crack is discovered in a repair can be evaluated beforehand.
A simplified model assuming a uniform infiltrant critical component during routine maintenance,
replace-ment of the component may not be feasible as there contact stress13 met with limited success. Researchers
Ur-Rehman and Thomason5,14argued that due to small
may not be stocks or the available downtime is too
limited. Some expeditious provisory fixing may then be deformation and large plastic constraint, a low-strength elastic wedge will behave as nearly rigid. However, on needed to allow the component to operate safely until a
more elaborate repair or replacement can be arranged. taking into account the contribution of this wedge to the crack closure, they found that the cracks under Infiltration of foreign materials into a fatigue crack has
been shown to be able to bring about additional crack investigation should have arrested, which was contrary to what they actually observed. At crack lengths suffic-closure and subsequent crack growth retardation.1–3This
effect has been used to extend fatigue life.4–6Different iently far away from the wedge tip, crack growth was predicted to occur, but the predicted rates were lower infiltration materials have been tested and effective
infil-tration methods have been developed.7–11The develop- than observed. Ur-Rehman and Thomason attributed the differences between the observed and predicted ment of this technique has recently been reviewed.12
The amount of retardation achieved by infiltration is growth behaviour to: (i) a finite crack length effect; (ii) an irregularity in wedge geometry; and (iii) friction strongly influenced by the properties of the infiltrant as
well as how effectively the infiltrant penetrates into a between the wedge and crack interfaces. Careful exper-imental examination showed that a deduced rigid wedge crack. The depth of infiltrant penetration depends on
the fatigue loading condition and the load level at which that suits the retardation behaviour differs vastly in size and location to the measured wedge.8
infiltration is being carried out.
In the current work, a crack closure model embodying an elastic-perfectly-plastic infiltrant has Correspondence: C. S. Shin, Department of Mechanical Engineering,
been established. With this model, it is possible to National Taiwan University, No. 1, Sec. 4, Roosevelt Road, Taipei
evaluate the amount of crack closure brought about by 10617, Taiwan, Republic of China.
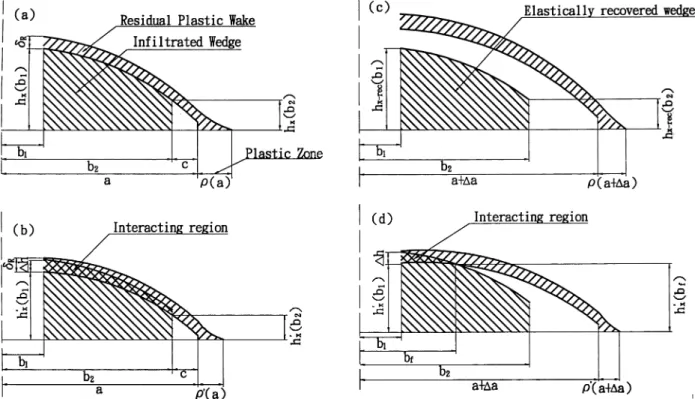
simulated results can shed more light on the effect of surface is a layer of residual plastic wake left over by previous plastic deformation at the crack tip. Figure 1(b) infiltrating foreign materials with different mechanical
properties, under different infiltration load levels, shows the same crack at the minimum applied loading Kmin. The thickness hx of the infiltrated wedge is now
different fatigue loading ratios and to different depths
of infiltrant penetration. compressed and deformed elastic-plastically to h∞xalong
the crack length. Reactive stresses varying according to the amount of deformation which will arise in the wedge C R A C K C L O S U R E M O D E L
and act on the crack surface. This wedge-opening action will lead to an opening stress intensity Kwedge. To remove
An infiltrated wedge will bring about premature contact
of the crack flanks and so react to part of the applied surface contact and allow the crack to become fully open again, a stress intensity increment equal to Kwedgehas to
loading. As a result the effective crack driving force will
be reduced and crack growth will be retarded. The be applied. Hence the fully open stress intensity level, denoted as Kop,may be calculated by:
current model attempts to predict this crack driving force reduction from the geometrical interference that
Kop=Kmin+Kwedge (1)
causes premature contact and reaction stresses in the
wedge. The infiltrants used (mainly polymers) in a On loading up again, elastic recovery of the wedge will occur. In Fig. 1(c) the crack has increased in length to number of experiments have much lower Young’s moduli
and yield strengths than the specimen materials (mainly (a+Da), while the wedge has undergone plastic defor-mation and subsequent elastic recovery to thickness engineering alloys). Hence in this model, for simplicity,
we assume during the calculations that all deformation hx−rec. On unloading the specimen again, only part of
the wedge will now come into contact with the crack occurs in the wedge. Moreover, the wedge materials are
assumed to be elastic-perfectly-plastic. Figure 1 shows surface [Fig. 1(d)]. The corresponding opening stress intensity level can again be calculated by Eq. (1). schematically the development of crack closure for the
upper half of an infiltrated crack. In Fig. 1(a), the crack The compressive deformation of the wedge at various positions of the crack may be deduced from a comparison of length a is propped open at the infiltration stress level
(ISL) and a wedge that spans the region from b1to b2is of the crack opening displacement (COD) at the opening
stress intensity level and the corresponding unloaded snugly placed into the crack. Also shown on the crack
Fig. 1 Schematic of the development of crack closure induced by an infiltrated wedge. (a) just after infiltration at the prop-opening load;
(b) contact interference developed on unloading to minimum load; (c) crack growth occurred after infiltration; (d) contact interference developed on unloading after some crack growth.
wedge thickness. By cutting up the wedge into a number Unless otherwise stated, the test conditions for calcu-lation are a constant applied stress intensity range of of strips, the distribution of the reactive wedge stress
along the crack can be deduced from the corresponding 25 MPa앀m at an R ratio of 0.1. Infiltration was made at the maximum cyclic load with an infiltrant that has a deformation. Using a suitable weight function, Kwedge
can be calculated from this stress distribution. In Eq. (1), yield strength of 70 MPa and a Young’s modulus of 1.63 GPa. Lastly, a comparison between the model both Kopand Kwedgeare unknown. An iterative procedure
can be set up to first-guess the value of Kop. By using prediction and some experimental results will be made.
the above procedures, Kwedge can be calculated and an
updated Kopguess be obtained. The process is repeated Effect of crack length coverage
until Kopand Kwedgeconverge to constant values.
Since most of the available experimental results were During the early stage of development, the infiltration technique was not efficient and the infiltrant only pen-derived from compact tension specimens, in this work
the corresponding weight functions derived by Mall and etrated to a few millimetres behind the crack tip. Even with a more efficient infiltration method, thorough Newman15 have been used for calculating the stress
intensity and COD under pin loading and under a crack penetration may not be possible if the infiltration stress level is too low, the viscosity or surface tension of the surface stress distribution. The weight functions are
reproduced in the Appendix. For other specimen geo- infiltrant too high or if the infiltrant contains solid particles.8
metries, the relevant weight functions should be used.
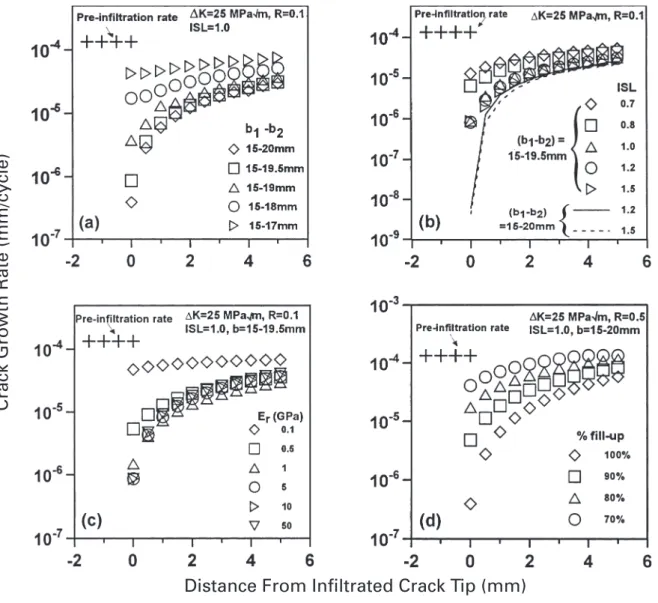
In calculating the net CODs, the thickness of the residual Figure 2(a) shows the predicted growth responses fol-lowing infiltration at the maximum cyclic load for various plastic wake has been deducted from the linear elastic
fracture mechanics COD values. The thickness of the crack length coverage. Infiltrant coverage starts from the tip of the starter notch (15 mm) and extends to various residual plastic wake is approximated by the result given
by Budiansky & Hutchinson16: points behind the crack tip (20 mm). It can be seen that a coverage from 15 to 17 mm caused minimal retardation in growth rate. Significant retardation (greater than one dtip−dR dtip =0.5
A
Kmax−Kop KmaxB
2 (2)order of magnitude) starts to occur only if the infiltrant coverage is within 1 mm behind the crack tip. The closer where Kmax is the maximum stress intensity of the to the crack tip, the more serious is the initial retardation. loading cycle, dtipis the crack tip opening displacement Due to the occurrence of a singularity in computation, at Kmax, and dRis the thickness of the residual plastic the effect of filling right up to the crack tip can only be
wake. approximated by filling up to 19.9999 mm. In this case,
a retardation of more than two orders of magnitude is obtained. At the current infiltration stress level, the R E S U L T S A N D D I S C U S S I O N
retardation responses for coverage to 19.5 mm and to From a consideration of the above model, it is clear that 20 mm do not show much difference. In all the cases the amount of retardation brought about by infiltration considered, crack growth can still occur despite the of foreign material is affected by a number of factors. various degrees of retardation. Moreover, the difference These include: the range of crack length coverage, the in the amount of retardation rapidly decreases as the fill-up percentage of the crack opening displacement at crack continues to grow.
the infiltration load, the infiltration stress level and the deformation properties such as Young’s modulus and
Effect of infiltration stress level yield strength of the infiltrant. Moreover, the fatigue
loading ratio R (min. load/max. load) acting on the Most of the experiments on infiltration were carried out specimen may also affect the outcome. These effects will with the specimens held open at a certain static load. In now be examined in the following using a compact this article, the infiltration stress level (ISL) is rep-tension specimen of width 50 mm containing a 20 mm resented as a fraction of the maximum stress intensity crack. The specimen material is taken as AISI 304 Kmax. Figure 2(b) compares the effect of retardation at
stainless steel which has a yield strength and tensile different ISL values. The infiltrant coverage is assumed strength of 375 and 665 MPa, respectively. The crack to be from 15 to 19.5 mm (i.e. up to 0.5 mm behind the growth rate (da/dN) and the effective stress intensity crack tip). At an ISL of 0.7, the initial retardation is less range (DKeff,=Kmax−Kop) is related by: than one order of magnitude. At 0.8, initial retardation
is nearly by one order. As the ISL increases from 0.7 to 1.0, the amount of initial retardation showed marked da
dN=4.6093×10
−8(DK
Crack Growth Rate (mm/cycle)
Distance From Infiltrated Crack Tip (mm)
Fig. 2 Development of crack growth responses following infiltration (a) for various crack length coverage of the infiltrant; (b) at different
infiltration stress levels (ISL); (c) with infiltrants of different stiffness; (d) for different infiltrant fill-up percentages.
not cause any significant additional increase in the tends to prop-open the crack and prevents the full effect of the overload plastic wake being exerted. Hence in the retardation. As the crack continued to grow, the
differ-ence in the subsequent retardation responses for the current work the overload retardation effect has been neglected in the calculations. The second effect of an different ISL values becomes smaller.
It should be pointed out that with ISL above 1.0, two ISL above 1.0 is that the crack is now propped open to a wide slit. The infiltrant now stands a good chance of effects may become significant. First, the ‘overload’ alone
will retard the crack. This will be added to the retardation getting very close to the crack tip and the amount of infiltrant coverage is likely to increase. On the other effect from the infiltrated wedge. Previous work on AISI
304 stainless steel showed that under similar applied hand, with an ISL of 0.7 or 0.8, it is doubtful whether the infiltrant can get within 0.5 mm behind the crack tip. loading, ISL values of 1.2 and 1.5 retarded the growth
to 67 and 33% of the baseline rate. These are small even With these two effects in mind, it is expected that the actual difference in retardation responses should be even when compared with the retardation derived from
infil-tration at an ISL of 0.7. Moreover, the residual plastic more prominent than that shown in Fig. 2(b).
For comparison, the retardation responses for ISL wake of the overload becomes fully developed and brings
about retardation only when the crack grows into the above 1.0 with infiltrant coverage up to the crack tip are also shown as lines in Fig. 2(b). In these cases, the initial overload plastic zone. Occurrence of an infiltrated wedge
retardation amounts to four orders of magnitude and three times the uniaxial value. The current work also employed a constraint factor of 3 for the plastic defor-crack arrest is likely to occur. This is in marked contrast
with the case of ISL equal to 1.0, where coverage to mation of the infiltrated wedge.
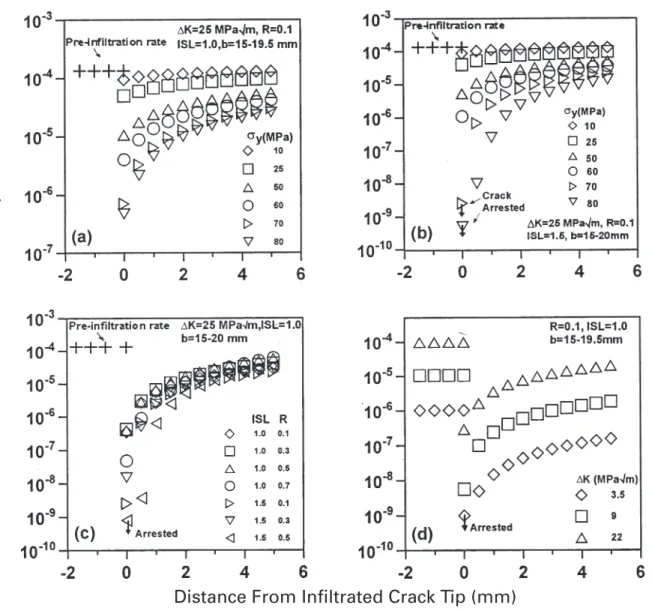
Figure 3(a) shows the predicted retardation responses 19.5 mm and 20 mm do not give significantly different
responses [see Fig. 2(a)]. Interestingly, if the crack con- for different infiltrant yield strengths using the current model at R=0.1 and an ISL of 1.0. Infiltrant coverage tinues to grow, the subsequent retardation responses do
not differ much from the lower ISL value and lower is assumed to be from 15 to 19.5 mm. There is an obvious increase in the amount of retardation as the infiltrant coverage cases.
infiltrant yield strength increases. For yield strengths of 10 and 25 MPa, there is only a minimal retardation. As Effect of Young’s modulus of infiltrant
the yield strength increases to 50 MPa, the initial retard-ation amounts to one order of magnitude. The increase Figure 2(c) compares the growth responses resulted from
infiltrants with a Young’s modulus (Er) ranging from in the initial retardation is more marked than that in the
subsequent growth as infiltrant yield strength increases. 0.1 GPa to 50 GPa. With the ultra low modulus of
0.1 GPa, nearly no retardation is obtained. The amount Figure 3(b) shows the effect of infiltrant yield strength when the ISL is raised to 1.5. Infiltrant coverage for of retardation increases significantly as the infiltrant
modulus increases through 0.5 GPa up to 1 GPa. On these cases has been changed to 15 to 20 mm. The trends described above for ISL=1.0 are still valid and increasing the infiltrant modulus further to 5 GPa, the
initial retardation increases while the subsequent retard- the difference in retardation responses brought about by the difference in yield strength is even more prominent. ation decreases, both by a small amount. Finally, above
5 GPa, an increase in infiltrant modulus caused no significant difference in the retardation behaviour.
Effect of load ratio
Figure 3(c) compares the retardation responses under Effect of fill-up percentage
different R ratios at two different values of ISL. For an ISL of 1.0, the retardation responses for R ranging from It has been observed that when the crack opening
displacement during infiltration is large, infiltrants with 0.1 to 0.5 showed no marked distinction. However, careful examination shows that the initial retardation at good flowability (such as an uncured epoxy resin and a
molten solder) tended to seep out from the widely R=0.3 is slightly lower than that for R=0.1. The trend reverses as R increases to 0.5. At R equals 0.7, a markedly opened crack before they hardened. As a result, the
infiltrated wedge thickness is only a fraction of the crack higher initial retardation occurred. As the crack con-tinued to grow, the relative amount of retardation among opening profile at the infiltration load. Figure 2(d)
dem-onstrates that at a stress intensity range DK of different R ratios changes. Subsequently the amount of retardation is less for a higher value of R. These trends 25 MPa앀m and an R ratio of 0.5, a decrease in fill-up
percentage from 100 to 80% reduced the amount of in the retardation development at different R ratios also hold true and in fact become more prominent for ISL initial retardation by more than one order of magnitude.
Significant reduction persisted even when the crack values of 1.2 and 1.5. The development of retardation at different values of R for ISL=1.5 has been included continued to grow. On the other hand, a decrease in
fill-up percentage from 80 to 70% induced a much in Fig. 3(c) for comparison. At a constant ISL, a higher R ratio will result in a larger crack opening. This will smaller reduction in the amount of crack growth
retardation. enable a thicker wedge to be infiltrated yet produce a
smaller amount of contact interference. These two phen-omena have opposite effects on the amount of induced Effect of infiltrant yield strength
crack closure, giving rise to the trends observed above. Ur-Rehman and Thomason5,14argued that a huge plastic
constraint would be imposed on the thin wedge
infil-Effect of applied stress intensity range trated inside a crack. Moreover, the elastic deformation
of the wedge is also very small. As a result they suggested Figure 3(d) compares the retardation responses resulting from infiltration under applied values of DK of 3.5, 9 that a material which yields at a value as low as 10 MPa
would appear as virtually rigid. Experimental work17 and 22 MPa앀m at a load ratio of 0.1. These correspond
to pre-infiltration growth rates of 10−4, 10−5 and showed that infiltrants with different yield strengths
produced significantly different amounts of retardation. 10−6mm/cycle, respectively. After infiltration at an ISL=1.0, the initial growth rates all fell by more than Recent finite element results17suggest that plastic
Crack Growth Rate (mm/cycle)
Distance From Infiltrated Crack Tip (mm)
Fig. 3 Development of crack growth responses following infiltration (a) with infiltrants of different yield strengths at ISL=1.0; (b) with
infiltrants of different yield strengths at ISL=1.5; (c) at different R ratios; (d) under different applied values of DK.
The maximum amount of initial retardation was load levels. In practice, as the applied loading gets smaller, the crack opening also decreases accordingly obtained for the case with a pre-infiltration growth rate
of 10−6mm/cycle (>4 orders). Since the retarded rate and so infiltration may not be as perfect as that for a larger crack opening. The actual amount of retardation is below 10−10mm/cycle, crack arrest is considered
to have occurred. The initial retardation for the for lower load levels may be less than that presented in Fig. 3(d).
10−5mm/cycle case (~3.3 orders) comes second and finally it is the 10−4mm/cycle case (~2.5 orders). Assuming crack growth can continue, the crack growth
Comparison with experimental data increments for regaining half of the growth rates on the
log scale for the three cases are 0.74, 1.0 and 1.4 mm, A number of results of crack-infiltration-induced crack growth retardation has been collected from the literature respectively.
Based on the above, a crack with a lower pre-infil- and checked against computed results using the above model. For experiments carried out in our own labora-tration growth rate has a better chance of getting arrested
by infiltration. However, it should be noted that the tory, we have tried to measure Young’s modulus and yield strength on compression of the infiltrants as far as above discussion assumed that the infiltrant has gone to
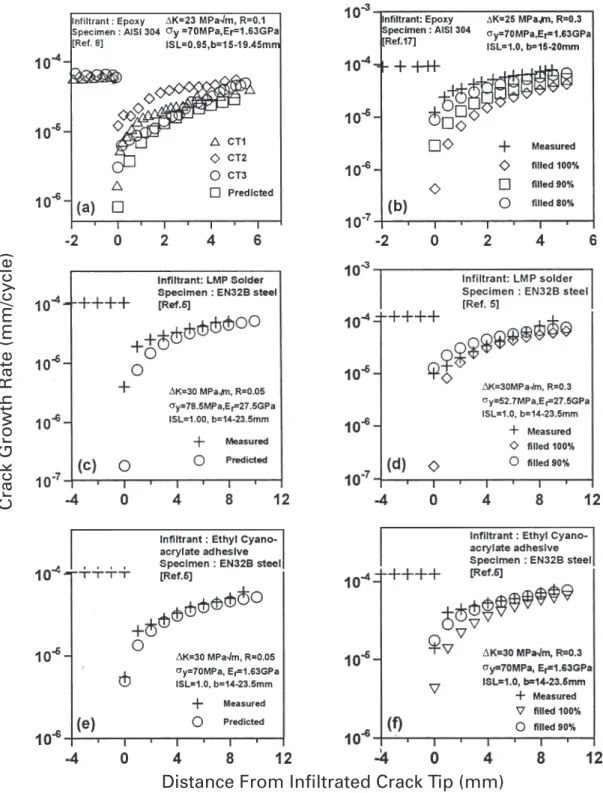
these properties for the infiltrants concerned. the computed retardation results assumed a 90% fill-up lie above the measured data [see Fig. 4(d)]. This suggests Furthermore, information about the proximity of
infiltrant to the crack tip is often lacking. Reasonable the actual fill-up ratio was somewhere between 90 and 100%. In cases when molten metal is used as the estimates for these values have to be employed, which
may lead to uncertainty in the following computations. infiltrant, considerable contraction due to solidification and the subsequent cooling down may also decrease the Figure 4(a) is the retardation responses due to the
infiltration of epoxy resin.8The specimen material was wedge thickness and contribute to a smaller observed retardation.
304 stainless steel. The R ratio was 0.1 and the ISL was
0.95. A proximity to crack tip of 0.55 mm was assumed Figure 4(e) and (f ) are also results by Ur-Rehman and Thomason5,14 using a low-viscosity ethylcyanoacrylate based on observation of the fracture surface. The
experi-ment was repeated thrice. It has been pointed out in adhesive as infiltrant. The testing conditions were the same as that for Fig. 4(c) and (d). As the modulus and Shin et al.8that experimental scatter occurred due to a
varying degree of effectiveness in infiltration. This expla- yield strength have not been reported, the data measured for epoxy resin were used as an approximation. For an nation is in line with the fact that the predicted response
forms a lower bound and is approached by two of the R ratio of 0.05, computed results agree well with exper-imental data [Fig. 4(e)]. Results computed assuming tests (CT1 and CT3).
Figure 4(b) depicts the result17 for a similar exper- fill-up percentages of 90 and 100% are shown in Fig. 4(f )
for an R ratio of 0.3. The 90% fill-up case agrees well imental condition to Fig. 4(a), except that the R ratio is
now 0.3. The measured retardation is about an order of with experimental results. This is in line with previous observations and discussion that at a higher R ratio, magnitude larger than predicted when a 100% fill-up
was assumed. In this work, a tunnel was drilled through partial fill-up may result.
Figure 5(a) and (b) show the retarded growth responses the height of the specimen to reach the crack plane.
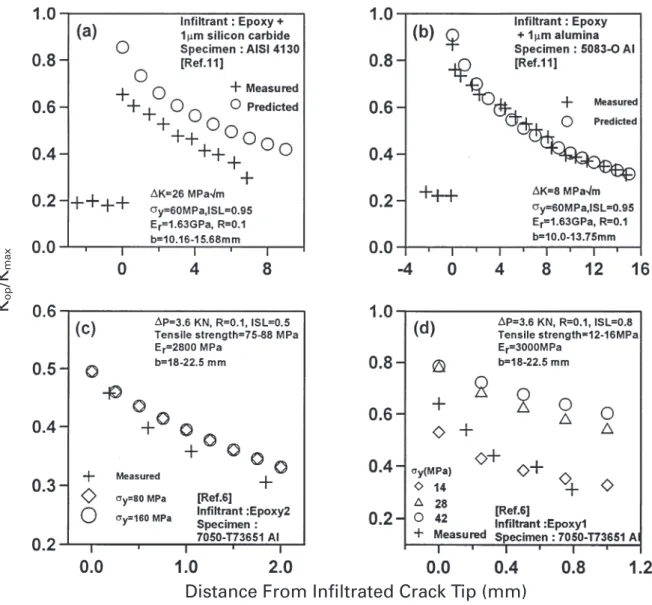
Infiltrant was then forced via the tunnel into the crack. in AISI 4130 alloy steel and 5083-O aluminium alloy on infiltration with epoxy reinforced with 1 mm silicon It was observed that epoxy resin tended to seep out of
the widely opened crack before it became fully hardened. carbide and alumina particles, respectively.11,18 In this work, the crack growth rate versus DKeff relationship
Experimental results agreed well with the computed
results based on an 80% fill-up. that was reported could not cover the whole range of
DKeff involved. Fortunately, the authors have also
Figure 4(c) and (d) show the results from Ur-Rehman
and Thomason5,14 using low-melting-point solder as reported the fraction of crack opening (DKeff/DK). This
allows the experimental Kop/Kmax data to be deduced
infiltrant. The R ratios were 0.05 and 0.3, respectively.
The specimen material was an EN 32B low-carbon steel. and the latter are used for comparison with predictions in Fig. 5(a) and (b). Measured retardation is less than Ur-Rehman and Thomason5,14 mentioned an average
proximity of the infiltrant to the crack tip of 0.5 mm. the computed values for AISI 4130. This may be attri-buted to highly non-uniform penetration of infiltrant They also reported a diamond pyramid hardness number
of 24 for their low-melting-point solder.14 A yield through the thickness. In fact the fractograph reported
in Song et al.11 showed that over most part of the
strength of 78.5 MPa was therefore employed for
com-putation. In both cases, the computed values for the infiltrated crack length, the wedge coverage only amounted to about half the specimen thickness. For the initial retardation were much lower than the
experimen-tally observed value. Fractographs given in Ur-Rehman 5083-O specimen [Fig. 5(b)], computed results agree well with those measured. Incidentally, the fractograph and Thomason5and Ur-Rehman14 show that the
infil-trated wedges were highly non-uniform through the for this case18 showed thorough penetration of the infiltrant.
specimen thickness. The point of the deepest penetration
could be more than 2 to 3 mm closer to the crack tip Figure 5(c) and (d) shows the results by Sharp et al.6 using two low-viscosity epoxy resins on 7050-T73651 than most of the other points along the front edge of
the wedge. For an R ratio of 0.05 [Fig. 4(c)], the discrep- specimens. They used relatively low ISL values [0.5 for Fig. 5(c) and 0.8 for Fig. 5(d)]. Their work also differed ancy between computed and measured retardation
responses may be attributed to this non-uniform penetra- with all previous works in that they employed a constant load range of 3.6 kN instead of a constant DK. No crack tion of the infiltrant. At the higher R ratio of 0.3
[Fig. 4(d)], a larger crack opening displacement should growth rate data nor growth rate versus DKeff were
provided in Sharp et al.6 Fortunately, a few raw
com-alleviate the phenomenon of non-uniform penetration.
However, the discrepancy between computed and meas- pliance curves (load against crack mouth opening) have been included. These allow a limited amount of exper-ured initial retardation responses is even larger than that
seen in Fig. 4(c). One possible explanation is the partial imental Kop/Kmaxdata to be extracted approximately and
compared with computed results. Yield strengths for the fill-up of crack opening as mentioned before. In fact,
Crack Growth Rate (mm/cycle)
Distance From Infiltrated Crack Tip (mm)
Fig. 4 Comparison of predicted and observed retardation responses due to the infiltration of (a) epoxy in 304 stainless steel (R=0.1);
(b) epoxy in 304 stainless steel (R=0.3); (c) low-melting-point solder in EN32B steel (R=0.05); (d) low-melting-point solder in EN32B steel (R=0.3); (e) ethylcyanoacrylate in EN32B steel (R=0.05); (f) ethylcyanoacrylate in EN32B steel (R=0.3).
epoxies are not available but the tensile strengths and the yield strengths have been taken as the respective tensile strengths as well as some percentages above the Young’s moduli have been reported. Polymers are
some-what stronger in compression than in tension19and the tensile strengths. Figure 5(c) shows the case for ISL=
0.5 with the epoxy having tensile strengths of 75 to yield strength in compression may be somewhat higher
K
op/K
max
Distance From Infiltrated Crack Tip (mm)
Fig. 5 Comparison of predicted and observed retardation responses due to the infiltration of (a) epoxy+1 mm silicon carbide in AISI 4130
steel (R=0.1); (b) epoxy +1 mm alumina in 5083-O Al (R=0.1); (c) a high-strength epoxy in 7050-T73651 Al (ISL=0.5); (d) a low-strength epoxy in 7050-T73651 Al (ISL=0.8).
80 MPa and 160 MPa show no significant difference. higher fill-up ratio. A higher infiltrant yield strength and Young’s modulus will also increase the amount of induced The observed Kop/Kmax data agree well with the
com-puted results. Figure 5(d) shows the case for ISL=0.8 crack closure. However, such increase becomes insignifi-cant when the infiltrant strength or modulus is above with the epoxy having tensile strengths of 12 to 16 MPa.
Computed results start to show no significant difference certain values. With an increase in cyclic loading ratio, the amount of induced crack closure first decreases and when the yield strength is higher than 28 MPa. The
observed Kop/Kmaxdata are close to the computed results then increases. Growth behaviour prediction from the
current model agrees well with a number of experimental based on a yield strength of 14 MPa.
observations collected from the literature. C O N C L U S I O N
Acknowledgements A model for evaluating the development of crack closure
The authors gratefully acknowledge the financial support following the infiltration of foreign material into a
provided by the National Science Council under the fatigue crack has been established. The induced crack
projects NSC-87-TPC-E-002-006 and NSC-88-2212-closure will increase with the infiltrant being closer to the
E-002-057. crack tip, with a higher infiltration stress level and with a
17 R. Z. Li (1998) Investigation on artificially induced fatigue
R E F E R E N C E S crack growth retardation. PhD Thesis, Department of
Mechanical Engineering, National Taiwan University. 1 H. Kitagawa, S. Toyohira and K. Ikeda (1979) A new method
18 Y. P. Zhao (1995) Fatigue crack retardation by artificially of arresting fatigue crack growth by artificial wedge. In:
induced crack closure. MS Thesis, Department of System
Proceedings of International Conference on Fracture Mechanics in
Engineering, Chung Cheng Institute of Technology, ROC.
Engineering Applications, Bangalore, India (Edited by G. C. Sih
19 M. F. Ashby (1999) Materials Selection in Mechanical Design, 2nd and S. R. Valluri), Sijthoff and Noordhoff, The Netherlands,
edn. Butterworth Heinemann, Oxford. pp. 281–293.
2 R. S. Vecchio, J. S. Crompton and R. W. Hertzberg (1986)
Anomalous aspects of crack closure. Int. J. Fract. 31, R29–R33. A P P E N D I X 3 R. W. Hertzberg, C. H. Newton and R. Jaccard (1988) Crack
closure: correlation and confusion. In: ASTM STP 982 (Edited
S T R E S S I N T E N S I T Y A N D C O D C A L C U L A T I O N by J. C. Newman, Jr and W. Elber), American Society for
U N D E R P I N L O A D I N G A N D U N I F O R M Testing and Materials, Philadelphia, PA, pp. 139–148.
4 C. S. Shin and S. H. Hsu (1992) Fatigue life extension by an P R E S S U R E F O R C T S P E C I M E N1 5
artificially induced retardation mechanism. Engng Fract. Mech.
43, 677–684. Pin-loaded holes with loading P
5 A. Ur-Rehman and P. F. Thomason (1993) The effect of
artificial fatigue crack closure on fatigue crack growth. Fatigue Stress intensity: Fract. Engng Mater. Struct. 16, 1081–1090.
6 P. K. Sharp, J. Q. Clayton and G. Clark (1997) Retardation
KP=
p 앀WF
A
a W
B
and repair of fatigue cracks by adhesive infiltration. Fatigue
Fract. Engng Mater. Struct. 20, 605–614.
7 C. S. Shin, C. M. Wang and P. S. Song (1996) Fatigue damage where repair—a comparison of some possible methods. Int J. Fatigue
F(a)
18, 535–546.
8 C. S. Shin, K. C. Huang and R. Z. Li (1998) Artificial
retardation of fatigue crack growth by the infiltration of cracks =(2+a)(0.886+4.64a−13.32a2+14.72a3−5.6a4)
(1−a)3/2
by foreign materials. Fatigue Fract. Engng Mater. Struct. 21, 835–846.
9 P. S. Song, C. M. Wang and C. S. Shin (1994) An investigation
a= a W
on various infiltration methods for fatigue crack repair. In:
Proceedings of the 1994 Far East Conference on NDT (FENDT
Crack opening displacement at a distance c from the ∞94) and ROCSNT Ninth Annual Conference, Taipei, R.O.C.,
November 1994, (Edited by W. H. Chen, T. T. Wu and K. C. hole centreline: Wu), The Republic of China’s Society for Nondestructive
Testing, Taiwan, pp. 221–228. VP= 2P E
P
a c/W F(a)G(a, D) 앀2p(a−c/W)da 10 B. C. Sheu, P. S. Song and C. S. Shin (1994) The effect ofinfiltration induced crack closure on crack growth retardation.
Scripta Metallurgica Materialia 31, 1301–1306. where
11 P. S. Song, S. Hwang and C. S. Shin (1998) Effect of artificial closure materials on crack growth retardation. Engng Fract.
G(a, D)=(1+A1D+A2D
2)
(1−D)3/2
Mech. 60, 47–58.
12 C. S. Shin and Z. Z. Chen (1999) A novel method for repairing
fatigue crack. Special issue on∞Recent Developments in Fatigue A1=3.57+12.5(1−a)8 and Fracture Mechanics-based Analysis and Design of
A2=5.1−15.32a+16.58a2−5.97a3 Structures’, J. Struct. Engng (Structural Engineering Research
Centre, India) 26, 55–62.
13 Y. Y. Wang, M. X. Zho and D. Q. Feng (1993) A study of D= b
W ∞= b W −a+b
retarding fatigue crack growth using an artificial wedge. Fatigue
Fract. Engng Mater. Struct. 16, 363–376.
The crack opening displacement at a distance j measured 14 A. Ur-Rehman (1992) An investigation of methods of
reduc-ing fatigue crack growth by artificial crack-closure effects. from crack tip can also be calculated by the following PhD Thesis, Department of Aeronautical and Mechanical equation:
Engineering, University of Salford.
15 S. Mall and J. C. Newman Jr (1985) The Dugdale model for EV
P P =4
S
j 2pWC
1+C1A
j aB
+C2A
j aB
2D
F(a)compact specimen. In: ASTM STP 868 (Edited by M. F. Kanninen and A. T. Hopper), American Society for Testing and
Materials, Philadelphia, PA, pp. 113–128. where
16 B. Budiansky and J. W. Hutchinson (1978) Analysis of closure in fatigue crack growth. J. Appl. Mech. 45, 267–76. C
and where C2=0.64−4.34a+10.24a2−8.46a3
H= 1
(1−a)3/2 Uniform pressure s on part of the crack surface
(from b1to b2)
×
C
2B(1+A1+A2)앀B2+(1−a)B
+(1−a)(5+A1−3A2)앀B2+(1−a)B
+(1−a)2(3−A 1+3A2) ln(앀B+앀B+1−a)
D
K
B=B1 B=B2 Stress intensity: Ks=P
b1 b2 2s 앀2pbG(a, D) db Bj= bj Wor Crack opening displacement at a distance c from hole
centreline: Ks=s