An Efficient Learning Model for Mobile Environments using Graph and Probability Analysis
6
0
0
全文
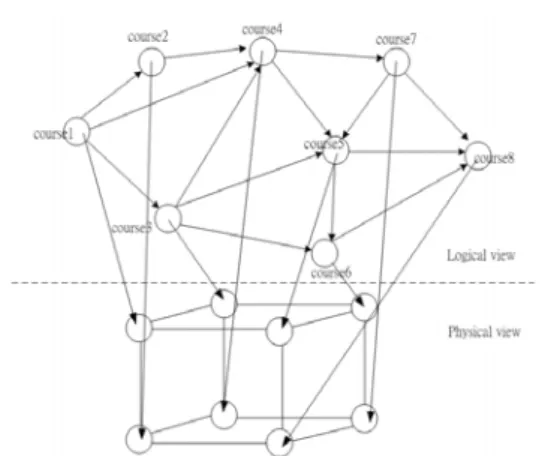
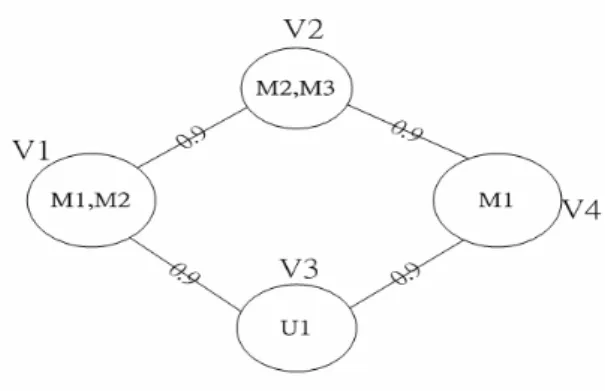
(2) Int. Computer Symposium, Dec. 15-17, 2004, Taipei, Taiwan.. rate on the network when a mobile learner requires a courseware unit.. Physical border in Figure 1) to the physical network environment using the data allocation scheme. Figure 3 shows that the idea of mapping logical courseware unit into a physical network environment.. 3. Physical View. The Physical View is concerned with network reliability. This is an important consideration when allocating resources in such an environment. We discuss the physical aspects of mobile environments such as 3G networks and discuss the important properties related to mobile learning such as link probability, Multi-access Probability.. 3.1 Link Probability. Link probability deals with the quantization of communication links to determine network reliability. In link probability, the initial transfer reliability is formulated and from this, a simple linear regression model is used to get the approximate dynamic probability. TR(ei):The initial transfer reliability of link at traffic load=0. PR(ei,r):The probability of the link ei can work well at traffic ratio r (r = traffic load/link capacity). PR(ei,r)=(B0+B1 × r) × TR(ei) where B0 and B1 are shown in the Table 1.. Figure 1: Map the course to physical network In section 4.2, we will present how we solve the course planning problem.. 2. Related work. Several related research work [2] discusses the architecture of mobile-learning environments. The architecture of mobile learning environments is concerned with the development of the standards, and providing interoperability among heterogeneous systems and learning object reuse. Based on the standardization work, they propose open and distributed architectures that identify some common services (e.g. software service) for e-learning domains. Some mobile learning architecture has also integrated digital content topics in hybrid learning environments [3]. These research projects are concerned about digital representation such as three dimensional graphics and advanced animation techniques. They conduct analysis on the possibility of content that might be able to imitate or to substitute the teachers’ human existence itself. Other related works focus their efforts on e-learning theories. Like constructivist values for web-based instruction [4, 5]. In these research projects, their attempts are focused on trying to do convert traditional (face-to-face) courses to multimedia web-based courses. They focus on ways to encourage interactive learning and the use of motivational strategies. In their experiments, they train students using digital course and video tapes of an instructor answering questions and discussing course content. In another theory, role-base learning theory, they focus on familiarizing students with intellectual frameworks and establishing principles and general approaches. Our research focuses on the course planning scheme and formulate the successful. Table 1: Link probability. 3.2. Multi-access Probability. Multi-access-reliability involves formulating access for multiple data (courseware unit). After a request is sent by a user, the material provider may need to send several resources back. The access time of these resources may not be equal. The following formula is the definition of Multi-access Probability for Useri. M1, M2,…, Mn are the required resources.. Here we give an example as shown in Figure 2. In the following examples, we have four nodes. If every physical link probability is 0.9. A user in V3 requires M1, M2. The successful ratio to obtain M1 and M2 is R(U1|M1,M2) = 0.9×0.9+(1-0.9×0.9)×0.9×0.9= 0.972.. 221.
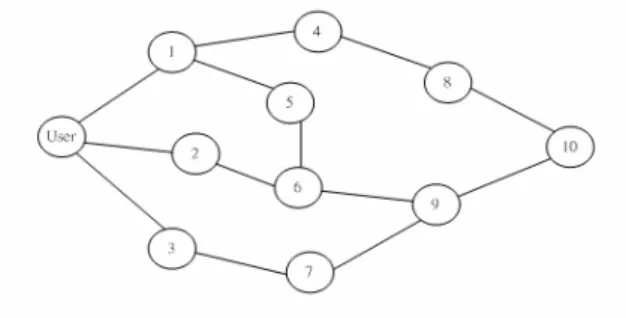
(3) Int. Computer Symposium, Dec. 15-17, 2004, Taipei, Taiwan.. nodes, we must use the summation of the product of the static remote media access probability of the neighbor node and its transition probability to represent the remote media access probability for the mobile environment. The RMAP is Remote Media Access Probability which formulates a remote user access the required courseware using the concept of moving patterns.. RMAP(U) = ∑ j (( Pi j k t ) × RMAP( N j )) Suppose the following: Figure 2: Four node example. In Figure 3, Assume user 1 came from E, and is now at F now. He needs media M1, M2, and M3 for. 3.3 Moving patterns.. his learning mission.. Moving patterns record users’ behaviors. This is achieved by using a method to mine the moving patterns from the previous data log. With the moving patterns, we can develop a data allocation scheme for proper allocation of personal and shared data. Table 2 and Table 3 are Moving frequency matrix and Transition probability matrix. Moving frequency matrix is used to recorded user’s behaviors. The Transition probability matrix is used to improve data allocation scheme.. Figure 3: RMAP pattern. Table 2: Moving frequency matrix count V1v2 V1v3 V2v1 V2v4 V3v1 V3v4 V4v2 v4v3. V1 200 250 0 0 0 0 250 350. V2 0 0 300 100 150 450 0 0. v3 0 0 200 400 350 50 0 0. v4 300 250 0 0 0 0 250 150. We need to compute the remote media access probability. V1 0.4 0.5 0 0 0 0 0.5 0.7. V2 0 0 0.6 0.2 0.3 0.9 0 0. v3 0 0 0.4 0.8 0.7 0.1 0 0. And. suppose. that. the. transition probability from EF to neighbors B,E,G,J are 0.2,0.3,0.3,0.2 respectively. Then RMAP(F) is formulated as follows.. Table 3: Transition Probability Matrix Pi,j,k,t V1v2 V1v3 V2v1 V2v4 V3v1 V3v4 V4v2 v4v3. RMAP(F).. 3.4 Data Allocation. v4 0.6 0.5 0 0 0 0 0.5 0.3. Distributed multimedia applications have played an important role in the recent advances in mobile learning environments. In such environments, storage volume can be quite large and as a result, we need to find a way to allocate courseware unit to improve the learning efficiency. Data allocation improves access reliability to the courseware units. The purpose of this is to find a way to allocate the course material appropriately in a real network environment. From this, we can provide a higher standard of service to subscribers. In Figure 4, the DMDB network is physical network and we use our data allocation scheme to allocate courseware into the physical network. The Data allocation strategy is as follows.. Since we take into account the probability that user may move from his current node to neighbor. 222.
(4) Int. Computer Symposium, Dec. 15-17, 2004, Taipei, Taiwan.. physical network topology, in other words from the logical view to the physical view. The reason for this is that, by doing so a network environment will provide better performance for learners to access course material. For example, Table 4 shows the entire contents of a math syllabus (calculus, linear algebra, discrete mathematics and so on). Each courseware unit has a capability indicator (Figure 2).. We propose using the「Bread First Search」 algorithm to traverse the graph below and transform it into a tree structure. The starting point is the user’s position.. Figure 4: DMDB network Figure 5 is the result after transforming the graph from the previous page into a tree structure. We then classify the media, and sequentially allocate the media into the physical network according to the defined order. Figure 6: The Capability Indicator structure Briefly, a capability indicator is used to describe a particular measurement (or capability factor a course provides) to the learner studying that a particular courseware unit and forms the basis for determining the capability for a learner to study another courseware unit. Each courseware unit can have several capability indicators (depicted in Figure 6). Capability indicators are useful because they assist us with the management of the courseware unit, for example, the distribution of difficulty of each courseware unit and so on. Thus, in order to complete a curriculum, a learner has to obtain a certain number of capability indicators. We thus use capability indicators in our proposed model and apply it to the directed graph. Table 4: A math program example. Figure 5: Tree structure of media These are the basic steps used to determine potential paths through nodes. In the physical view we used link probability to model the network, multi-access to model the access probability, and moving patterns to improve the data allocation scheme.. Node1 Node2 Node3 Node4 Node5 Node6 Node7 Node8. 4. Logical View. Logical View is concerned with learning sequence. The challenge is to use a course planning algorithm arranging a suitable learning sequence for a particular learner. In this section, we will apply the “minimum weight branching”[6] to solve course planning problems.. (course (course (course (course (course (course (course (course. 1) 2) 3) 4) 5) 6) 7) 8). Calculus Linear Algebra Discrete Mathematics Differential Equation Probability Theory Vector Analysis Concrete Mathematics Pattern Recognition. 4.2 Course Planning.. 4.1 The Learning sequence Environments.. In the section 4.1, we briefly introduced an overview to the concept of capability indicator relations, the application of minimum weight. Learning sequence environments introduces the concept of the learning environment and the concept of mapping real e-learning courseware unit to the. 223.
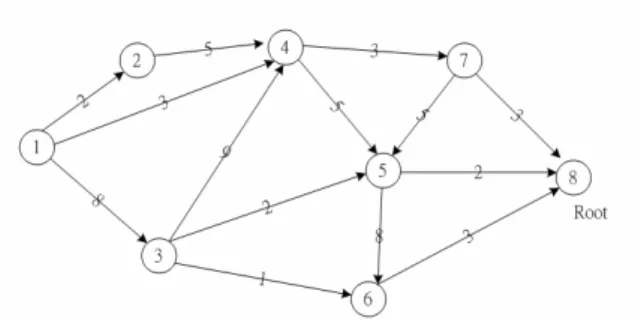
(5) Int. Computer Symposium, Dec. 15-17, 2004, Taipei, Taiwan.. branching, dispatching them into the physical network environment. In this section we explain, in detail, how to find a particular learning path (i.e. a sequence of courseware unit).. Figure 8: Relationship of courseware unit Figure 8 depicts the initial relationships between each courseware unit. After applying the minimum weight branching algorithm to find the best learning path, we obtain our result, depicted in Figure 9.. Figure 7: Idea of learning path Suppose we have a book shelf (depicted in Figure 7) in the subject of mathematics. The book shelf can be depicted as an entire courseware unit selection in the curriculum. Each courseware unit (for example, algebra, geometry, discrete mathematics, vector analysis and so on) contains one or more capability indicators. The idea of learning paths is to find some books (courseware unit) that need to be studied in order to obtain all the capability indicators that are required. In the example depicted in figure 4, the learner needs to study book 1, book 2 and book 3 in order to obtain the required capability indicators and complete his curriculum. The purpose of this learning path is to save the learner’s time by advising a proposed course plan. We give an example here. Suppose we would like to find the least difficult path for a learner to completing a curriculum. In this example, we use eight nodes (courses). The root is at node eight and we would like to find the learning sequence path using minimum weight branching. Figure 5 shows the relationships between courseware units. Each node represents one course. The direction of arrows depicts the capability indicator relations with respect to one another. Each arrow is depicted by a difficulty level. In this example, our goal is to find learning sequence path for each node to node eight. Suppose a learner is currently at node 1, he has the choice of choosing either node 2, node 3 or node 4 as possible next stage course. This process continues until the learner reaches node 8 and all possible paths to node 8 are exhausted. In total, there are 8 possible paths with varying difficulties to completing the curriculum. To find the best sequence (i.e. the path with the least difficulty); we apply the minimum weight branching algorithm.. Figure 9: Branching of the relations As a result, the best learning path for the learner at node 1 is node 1 -> node 4 -> node 7 -> node 8, and the difficulty is 9 (3+3+3) Here we state all the learning paths and their difficulties. z Learning path from node 1 is to take another 3 courses (in node 4, 7, 8), and the difficulty is 9(3+3+3). z Learning path from node 2 is to take another 3 courses (in node 4, 7, 8), and the difficulty is 11(5+3+3). The rest learning paths can be found as doing so by following the strategy we stated in the two steps we mentioned. We will not show all learning paths from all nodes to one another. Depending on where a learner is in the logical view, the minimum weight branching algorithm can be used effectively to find the best learning path to node 8.. 5. Conclusion. Here we summarize the issue we have mentioned before. In the Physical view, we use link probability and Multi-access Probability to formulate network reliability. In Logical view, we map the minimum weight branching to e-learning to suggest a learning sequence. Limitations for this research are. 224.
(6) Int. Computer Symposium, Dec. 15-17, 2004, Taipei, Taiwan.. that statistic data and physical network parameters must be ready before these methods can be used to solve them.. 6. References. [1]. Oriol Sallent, Jordi P’rez-Romero, Ramon August, and Ferran Casadevall, “Provisioning Multimedia Wireless Networks for Better Qos: RRM Strategies for 3G W-CDMA,” IEEE Comm. Magazine, pp.100-106, Feb 2003. [2]An update on the SimulNet educational platform. Towards standards-driven E-learning Anido, L.; Llamas, M.; Caeiro, M.; Santos, J.; Rodriguez, J.; Fernandez, M.J.; Education, IEEE Transactions on , Volume: 44 , Issue: 2 , May 2001 [3]The educational digital entities as a component of the new hybrid and learning school environment: expectations and speculations Anastasiades, P.;Advanced Learning Technologies, 2001. Proceedings. IEEE International Conference on , 6-8 Aug. 2001 [4]. S. Basagni, I. Chlamtac, V. Syrotiuk and B. Woodward, “A Distance Routing Effect Algorithm for Mobility (DREAM)”, in Proc. of ACM MobiComm, October 2002. [5]. C. Perkins and P. Bhagvat, “Highly Dynamic Destination-Sequenced Distance Vector Routing for Mobile Computers”, in Proc. of ACM SIGCOMM , October 1994. [6] Efficient implementations of bounded shortest multicast algorithm Gang Feng; Kia Mao; Pissinoul, N.; Computer Communications and Networks, 2002. Proceedings. Eleventh International Conference on , 14-16 Oct. 2002 [7] The Internet and the "learning by doing" strategy in the educational Advanced Learning Technologies, 2001. Proceedings. IEEE International Conference on, 6-8 Aug. 2001 [8] Mobile learning: a new paradigm in electronic learningChi-Hong Leung; Yuen-Yan Chan;Advanced Learning Technologies, 2003. Proceedings. The 3rd IEEE International Conference on , 9-11 July 2003 [9] Mobile Internet usability: what can 'mobile learning' learn from the past Uther, M.;Wireless and Mobile Technologies in Education, 2002. Proceedings. IEEE International Workshop on , 29-30 Aug. 2002 [10]A data allocation considering data availability in distributed database systems Seong-Jin Park; Doo-Kwon Baik; Parallel and Distributed Systems, 1997. Proceedings., 1997 International Conference on , 10-13 Dec. 1997. 225.
(7)
數據
相關文件
O.K., let’s study chiral phase transition. Quark
● In computer science, a data structure is a data organization, management, and storage format that enables efficient access and
Performance metrics, such as memory access time and communication latency, provide the basis for modeling the machine and thence for quantitative analysis of application performance..
name common laboratory apparatus (e.g., beaker, test tube, test-tube rack, glass rod, dropper, spatula, measuring cylinder, Bunsen burner, tripod, wire gauze and heat-proof
Using MS Access to design database, learning SQL commands and create forms and
We showed that the BCDM is a unifying model in that conceptual instances could be mapped into instances of five existing bitemporal representational data models: a first normal
MTL – multi-task learning for STM and LM, where they share the embedding layer PSEUDO – train an STM with labeled data, generate labels for unlabeled data, and retrain STM.
Biases in Pricing Continuously Monitored Options with Monte Carlo (continued).. • If all of the sampled prices are below the barrier, this sample path pays max(S(t n ) −
