Statistical Plate Recognition System
Shen-Zheng Wang, Student Member, IEEE, and Hsi-Jian Lee
Abstract—This paper describes a plate recognition system that can process images rapidly at high accuracy rates. This system is designed to meet the requirements of performance, computational speed, and adaptation for vehicle surveillance applications, such as stolen car detection systems. These requirements are satisfied by adopting a cascade framework, utilizing plate characteristics, and developing fast one-pass algorithms. Our system is composed of three main cascading modules for plate detection, character segmentation, and postprocessing. Each module is further de-composed into several cascading procedures, which are de-composed of successively more complex rejecters. The first module rapidly rejects a majority of nonplate regions by using low computational gradient features and a one-pass scanning algorithm followed by heavy computational statistical rejecters. The second module rejects a majority of noncharacter regions in a similar manner. A peak-valley analysis algorithm is proposed to rapidly detect all promising candidates of character regions. The third module eliminates the plate characters that do not satisfy the plate specifi-cations. In our experiments, the system can recognize plates over 38 frames per second with a resolution of 640 480 pixels on a 3-GHz Intel Pentium 4 personal computer.
Index Terms—AdaBoost, cascade framework, Haar-like fea-tures, plate recognition, real-time systems.
I. INTRODUCTION
I
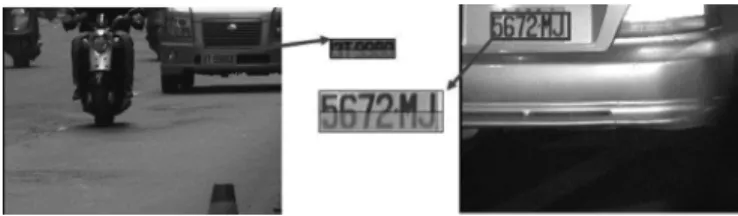
NFORMATION technology (I.T.) has gained increasing im-portance for visual surveillance applications in portal con-trolling, traffic monitoring, stolen car detection, etc. In these ap-plications, plate numbers are important for recording, analyzing, and reporting surveillance targets. Techniques of computer vi-sion can be used in captured images to detect and recognize such plates. The images can be divided into two different types: still images and frame sequences. In the first type, a still image from a camera can be designed explicitly to process complex scenes, such as multiple plates, that exist in different locations of an image. In the second type, temporal information could be used to identify plates more robustly. Fig. 1 shows examples of the two image types in surveillance applications. Fig. 1(a) shows a still image captured by a camera controlled by the police, whileManuscript received October 24, 2006; revised January 23, 2007. This work was supported in part by the National Science Council of Taiwan, R.O.C., under Grant NSC 93-2213-E-320-002 and in part by the Ministry of Economic Affairs, R.O.C., under Grant 95-EC-17-A-02-S1-032. The associate editor coordinating the review of this manuscript and approving it for publication was Prof. Vijaya Kumar Bhagavatula.
S.-Z. Wang is with the Department of Computer Science, National Chiao-Tung University, Hsinchu, Taiwan, R.O.C. (e-mail: [email protected]). H.-J. Lee is with the Department of Medical Informatics, Tzu-Chi University, Hualien 970, Taiwan, R.O.C. (e-mail: [email protected]).
Color versions of one or more of the figures in this paper are available online at http://ieeexplore.ieee.org.
Digital Object Identifier 10.1109/TIFS.2007.897251
Fig. 1(b) shows several frames from a capturing device installed in a police patrol car. In both types of images, variations in plate types or environments pose problems in the detection and recog-nition of plates. For instance, the plate sizes may change sig-nificantly in different inputs because the target vehicle or the capturing device moves continuously. All variations under con-sideration are summarized as follows:
• Plate variations. i) Location
* Plates may exist in different locations of an input image.
ii) Quantity
* An input image may contain many or no plates. iii) Size
* Plates with different sizes may exist in an image or different images.
iv) Colors of plate characters and backgrounds
* Plates may have various characters and back-ground colors due to different plate types (taxis, private cars, etc.) or capturing devices.
v) Others
* In addition to characters, a plate may contain adornments, such as frames and screws.
• Environment variations. i) Illumination
* Different types of illumination may occur in input images, mainly due to environmental lighting and vehicle headlights.
ii) Plate-like background patterns
* A background may contain patterns similar to plates, such as numbers stamped on a vehicle, bumpers with vertical patterns, and textured floors.
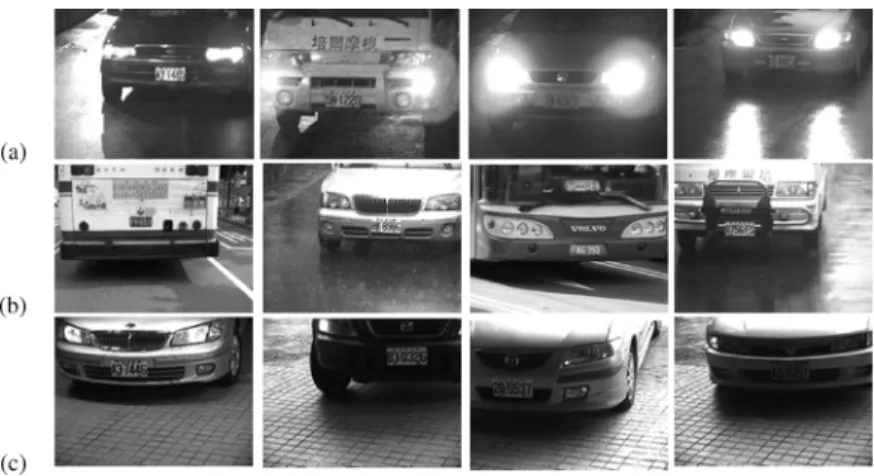
Fig. 2 shows several examples of variations that were tested in this study. The headlights of different vehicles at night are shown in Fig. 2(a), and examples of environmental lighting in different weather conditions are shown in Fig. 2(b). Plate-like background patterns on a tiled floor are shown in Fig. 2(c). To develop a plate recognition system for surveillance, three requirements must be satisfied. The first is the high-accuracy performance; for instance, the accuracy rate measured as the weighted sum of the true positive rate (TPR) and the false pos-itive rate (FPR) should be above 95%. The rate should be mea-sured from a real surveillance environment 24 hours a day with variations in plate types and environments. The second require-ment is to process all frames from an input stream in real time because successive frames may contain temporal plate informa-tion useful in surveillance applicainforma-tions. Moreover, plates may not be recognized in certain frames due to unexpected events;
Fig. 1. Two image categories in surveillance applications. (a) A still image from a camera and (b) nine successive frames in a video stream.
Fig. 2. Examples of variations in plate types and environments. (a) Different vehicle headlights. (b) Different types of environment lighting. (c) Plate-like back-ground.
for example, the plates may be covered by other passing vehicles or appear significantly blurred when they are out of focus. From the successively recognized results, certain strategies, such as voting, could be used to increase the accuracy rate. Currently, a common input stream may arrive at a standard frame rate of approximately 30 f/s (frames per second) and a resolution of 640 480 pixels. Thus, a practical plate recognition system should function at over 30 f/s; for example, the real-time system in this study, with a high dimensional input (640 480 pixels). The third requirement is the adaptability. In real-world envi-ronments, unfamiliar plate types or background generally exist. When new plate types or backgrounds arise, the plate recogni-tion system should have the ability to recognize them correctly after learning the variation in plates and nonplates automati-cally.
In the last decade, many researchers have focused heavily on plate recognition. In general, three major modules are used in image-based plate recognition systems: 1) plate detection; 2) plate character segmentation; and 3) plate character recog-nition. Many methods ranging from simple techniques, such as corner template matching [1], Hough transform [2]–[4], histogram analysis [5], [6], and morphological operations [7], to sophisticated mechanisms, such as vector quantization (VQ) [8], neural networks [9], [10], mean shift [11], support vector machine [10], or likelihood ratio [12] have been developed to detect plates based on the features of plate characteristics or statistical representations including shape [5], [12], symmetry [13], aspect ratio [5], color of HSI [14], [10], color of
[13], and edges [5], [12]. In plate character segmentation and recognition modules, the proposed methods [6], [9], [15]–[17] generally use approaches that are similar to those used in
plate detection; however, these methods focus on character characteristics.
Simple techniques could be applicable to cases in which prior knowledge, such as the defined color, is available; however, these techniques are probably not very robust and accurate for the variations in plates or environments. Statistical mechanisms provide more robust and accurate representations of plates and plate characters. However, an important problem of the statis-tical type of features or techniques is that the computational load is high when a statistical mechanism is applied to all input candidates (more than 100 000 units). Instead of explicitly seg-menting the characters in detected plates, Amit et al. [12] use a coarse-to-fine approach for both the detection and recognition of characters on license plates. Although they achieve high recog-nition rates, the statistical technique requires 3.5 s to process an input image, and it does not satisfy the requirement of surveil-lance applications. Another problem of the proposed algorithms is that there is a tradeoff between multiscale ability and the computational effect. Most of them compute a multiscale image pyramid, which is complicated and time-consuming to detect targets of a particular size.
It is a challenging task to develop a plate recognition system that satisfies all three requirements. This is because it is difficult to adjust the existing approaches to achieve the objective of a real-time system with a high TPR while maintaining a low FPR in various plate types or environments. The system may satisfy the minimum real-time criterion (for example, 15 f/s) only for one module, such as plate detection [18]. However, it is difficult to meet the real-time requirement in the entire plate recognition system.
To account for the lack of real-time consideration in the overall system, we propose a cascade framework based on
detect regions containing plate characters and segment these plate characters precisely and compactly. The compactness of the results after applying our one-pass algorithm would avoid the use of additional removal procedures. Finally, an extended Haar-like feature set that can be extracted in one-pass scanning is proposed to understand the discriminating characteristics between plates and nonplates and improve the processing speed of feature extraction.
The remainder of this paper is organized as follows. Section II presents the cascade plate recognition system, and Section III shows the procedure of plate region detection. Section IV describes plate character segmentation and recognition. In Section V, some experimental results are presented. In most input images, although several plate candidates are detected, only the real candidate is recognized and outputted by our system. Section VI concludes this study.
II. CASCADEPLATERECOGNITIONSYSTEM
To achieve a high accuracy rate with variations in plate types or environments, spatial features and temporal information could be used simultaneously to detect and recognize plates. However, as more features are measured, the computational load may increase significantly. A tradeoff then exists in the plate recognition system between discrimination and compu-tation. We must design a system that satisfies the constraints in various environments simultaneously. However, even while detecting a single plate type, it is still difficult to detect all plates without false positives. Currently, no approach achieves a negligible FPR in complex environments while maintaining an extremely high TPR, that is, without missing plates.
A. Fundamentals of the System
To design a plate recognition system that satisfies the three requirements, we explore the following three strategies.
1) Cascade Framework: The natural control parameters for
balancing discrimination and computation are the complex-ities of feature extraction and classification. The conceptual boundary between feature extraction and classification is rather arbitrary. An ideal feature extractor would distinctly represent positive and negative inputs that make the classification process trivial; conversely, a strong classification process would not require a sophisticated feature extractor. However, it would be computationally demanding or impossible to distinguish between features that are invariant to irrelevant transformations of the input. When emphasis is placed on the computational load, it is apparently efficient to reject a majority of negatives immediately with a single relatively inexpensive process. By concatenation of rejecting processes with increasing com-plexity, the overall computational load of the system can be reduced because not all input candidates are processed by the more heavy-computational processes.
Based on the above reasoning, we consider two coarse-to-fine computational designs that can dramatically reduce the compu-tation, while ensuring that the performance of the system is high. First, a major portion of the searching space may be quickly
increasingly more feature dimensions are adopted to correctly discriminate between positives and negatives. The two designs allow quick rejection of incorrect input candidates, while more computation time is used for promising candidates of plates or character regions. To produce the two designs, a cascade framework is built on successively more complex processes, termed rejecters. In comparison with a process with a high ac-curacy rate, a rejecter only requires slightly higher acac-curacy than chance and has minimal computational load. The key con-straints of such a rejecter are high TPR and relatively low FPR, for instance, less than 50%. In other words, all, or almost all, positive targets must be preserved after they are processed by the rejecter.
The framework is known as a cascade because each rejecter only accepts the outputs from the previous one. Based on re-jecting negatives in the shortest possible time using simpler decision rules, the average computational speed of the system would be faster than that obtained by adopting the more com-plex processes for all input candidates.
2) Applications of Plate Characteristics: Although
vari-ations exist in different types of plates, plate characteristics ranging from low-level gradient features to high-level contex-tual meanings are summarized as follows.
1) The color of a plate character is always different from that of the background.
2) Plate characters are arranged in a sequence known as plate character lines.
3) A plate is mainly composed of plate characters. 4) Plate characters usually satisfy the plate specifications;
for instance, the English alphabet could not be used in certain parts of the plate or characters have specific width-to-height ratios, depending on the location of the vehicle.
3) Computational Reduction in Algorithmic Design: In
ad-dition to the cascade framework and the plate characteristics, the system could not function at high speed without appropriate algorithms. Duplicate memory access and computation would occur in different processes or even in the same process. In the plate recognition system, we propose an algorithm that scans the entire input image only once but can extract all plate candidates. Moreover, the values of the features could be calculated at con-stant time using several acceleration tables, which will be gen-erated in a single scanning process, as mentioned in Sections III and IV.
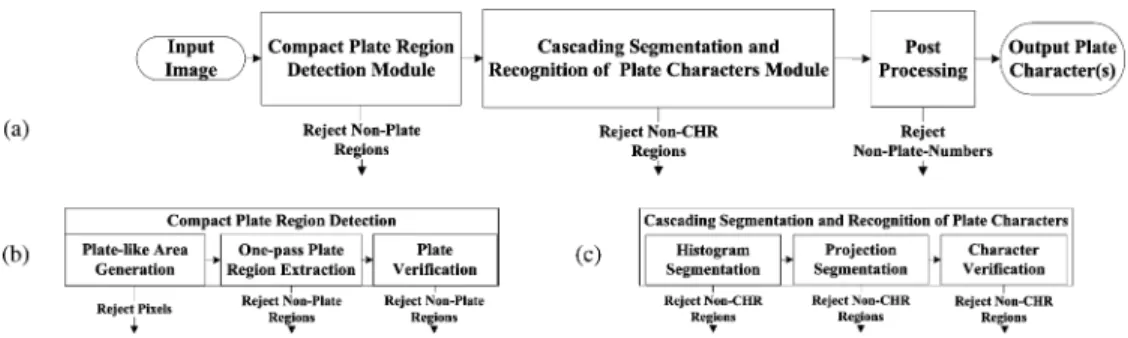
Overview of the System: Based on the three strategies, the
system, as presented in Fig. 3(a), is composed of three cascaded modules for plate detection, character segmentation and recog-nition, and postprocessing. The first module shown in Fig. 3(b) aims to reduce the searching space of the plates by three cas-cading procedures. The first procedure eliminates most of the noncharacter regions by the low computational features, gradi-ents, according to plate characteristic 1). The second procedure extracts the promising plate regions by a one-pass extraction al-gorithm according to plate characteristic 2). The third proce-dure rapidly rejects a majority of the nonplate regions by using
Fig. 3. Schematic diagram of the cascade plate recognition system.
complex rejecters with increasing complexity and higher dimen-sions of statistical features according to plate characteristic 3). Moreover, these rejecters could be automatically learned by a boosting algorithm from the characteristics between the plate and nonplate regions. In the second module, shown in Fig. 3(c), three procedures are designed for the aforementioned scenario in order to reduce the searching space of the characters. To ex-tract character candidates rapidly, a peak-valley analysis algo-rithm is proposed to detect all promising segments from inten-sity histograms and projection profiles in the first and second procedures, respectively. Noncharacter candidates would be re-jected quickly by the rejecters, which are automatically trained with character candidates detected from the preceding proce-dures. Then, the remaining character candidates will be rec-ognized by an optical character recognizer (OCR). In the last module, the recognized plate characters that do not satisfy the plate specifications are discarded. The plate specifications used for the experimental data are defined as follows.
• PLATE .
• .
• .
• .
• .
• Alphabet Alphabet Alphabet Number Number Alphabet.
• Alphabet Number.
• Number Number.
• Number.
• Number.
In general, the plate recognition system is a cascade of rejecters, each of which focuses on the rejection of noncharacters, non-plate character lines, or nonnon-plates.
B. Discussion on the System
For the plate recognition system, the three requirements for surveillance applications are analyzed below.
1) Performance: To explain the performance requirement,
we make the following three assumptions: 1) the total number of rejecters is 20, 2) the TPR of each rejecter is 99.9%, and 3) the FPR of each rejecter is 40%. Then, the final TPR and FPR of the entire cascade plate recognition system are 98%( ) and ( ), respectively. The final accuracy rate is 99%; it is measured by the following formula:
AccuracyRate (1)
where TPR is the rate of positives that are correctly recognized; FPR, the rate of negatives that are incorrectly recognized; and
, the weighting coefficient, for example, 0.5.
2) Computational Speed: Under the assumption that most of
the input candidates are negative, the computational speed of the entire system can be improved because a majority of the nega-tive candidates may be rejected by the initial rejecters using sim-pler decision rules with a low computational load. The strategy is referred to as computational risk reduction. Consider the fol-lowing experimental case as an example: In a 640 480 input image, the total number of plate region candidates for detecting a minimum recognizable plate size, 60 15, is 270,746. In our experiments, approximately 20 candidates of the plate regions remain after the application of the first two procedures in the plate detection module. After verification by the plate verifica-tion procedure, only four candidates remain for processing in the following module. In addition to computational risk reduction, duplicate memory access can be avoided by a one-pass plate de-tection algorithm and a peak-valley analysis algorithm, which will be described in Sections III and IV, respectively.
Moreover, to reduce duplicate computations, several feature acceleration tables can be created in one scanning procedure and can be used in plate verification, plate character segmenta-tion, and character verification procedures. It is not necessary to recalculate the area summation operations required in the three procedures, and they can be measured at constant time. Thus, each module of the plate recognition system could func-tion faster than 30 f/s to satisfy the real-time requirement of the overall system.
3) Adaptation: To measure the variations between positives
and negatives, our verification procedures are based on a cas-cade classifier proposed by Viola [19] and extended by Lienhart [20]. Skewed Haar-like features are proposed to represent plates or characters in plate recognition systems for surveillance ap-plications. In the learning phase of the verification procedures, an adaptive machine learning mechanism, AdaBoost [21], in-creases the classification performance by selecting a few domi-nant features that satisfy the criteria of the TPR and FPR. More-over, a postprocessing module is developed to filter the nonplate characters in order to satisfy the plate specifications.
III. COMPACTPLATEREGIONDETECTION
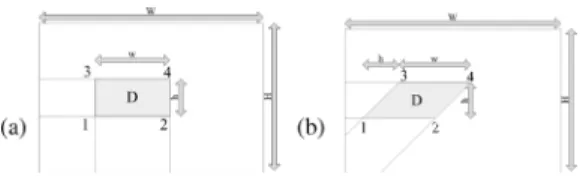
The plate region contains plate characters and various adorn-ments, such as frames, screws, and subtitles. This type of region is called the “normal plate region.” The presence of adornments
Fig. 4. Patterns of (a) normal plate regions and (b) compact plate regions.
Fig. 5. Different gradient results of an input image: (a) Original image. (b) Sobel gradients. (c) Vertical gradients. (d) Horizontal gradients.
increases the difficulties in plate character segmentation because the characters and adornments may contact each other in the captured input. It may be difficult to correctly recognize certain adornments, such as screws and emblems, because they may be very small and blurred; moreover, they do not provide dis-tinguishing information for plate recognition. Therefore, these adornments should be discarded before plate character segmen-tation and recognition. However, the use of additional proce-dures for removing the adornment increases the computation time of the system. In this study, we propose to detect compact plate regions (i.e., the regions that bound the top and bottom of plate characters, in the initial stage to avoid the use of additional removal procedures). Fig. 4 shows the patterns of normal plate regions and compact plate regions.
A. Generation of Plate Region Candidates
Irrespective of the plate type, according to plate character-istic 1), the color of a plate character is always different from that of the background. Therefore, plate regions may be distin-guished from most nonplate regions by using gradient features. However, horizontal gradients are not distinctive features be-cause plates may usually have contact with some other parts, such as bumpers, which also have strong horizontal gradients. To reduce the searching space effectively, only vertical gradients are used in this step. The vertical gradients in Fig. 5(c) represent the plate regions that appear clearer than others. After the ver-tical gradient operation, pixels, whose gradient values are higher than a threshold, are used as the pixels of plate candidates. The threshold is obtained automatically from Otsu’s method [22] and the thresholding map is calleed “ .”
B. Extraction of Compact Plate Regions
1) Nonplate Run Suppression: To extract the compact plate
regions with precision, four types of nonplate runs should be suppressed. Here, a “plate run” is defined as the successive pixels of plate candidates in , while a “non-plate run” is defined as successive pixels of non-plate candidates. Let and denote the width and height of a compact plate region, respectively. We define suppressed nonplate runs as follows:
1) Vertical plate runs higher than . 2) Horizontal plate runs longer than .
3) Plate runs located between two nonplate runs longer than the maximum width of plate characters.
4) Small isolated plate regions.
Runs of types 1) and 2) are mainly caused by plate frames or bumpers, while those of types 3) and 4) are generated by screws, noises, and other parts connected with plate characters.
2) Compact Plate Region Extraction: After the nonplate runs
are suppressed, the remaining plate runs may not comprise a set and they may be scattered significantly, thereby making it dif-ficult to compose compact plate regions. A horizontal smearing technique is then used to group two plate runs whose distance is less than the criterion into compact plate regions. The smearing criterion could be determined from the plate charac-teristic 2). Since the distance between two plate runs should not exceed the maximum width of the plate characters, is de-fined as , where indicates the number of plate char-acters. In our experiments, the range of is set to four times according to the plate specifications, while is selected from 15 pixels (minimal height of the recognizable plate size) to the quarter-width of the input image. Finally, the connected components, whose size exceeds a threshold defined by type 4) suppression, are extracted as candidates of the compact plate re-gions. Moreover, the map should be restored in the first step of every iteration because it would be modified by the nonplate run suppression. The extraction steps are summarized in Algo-rithm 1.
Algorithm 1: Multipass algorithm for extracting compact plate
regions.
Data: .
Result: candidates of compact plate regions. foreach ( , ) in and do
; 1. Restore the map, .
2. Remove vertical plate runs higher than (type 1) suppression).
3. Remove horizontal plate runs longer than (type 2) suppression).
4. Remove horizontal plate runs which are shorter than and located between two horizontal nonplate runs longer than (type 3) suppression).
5. Smear with the parameter .
6. Remove regions smaller than (type 4) suppression).
7. Extract connected components.
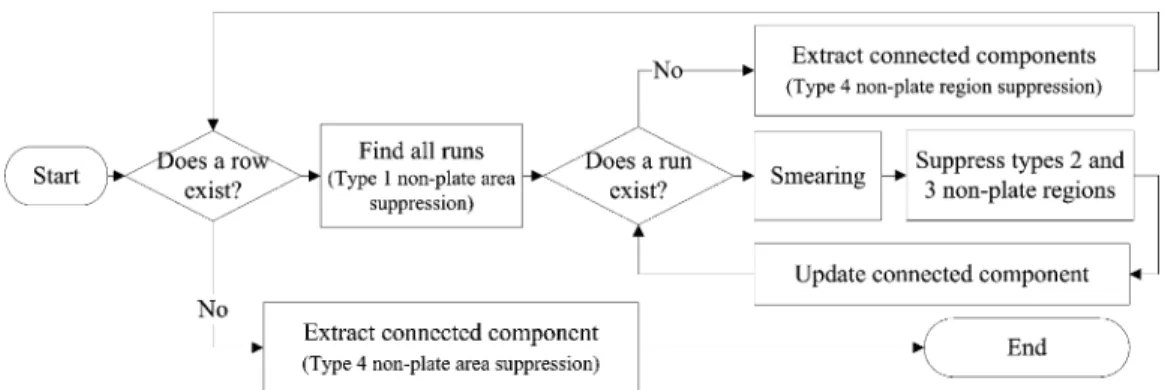
Fig. 6. Schematic diagram of the one-pass algorithm for extracting compact plate regions.
3) One-Pass Extraction of Compact Plate Regions: For each
size of compact plate regions, the procedure of the compact plate region extraction scans the input image seven times when the extraction algorithm is executed. In this study, we propose a one-pass algorithm for the extraction of compact plate regions, as illustrated in Fig. 6. During one-pass scanning, type 2) sup-pression is performed in the step of run determination described in Algorithm 2.
Algorithm 2: Algorithm for run determination, FindAllRuns. Data: the of .
Result: plate and nonplate runs
Initialize an array Acc[width of .
foreach in the do. if then
else
end
if and then
update the plate run
else
update the non-plate run (Type 2 suppression)
end end
and type 4) suppression is performed in connected compo-nent extraction. Smearing and type 2) and 3) suppressions are performed based on the run information without modifying the image. The one-pass extraction algorithm is described in detail in Algorithm 3.
Algorithm 3: One-pass scanning algorithm for extracting
compact plate regions.
Data:
Result: candidates of compact plate regions foreach row in the image do
FindAllRuns() ;
foreach do
; ;
if then group and // Smearing;
if then continue to process next run //
Type 1 suppression;
if and and
then
continue to process next run // Type 3 suppression;
end
// Type 4 suppression;
update corresponding connected components information when is connected with runs of the previous row
end
extract connected components whose sizes are larger than and are not updated at previous procedures;
end
, where implies the distance from the end of to the start of . Fig. 7 shows an example in which a candidate of the compact plate region is extracted explicitly by the application of the algorithm.
C. Plate Verification
After the plate regions are extracted based on low-level gradient features, background patterns, such as bumpers or texture floors, may not be rejected. The properties of a compact plate region are different from those of a nonplate region. A significant property is that a sequence of character patterns will exist in compact plate regions but not in most of the nonplate regions. However, it is difficult to determine all heuristic rules for all variations in different types of plate and nonplate regions.
Fig. 7. Example in which the one-pass plate extraction algorithm is applied. (a) Original image. (b)G of plate candidates. (c) Detected compact plate region.
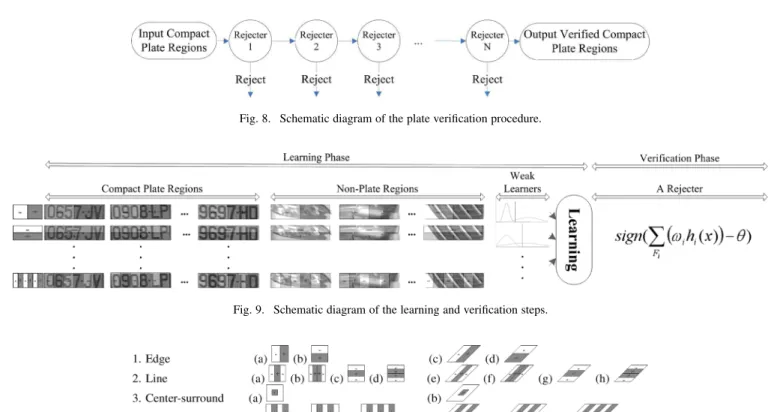
Fig. 8. Schematic diagram of the plate verification procedure.
Fig. 9. Schematic diagram of the learning and verification steps.
Fig. 10. Feature prototypes of upright and skewed Haar-like features used in our system.
To reject nonplates quickly and robustly, we adopt a cascade classifier [19] and a learning mechanism, AdaBoost [21], to determine the minimum dominant features from our feature pool (Section III-CI) and the statistical weak learners (Section III-C2), using the samples of compact plate regions and nonplate ones. As shown in Fig. 9, the final rejecter is composed of all selected weak learners , combined with the weight , and the threshold . As shown in Fig. 8, plate verification is performed by cascading rejecters with increasing complexity to reject nonplate regions in the shortest possible time. The verification procedure is described in detail in the following subsections.
1) Feature Extraction: To verify the plates correctly, instead
of using raw pixel values, features are extracted to minimize the within-class variability while maximizing the between-class variability. In response to significant characteristics originating from variations in the plate characters, our feature pool is based on the Haar-like features in Oren [23] and the fast computation schemes proposed by Viola [19]. To represent all discriminating features, we extract overcomplete Haar-like features in all sizes. More specifically, the values of 20 feature prototypes shown in Fig. 10, which include four edge features, eight line features, two center-surround features, and six plate character-line
fea-tures are extracted to represent compact plate regions and non-plate ones. Their prototypes are classified into two types: upright and skewed. As discussed later, our features can be computed at any position and scale in the same constant time; only one scan-ning procedure is required.
Upright Haar-Like Features: Haar-like features, which
rep-resent regional brightness differences, are reminiscent of Haar basis functions. As shown in the left part of Fig. 9, Haar-like features are computed by subtracting the weighted sum of the pixels covered by the dark rectangle from that covered by the white rectangle. For a normalized input region of 32 8, the total number of upright Haar-like features extracted in this stage is 175 256. In general, the total number of upright feature pro-totypes with a size of in an image of size could be defined as
(2)
where and denote the maximum
scaling factors in the horizontal and vertical directions, respec-tively. This formula is explained below.
Fig. 11. Acceleration tables: (a) SAT and (b) SSAT.
When sliding along the row, the feature size could be , or . The feature size can be measured from
When sliding along the column, the feature size could be , or . The feature size can be measured from
Skewed Haar-Like Features: To represent skewed plate
char-acters, we extend the basic Haar-like features by an efficient set of horizontal skewed features. The number of skewed feature types with size could be observed as an upright feature type with a size of .
Fast Computation Schemes: One problem of these features is
that the computational effort increases when a window sweeps the entire input region at various scales. To reduce duplicate summation operations, each used feature can be computed by the acceleration tables, summed area table (SAT) [19], [24], or skewed summed area table (SSAT), as shown in Fig. 11. In the SAT, the value at location contains the sum of the pixels above and to the left of
(3)
where is the value of the input image.
In the SSAT, the value at location of SSAT contains the sum of the pixels of the indefinite quadrangle that begins at the righthand corner at and extends to the boundaries of the image
(4)
where is the value of the input image. In this study, we propose to calculate the values of SSAT in one-pass by the fol-lowing formula:
with
Then, each value of the summation in a quadrilateral region can be measured by two additions and one subtraction indepen-dent of the position or scale. For example, the gray region de-noted by in Fig. 11 can be measured by
(5)
where are the values in the SAT or SSAT.
Thereafter, all values of the Haar-like features can be measured at constant time from the acceleration tables. In the system, these acceleration tables are also created in the one-pass extraction algorithm of the compact plate regions without scanning the image again in subsequent procedures.
2) Feature Dimension Reduction: More than 100 000
quadrilateral features are associated with each region of plate candidates. Although each feature could be computed effi-ciently, the hypothesis space was still very large and, therefore, it was difficult to satisfy the real-time requirement of the system. In this study, we attempt to determine a dominant subset of the exhaustive Haar-like features that reject the nonplates very effectively. For this purpose, we use boosting techniques that could help improve the accuracy of any given learning algo-rithm. There are many variations in basic boosting. AdaBoost (adaptive boosting) [21], which is the most popular boosting technique, allows the designer to continue adding weak learners until some desired low training error has been achieved.
AdaBoost: The main concept of AdaBoost is to assign a
weight to each sample of the learning set. In the beginning, all weights are equal; however, in every iteration, the weak learner returns a hypothesis, and the weights of all samples classified incorrectly by that hypothesis are increased. The weak learner is then forced to focus on the difficult samples of the learning set. The final hypothesis is a combination of the hypotheses of all iterations, namely, a weighted majority vote, where hy-potheses with a lower classification error have higher weights. The AdaBoost algorithm is summarized in Algorithm 4.
Algorithm 4. Algorithm of AdaBoost.
Data: Given samples , where , 1 for negative and positive samples, respectively.
Result: The final classifier
.
Initialize weights for , 1,
respectively, where and are the number of negatives and positives, respectively.
for do
1. Train one weak classifier for each feature using ,
with error .
2. Choose , where (i.e.,
Fig. 12. Schematic diagram of the learning phase:f denotes the maximum acceptable FPR per stage; t, the minimum acceptable TPR per stage; F , the overall false positive rate;FPR is the false positive rate at stage i; and TPR , the true positive rate of stages i.
3. Update the weights , where
if sample is classified correctly, otherwise, and .
4. Normalize so that is
a distribution.
end
Form the final classifier as if
otherwise. (6)
Learning Procedure: In the learning phase, the feature
di-mension in a rejecter and the number of rejecters are automat-ically determined by the AdaBoost learning algorithm and the criteria satisfying the required TPR and FPR. As shown in the loop procedure in the right side of Fig. 12, the learning pro-cedure constructs cascading rejecters by searching the set of possible features and returns the feature with the lowest clas-sification error iteratively. For each feature, the weak learner determines the optimal classification function that has the min-imum number of misclassified samples. The learner is termed weak because we do not expect to classify the training data ef-fectively (i.e., it may only classify the training data correctly 51% of the time). Therefore, a weak classifier consists of a feature in which is defined as a threshold-type function with a boolean-valued output that indicates whether is positive or negative. Here, is a 32 8 image of the normal-ized regions of the plate candidates. The formal expression of a
threshold-type function is , where is
the threshold. Learning samples are then reweighted in order to emphasize the false negatives and positives by previous learned classifiers. The final rejecter takes the weighted combination of weak classifiers followed by a threshold. In each iteration of boosting:
• evaluate each quadrilateral feature (a weak classifier) of each input training sample;
• select the best threshold for each weak classifier; • select the best weak classifier (feature) and the threshold; • reweight the samples.
Finally, the number of rejecters is determined when the overall FPR is satisfied, as shown in the loop procedure in the left part of Fig. 12.
D. Multiscale Implementation
Scale selection is a fundamental problem in computer vision and a key bottleneck for object detection algorithms. To increase
Fig. 13. Schematic diagram of the extraction of one Haar-like feature (12 2) from two compact plate regions.
the speed of detecting variant plate sizes, we scale our detector in the parameter space ( and ) without spending compu-tational effort on scaling the input image, as in the case of other pyramid searching techniques. Moreover, without normalizing the input plate candidates, the quadrilateral features used for plate verification are measured in proportion to the extracted plate regions because these features are rather invariant to the variations in the plate size and shape. As shown in Fig. 13, the left image is detected with pixels and pixels, while the right image is detected with pixels and pixels. The two images in the middle show the results of one Haar-like feature measurements of the compact plate re-gions detected from the two input images.
IV. CASCADING SEGMENTATION AND
RECOGNITION OFPLATECHARACTERS
Three procedures are developed in a cascade to segment and recognize the plate characters. First, low-computational histogram features are adopted in the first two procedures to extract promising plate character candidates. Moreover, to segment characters effectively with different variations, such as illumination changing on a plate or the variant numbers of plate characters, a new segmentation approach is proposed based on peak-valley analysis in conjunction with heuristics that determine the potential segments. In the third procedure, heavy-computational statistical Haar-like features are selected to reject noncharacter regions robustly. The remaining character regions are recognized by an OCR.
A. Plate Character Segmentation
A compact plate region may contain two types of plate acters: distinct and indistinct. A distinct character is a plate char-acter that can be separated from the plate region on the basis of thresholding from gray values, while an indistinct character is connected to the other ones. Four compact plate regions are shown in Fig. 14(a). The distinct characters extracted as con-nected components after a certain values of thresholding are
Fig. 14. Patterns of (a) compact plate regions, (b) distinct characters, and (c) indistinct characters.
Fig. 15. Inevident difference between the colors of the characters and the background. (a) Compact plate region. (b) Histogram. (c) Binary representation after thresholding by Otsu’s method.
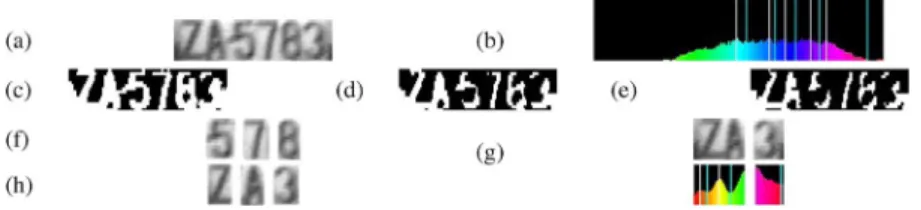
Fig. 16. One segmentation result: (a) Original compact plate region, (b) histogram of image (a) where peaks and valleys are indicated by white and gray lines, respectively; (c)-(e) three thresholding results with three different peak values—from low to high; (f) indistinct characters detected by histogram segmentation; (g) distinct characters detected by histogram segmentation; (h) projection profile of (f); (i) single characters detected by projection segmentation.
exhibited in Fig. 14(b), and the indistinct characters are pre-sented in Fig. 14(c). In most cases, the plate characters would be distinct, which will be extracted first to avoid the use of ad-ditional splitting procedures. In indistinct character regions, the region candidates of single characters are determined by projec-tion analysis. For measuring the projecprojec-tion effectively, we use an additional acceleration table—PSAT—to avoid the recompu-tation of the summation operations during the projection. The value at location in the PSAT is the sum of the pixels above . Each value in the projection histogram could be calculated by one subtraction operation.
1) Searching for Natural Segmentation Points: It is
gener-ally difficult to determine optimum thresholds during histogram segmentation or projection segmentation because the difference between the color of the characters and the background is usu-ally not evident. For example, a compact plate region with indis-tinct colors between the characters and the background is shown in Fig. 15(a), where the histogram is displayed in Fig. 15(b), where the white line represents the threshold value detected by Otsu’s method. The result obtained after thresholding by Otsu’s method is presented in Fig. 15(c), in which only one distinct character—“7”—could be detected after connected-component extraction. Other characters, such as “5” or “8,” would be ex-tracted by other thresholds.
With the assumption that each character is composed of pixels with similar colors, the potential thresholds to separate distinct characters from others would occur in a valley of the histogram for the plates with light-colored characters or in a peak for the other plates with dark-colored characters. After thresholding, the connected components are selected as candidates of distinct characters when their regions satisfy plate characteristic 4), for example, the width to height ratio of 0.5. To segment the indis-tinct characters in the remaining regions, we propose to use the projection profile to detect all promising segment points, which would exist in the local peaks or valleys of the projection profile according to the change from the plate characters to the back-ground.
Certain local peaks (white lines) and valleys (gray lines) of the histogram are shown in Fig. 16(b), and three results ob-tained after thresholding with different peak values are shown in Fig. 16(c)–(e). The distinct character, “7,” would be extracted from the connected components of Fig. 16(c) and the others, “5” and “8,” could be extracted from Fig. 16(d). All of the ex-tracted distinct characters—“5,” “7,” and “8”—are displayed in Fig. 16(f). The character representation after thresholding with a lower threshold would be more fragmented than that shown in Fig. 16(e); this shows that other plate characters marked as indistinct characters shown in Fig. 16(g) could not be extracted effectively at this moment. The lower part of Fig. 16(g) shows the projection profile of the upper part and the corresponding peaks and valleys. Using the peak or valley values for segmen-tation, we could separate all single characters from the indistinct characters, as shown in Fig. 16(h).
2) Searching for Special Segmentation Points: Some
nat-ural segmentation points are highly concentrated or dispersed according to the degree of noise or different combinations of characters. The high concentration of segmentation points ap-pears usually in the middle of thin connected characters such as “H,” “N,” or “U.” To reduce the number of character candidates, we select only the regions that satisfy plate characteristic 4); for example, regions with a width-to-height ratio of 0.5. The seg-mentation points are dispersed when the character regions are not segmented exactly because these points would not exist in the boundaries of characters such as “T” or “L.” For example, a valley point would be detected at the middle of the “T” pro-jection or at the left of the “L” propro-jection. To improve the per-formance of projection segmentation, a segmentation point is also located in the middle of two detected segmentation points whose distance is greater than .
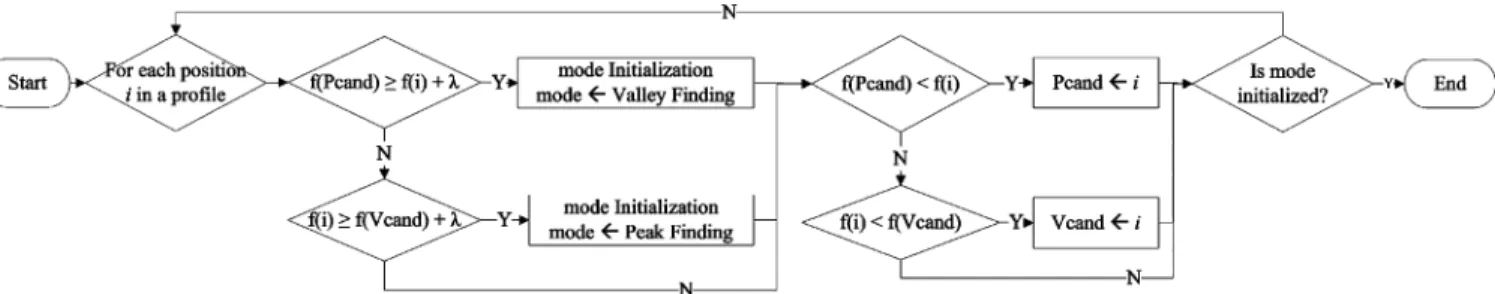
B. Peak-Valley Analysis
In a histogram or projection profile, a peak is a point with the value of the maximum height between two local minima. In order to consider a point as a peak, the value must be the
Fig. 17. Schematic diagram of the mode initialization step.
Fig. 18. Schematic diagram of the peak-valley decision step.
Fig. 19. Schematic diagram of the character verification step.
local maximum and at least greater than the local minimum. Similarly, a valley point is defined as a point with the minimum value that is less than between two local maxima.
To detect all peaks and valleys, two decision modes, which are called “peak decision mode” and “valley decision mode,” are de-signed to determine a peak and a valley, respectively. Moreover, two cascading procedures are proposed to detect all promising peaks and valleys in one-pass scanning. The first procedure is called “mode initialization” as shown in Fig. 17, where de-notes the value of the profile at position . The mode of peak finding or valley finding is determined according to the initial progressive increase or decrease in profile values. The second procedure is called the peak-valley decision as shown in Fig. 18. A point is selected as a peak when its value is higher than that of its neighbor and the previous valley by in the peak finding mode, while a point is selected as a valley when its value is less than that of its neighbor and the previous peak by in the valley finding mode. The peak and valley finding modes are performed alternately in order to determine all peaks and valleys.
C. Character Verification
The variations in characters and noncharacters extracted from the preceding segmentation procedures are automatically learned using the same scenario of plate verification as that described in Section III-C. The classification phase of char-acter verification is depicted in Fig. 19. During the feature extraction step, the SAT and SSAT are reused to calculate the Haar-like features for character rejecters. Compared with the plate verification, one more procedure of the OCR is adopted to recognize each character explicitly. We have investigated the development of an OCR for plate characters with different appearances [5]. In the OCR, the feature extraction step is first adopted to transform the character images into feature vectors.
1) OCR Feature Extraction: Three robust character features
are extracted to represent the characters: 1) contour-crossing counts (CCs); 2) directional counts (DCs); and 3) peripheral background area (PBA).
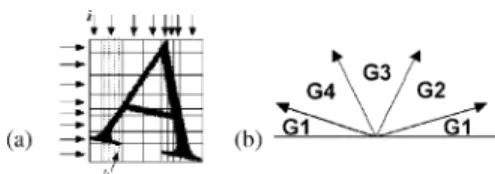
Fig. 20. Feature prototypes of OCR: (a) CC and (b) DC.
For the CC feature, each subimage is segmented nonuni-formly into eight strips in both the horizontal and vertical directions. These strips have the same number of character pixels. In order to increase the speed of the extraction, four scan lines are selected to extract the features in each strip. One value of the contour-crossing count is the number of strokes intersecting each scan line , as indicated by the dashed line in Fig. 20(a). The CC feature dimension of an input sample is 16( ). Each CC feature value in strip is defined as follows:
(7)
The dc feature represents the number of contour points in four main directions. As shown in Fig. 20(b), we divide the directions into four groups: G1, G2, G3, and G4, which correspond to the horizontal, vertical, diagonal, and inverse diagonal strokes, re-spectively. The patterns are only measured from the pixels lo-cated at the boundaries of the strokes. The angle of a stroke, ranging from 0 to 180 , is determined by the Sobel operator. The dc feature dimension of an input sample is estimated as 64(4 4 4) by splitting the input character image into 4 4 sub-blocks.
The PBA feature is the length of line segments that begin from the boundary of the image to the character contour. The input character image is first segmented into eight strips in both the horizontal and vertical directions by the method described in the above processing technique.
In each strip, two feature values are measured from the lengths between the strip boundary and the nearest character contour. Each PBA feature value is then divided by the length of the strip for normalization. The PBA feature dimension of an input sample is 32( ). The final feature dimension of each character is 112(16 + 64 + 32).
2) OCR Classification: The classification step is realized by
a support vector machine (SVM) [25] to classify each plate char-acter. The SVM method searches for a linear separating hyper-plane as a linear combination of support vectors (in addition to a constant). The distance from all of the support vectors to the hyperplane is 1. The SVM implementation used in this study is LibSVM [26]. In order to determine the best setting for the SVM, we test different settings for the parameters. The radial basis function (RBF) is the final used kernel given to LibSVM for the OCR. The highest OCR accuracy (with only one char-acter error on the training set) is obtained by setting gamma (re-lated to the RBF radius) to 0.0078125.
3) Nonplate Character Suppression: After the extraction and
recognition of the plate characters, several characters would be suppressed when they exist in the subregions of the real charac-ters, such as “L” in the region of “C,” “7” in the region of “Z,” or “F” in the region of “E.” For the first example, if “L” is another
recognition candidate in the region of the recognized character “C,” it should be suppressed according to the geometrical simi-larity between the lower half of the plate character “C” and the plate character “L.” In this study, these heuristic rules are col-lected and generated manually in the training phase from the recognition candidates and the ground truth data. In the region of character “C”, for example, if more than 30% subregions, are recognized as “7,” the recognition result should be suppressed.
V. EXPERIMENTALRESULTS ANDDISCUSSION
This section describes the results of our cascade plate recog-nition system, including the detection and the final recogni-tion results. The discussion includes details on a comparison with other publishing systems as well as the results of a large real-surveillance testing set. The system proposed in this study was implemented in C language and tested on a standard Intel Pentium 4, 3-GHz personal computer. To recognize the plates more effectively, we reduced the height of the test images to half or directly captured the half-height images from the capturing devices without performing the deinterlace procedure. This in-dicates that the width-to-height ratio of the plate character is set to 1 in the experiments.
A. Plate Recognition System Performance
The plate training set consisted of 8520 manually selected plates scaled to a base resolution of 32 8 pixels. The plates were extracted from images captured in actual visual surveil-lance environments. The training and test images showed dif-ferent plate types, sizes, locations, or illuminations. The char-acter training set consisted of 4786 manually selected charac-ters scaled to a base resolution of 16 16 pixels. The characters were extracted from the plate training set.1
The test images are arranged into three sets according to the captured image size to demonstrate the performance, computa-tional speed, and adaptation. Each test set is mainly composed of three kinds of capturing environments, which are a portal, road-side, and pavement background. These datasets are used to show different types of lighting or environment on a wet, cloudy, and sunny day. The datasets also show tolerance of our plate recog-nition system to the camera’s pan and tilt motion.
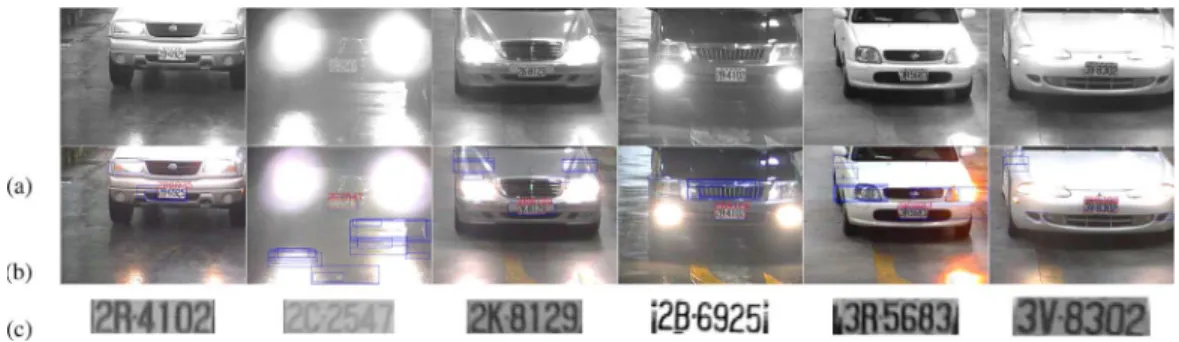
In these images, the plate candidates extracted by compact plate region extraction are shown with blue rectangles, while the final recognized plates are indicated by red rectangles. Fig. 21 shows the experimental results obtained with different head-lights on a wet day, while Figs. 22 and 23 show the results ob-tained with different types of environmental lighting on cloudy and sunny days, respectively. The results of images captured in the environment of the pavement background with texture pat-terns are presented in Fig. 24. Fig. 25 demonstrates the ability to recognize the frames from a capturing device installed in a car. Although the capturing device placement (pan/tilt) was changed (approximately 20 ), as shown in Fig. 25, our plate recognition system still performed well without the application of any skew correction procedure.
The system performances are shown in Table I. In this table, plate heights are shown in the third column, while the testing 1The parts of test images can be downloaded from http://lpr.csie.nctu.edu.tw.
Fig. 21. Examples of a variety of plates on a wet day. (a) Input images., (b) Recognized results shown in color images. (c) Enlarged recognized plates.
Fig. 22. Examples of a variety of plates on a cloudy day. (a) Input images. (b) Recognized results shown in color images. (c) Enlarged recognized plates.
Fig. 23. Examples of a variety of plates on a sunny day. (a) Input images. (b) Recognized results shown in color images. (c) Enlarged recognized plates.
numbers of images with and without plates are presented in the fourth column. The numbers of images with plates recognized are given in the fifth column. In dataset 3, for example, 11 598 images (say, true positives) are recognized correctly in the 11 896 plate images and 516 images (say, false positives) are rec-ognized erroneously in the 52 000 nonplate images. The TPR, defined as the ratio of true positives to the number of input im-ages with plates, is shown in the sixth column; the FPR, de-fined as the ratio of false positives to the number of input im-ages without plates, is shown in the seventh column. In dataset 3, for instance, the FPR is 0.01%, standing for one false alarm in 10 000 input images. The errors occur due to the existence of similar patterns, such as the symbol “ ,” near the borders of the plate, or ambiguous characters such as “8” and “B” or “0” and “D.” Finally, the system accuracy rates shown in the last column are all greater than 96%, which are the weighted sum of the TPR and the FPR, as defined in Section II-B.
B. Plate Detection Performance
The number of features used in the stages of the plate veri-fier using only upright Haar-like features and both upright and
skewed Haar-like features are demonstrated in Fig. 26. The de-tection performance is shown in Table II. The dede-tection accu-racy rates are greater than 99%. As shown in Figs. 21(c)–25(c), the algorithm for a one-pass compact plate region extraction could detect the plate character regions without restrictions on the sizes, locations, and colors of the plate or environmental lighting.
C. Comparison of Computational Speed
A comparison of the experimental computational speed and performance comparisons with those of two other studies is shown in Table III. The term “LPD” indicates that the system only dealt with plate detection, “LPS” shows that the system only dealt with plate character segmentation and character recognition, and “All” denotes the system, including plate de-tection, plate character segmentation, and character recognition. Moreover, our system also outperforms commercial systems with respect to computational speeds. The VECON–VIS system [27] processes each image in less than 0.5 s while the SeeCar library [28] could response at 25 ms per image but requiring at least 80 pixels height per typical plate. When we applied
Fig. 24. Examples of a variety of plates with the pavement background of texture patterns. (a) Input images. (b) Recognized results shown in color images. and (c) Enlarged recognized plates.
Fig. 25. Examples of a variety of plates captured from a device installed in a car. (a) Input images. (b) Recognized results shown in color images. (c) Enlarged recognized plates.
TABLE I
RECOGNITIONRESULTS OFOURPLATERECOGNITIONSYSTEM
Fig. 26. Comparison of feature numbers between classifiers using only upright and both upright and skewed Haar-like features.
our system to the dataset—32 local vehicle images used in the SeeCar library [28]—all plates in the images are recognized correctly. Other systems, such as Zamir’s LPR engine [29] and CARMENR Parking License Plate Recognition Engine [30], would perform in less than 20 f/s. Above commercial systems, all proclaim that the accuracy rates are more than
95%. However, the details of settings and testing environments are unavailable for detailed comparisons.
VI. CONCLUSION
We have presented a cascaded framework for a plate recog-nition system that minimizes the computation time while
TABLE III
COMPARISONRESULTS OF THECOMPUTATIONALSPEED AND THEACCURACYRATE FORPLATERECOGNITION
achieving a high frame rate and a high accuracy rate. The framework is used to develop a plate recognition system that operates only with information presented in a single gray-level image and at a rate of more than 30 f/s. Without scaling the input image, the proposed system performs well even if the plates have different sizes. In particular, no information is obtained from motion or color. We expect that many challenges will be presented for surveillance applications, such as illumination, sizes, or locations, as well as a large range of tilt and pan. However, alternative sources of information, such as color filter or motion detection, could also be integrated into our system to achieve higher frame rates or deal with special cases.
This study combines low-level image processing and high-level statistical analyses, which are very generic and may have broader applications in computer vision. The first contribution is a new technique for directly extracting compact plate regions at various scales by using the one-pass scanning procedure. In order to satisfy the challenge of scale variances, almost all plate detection systems must operate on multiple image scales. By eliminating the need to compute a multiscale image pyramid, the proposed algorithm significantly reduces the initial image processing effort required for plate detection.
The second contribution of this study is a simple and efficient segmentation technique developed from computationally effi-cient features using peak-valley selection for the determination of dominant thresholds. This segmentation method is computa-tionally efficient since only a small number of candidates must be evaluated by the computation-required procedure—OCR.
The third contribution of this study is a rejection-based cas-cade framework for constructing a cascas-cade of rejecters, which dramatically reduces the computation time while maintaining very high detection accuracy. The initial rejecters of the cascade are designed to reject a majority of the input regions in order to focus the successive processing on promising regions. The ad-vantage of this framework is that it allows tradeoffs between the processing time and the system performance. This framework is clearly effective for the plate recognition and we are confident that it will also be effective in other domains such as sign or text detection. Finally, this paper presents the co-design of plate de-tection and character segmentation using the same summed area tables to avoid recalculating the procedures. Skewed Haar-like features are also proposed to represent skewed plate images in
a better manner. The test dataset includes plates under a very wide range of conditions, such as illumination, scale, location, or camera variation.
ACKNOWLEDGMENT
The authors would like to thank NSC, Chiao-Tung University, and Tzu-Chi University, Taiwan, R.O.C., for their support.
REFERENCES
[1] H. A. Hegt, R. Haye, and N. A. Khan, “A high performance license plate recognition system,” in Proc. IEEE Int. Conf. Systems, Man, Cy-bern., San Diego, CA, Oct. 1998, vol. 5, pp. 4357–4362.
[2] V. Kamat and S. Ganesan, “An efficient implementation of the hough transform for detecting vehicle license plate using dsp’s,” in Proc. IEEE Real-Time Technology and Applications Symp., 1995, vol. 0, p. 58. [3] Y. Yanamura et al., “Extraction and tracking of the license plate using
hough transform and voted block matching,” in Proc. IEEE Int. Conf. Intelligent Vehicles Symp., Jun. 2003, pp. 243–246.
[4] K. M. Kim et al., “The automatic recognition of the plate of vehicle using correlation coefficient and hough transform,” J. Control Autom. Syst. Eng., vol. 3, no. 5, pp. 511–519, 1997.
[5] S.-Z. Wang and H.-J. Lee, “Detection and recognition of license plate characters with different appearances,” in Proc. IEEE Int. Conf. Intel-ligent Transportation Systems, Shanghai, China, Oct. 2003, vol. 2, pp. 979–984.
[6] D. U. Cho and Y. H. Cho, “Implementation of preprocessing indepen-dent of environment and recognition of car number plate using his-togram and template matching,” J. Korean Comm. Sci., vol. 23, no. 1, pp. 94–100, 1998.
[7] P. Xiang, Y. Xiuzi, and Z. Sanyuan, “A hybrid method for robust car plate character recognition,” in Proc. IEEE Int. Conf. on Systems, Man, and Cybernetics, Sydney, Austria, Jul. 2004, vol. 5, pp. 4733–4737. [8] R. Zunino and S. Rovetta, “Vector quantization for license plate
loca-tion and image coding,” IEEE Trans. Ind. Electron., vol. 47, no. 1, pp. 159–167, Feb. 2000.
[9] S. Draghici, “A neural network based artificial vision system for license plate recognition,” Int. J. Neural Syst., vol. 8, pp. 113–126, Feb. 1997. [10] K. Kim, K. Jung, and H. Kim, “Fast color texture-based object detec-tion in images: Applicadetec-tion to license plate localizadetec-tion,” J. Lecture Notes Comput. Sci., vol. 177, pp. 297–320, 2005.
[11] W. Jia et al., “Mean shift for accurate license plate localization,” in Proc. IEEE Int. Conf. Intelligent Transportation Systems, Vienna, Aus-tria, Sep. 2005.
[12] Y. Amit, D. Geman, and X. Fan, “A coarse-to-fine strategy for mul-ticlass shape detection,” IEEE Trans. Pattern Anal. Mach. Intell., vol. 26, no. 12, pp. 1606–1621, Dec. 2004.
[13] S. Yoshimori et al., “License plate detection using hereditary threshold determine method,” J. Lecture Notes Comput. Sci., vol. 2773, pp. 585–593, 2003.
[14] S. L. Chang et al., “Automatic license plate recognition,” IEEE Trans. Intell. Transport. Syst., vol. 5, no. 1, pp. 42–53, Mar. 2004.
[15] S. Nomura et al., “A novel adaptive morphological approach for de-graded character image segmentation,” J. Pattern Recognit., vol. 38, pp. 1961–1975, Jan. 2005.
[16] X. Pan, X. Ye, and S. Zhang, “A hybrid method for robust car plate character recognition,” J. Eng. Appl. Artif. Intell., vol. 18, pp. 963–972, 2005.
[17] A. Broumandnia and M. Fathi, “Application of pattern recognition for farsi license plate recognition,” Intl. J. Graphics, Vis. Image Process., vol. V2, pp. 25–31, Jan. 2005.
[18] B. Enyedi et al., “Strategies for fast license plate number localization,” in IEEE Int. Symp. Electron. Marine, Zadar, Croatia, Jun. 2004, pp. 579–584.
[19] P. Viola and M. Jones, “Robust real-time object detection,” Int. J. Comput. Vision, vol. 57, no. 2, pp. 137–154, 2004.
[20] R. Lienhart and J. Maydt, “An extended set of Haar-like features for rapid object detection,” in Proc. IEEE Int. Conf. Image Processing, New York, Sep. 2002, vol. 1, pp. 900–903.
[21] Y. Freund and R. Schapire, “A decision-theoretic generalization of on-line learning and an application to boosting,” J. Comp. Syst. Sci., vol. 55, no. 1, pp. 119–139, 1997.
[22] N. Otsu, “A threshold selection method from gray-level histograms,” IEEE Trans. Syst., Man, Cybern., vol. SMC-9, pp. 62–66, Mar. 1979. [23] M. Oren et al., “Pedestrian detection using wavelet templates,” in
Proc. IEEE Int. Conf. Comp. Vision and Pattern Recognition, 1997, pp. 193–199.
[24] F. C. Crow, “Summed-area tables for texture mapping,” in ACM Int. Conf. Comp. Graphics and Interactive Techniques, 1984, vol. 18, pp. 207–212.
[25] C. J. C. Burges, “A tutorial on support vector machines for pattern recognition,” J. Data Mining Knowl. Disc., vol. 2, no. 2, pp. 121–167, 1998.
[26] C.-C. Chang and C.-J. Lin, LIBSVM: A Library for Support Vector Machines 2001 [Online]. Available: http://www.csie.ntu.edu.tw/~cjlin/ libsvm.
[27] ALPR VECON-VIS Asia Vision Corp., Mon., 2007 [Online]. Avail-able: http://www.asiavision.com.hk.
[28] SeeCar Library Hi-Tecn Solutions Ltd. [Online]. Available: http://www.htsol.com/Products/SeeCar.html.
[29] Zamir’s LPR Engine Zamir Recognition Systems Corp. [Online]. Available: http://www.zamir.co.il.
[30] Parking LPR Engine Adaptive Recognition Hungary Ltd. [Online]. Available: http://www.arhungary.hu/index.htm.
Shen-Zheng Wang (S’01) received the B.S. and
M.S. degrees in computer science and information engineering from National Chiao-Tung University, Hsinchu, Taiwan, R.O.C., in 1998 and 2000, re-spectively, where he is currently pursuing the Ph.D. degree in computer science.
His research interests include computer vision, image processing, and pattern recognition.
Hsi-Jian Lee received the B.S., M.S., and Ph.D.
de-grees in computer engineering from National Chiao Tung University (NCTU), Hsinchu, Taiwan, R.O.C., in 1976, 1980, and 1984, respectively.
From 1981 to 2004, he was a Lecturer, Associate Professor, and Professor with NCTU. He was the Chairman of the Department of Computer Science and Information Engineering from 1991 to 1997. From 1997 to 1998, he was a Deputy Director of Microelectronic and Information Research Center (MIRC). Since 1998, he was the Chief Secretary to the President. He has been with Tzu-Chi University, Hualien, where he was the Chairman of the Department of Medical Informatics from 2004 to 2006. Since 2006, he has been the Dean of Academic Affairs. He was the Editor-in-Chief of the International Journal of Computer Processing of Oriental Languages (CPOL) and Associate Editor of the International Journal of Pattern Recog-nition and Artificial Intelligence and Pattern Analysis and Applications. His research interests include document analysis, optical character recognition, image processing, pattern recognition, digital library, medical image analysis, and artificial intelligence.
Dr. Lee was the President of the Chinese Language Computer Society (CLCS), Program Chair of the 1994 International Computer Symposium and the Fourth International Workshop on Frontiers in Handwriting Recognition (IWFHR), and was the General Chair of the Fourth Asia Conference of Computer Vision (ACCV) in 2000.