Numerirul e x w p l e : The effectiveness of the harmonic analysis procedure developed is examined here for a signal given as
s ( t ) =
0.1 $0.3 C O S ( ~ T x 25f+70°) +0.2 cos(2n x (50/&)t+60") +O.'icos(fl7r~ ( 5 0 / h + 0 . 5 ) t + 8 0 ° ) + l . 0 cos(27rx 50t)
+ 0 . 5 C O S ( 2 i r X ~ x 5 0 t + 9 0 " ) + 0 . 4 c o s ( 2 7 r x 3 x 5 0 t + 4 0 " ) (6) This is an exacting test case. The signal s(t) has frequencies that have irrational number relationships to one another (e.g. 50, 50/d2 and 50/1/3), together with harmonics which have closely similar frequencies (i.e. 50/d2 = 35.35Hz aiid 50142
+ 0.5
= 35.85Hz).By monitoring i he test error, the minimum length for the train- ing set required is also identified. For the correct value of N = 6, the test error is within the specified tolerance when MI = 260. Increasing MI beyond 260 does not change the test error. The procedure developed therefore discloses a minimum data window length requirement in this example of 260 samples. The final results of harmonic analysis using the error minimisation method of the paper are summarised in Table 1.
Overall, the analysis method guarantees very low errors in find- ing harmonic frequencies together with the magnitude and phase values of all harmonic components. The accurate identification of the two frequency components that are separated by only 0.SHz indicates the high resolvinl; power of the method. Spectral leakage errors are avoided completely. The low sensitivity of the method to the length of the training set and of the test set provides a good indication of the robustness of the method in practical use.
0 25 50 75 100 125 150 175 200
frequency , Hz
Fig. 1 Frequency spectrum of test wavefkom us fouudfiom DFT unulysis For our purposes, it is taken that there are 600 equally spaced data samples available corresponding to a tnne record length of 200ms for a sainpling frequency of 3kHz. Initial DFT analysis over the complete record length of 600 samples gives the spectrum of Fig. I . On ithe basis of the peaks in the spectrum, D F T analysis identifies the five frequency components summarised in Table 1 I Table 1: Resulkr of harmonic analysis
All the numerous other frequency components of the spectrum of Fig. 1 are sjpurious and derive from spectral leakage. Of the two frequency cornponents that are separated in frequency by only OSHz, the one that dominates in Fig. 1 is the component of fie- quency 35.85Hz, whose magnitude is 0.7.
Owing to spectral leakage, the D F T process fails to resolve between the two signal components of frequencies 35.35Hz and 35.85Hz.
The separation of the total data file into training and test parti- tions is at choice. An iiiitial choice is made here of 500 data sam- ples in the training set, leaving 100 samples for the test set. Therefore, the maximum length for the training set is M1 = 500. That for the test set is MI, or 100.
From the initial D F T processing, N = 5. Using the quasi-New- ton procedure, error minimisation for the training set leads to con- vergence at low error. However, the test errors are high, indicating a need to revise the initial value of N. There is no indication from the test error magaitude of whether N should be increased or decreased to lower the error. Choosing first to decrement N to a value of 4, increases the error in both the training set minimisation and the test set. Successively reducing N to 3, then to 2, and then to 1 confirms a trend of increasing error in both the training set and test set. Fkturning from this sequence to the initial choice of N = 5 and then incrementing to N = 6 leads to a low error of ICy in minimisation confined to the training set and le6 for the test error. FOJ- checking purposes, increasing N to 7 and then to 8 con- firms levels of test error similar to those for N = 4 or 3. The pro- cedurc therefore correctly gives the value N = 6.
~
ELECTRONICS LETTERS 20th June 7996 Vol. 32 No. 73 1161
Conclusions: The new method of parametric harmonic analysis
based on data partitioning achieves a correct identification of the number of frequency components; a good estimate of the mini- mum record length required; a valid identification of all frequency components; a high resolution between frequency components in the signal waveform for which harnionic analysis is required.
0 IEE 1996
Electronics Letters Online No: 19960784
T.T. Nguyeii (Energy Systenzs Centre, The Univer.sit,v of Western
Ausiruliu, Au.strcrfia)
25 Murch IY96
References
1 KAY. s M., and MARPLE, S . L , . ~ r : 'Spectrum analysis - A modern perspective', PTOC.. IEEE, 1981, 69, ( l l ) , pp. 1380-1419
Estimates of loss iprobabilities for delay-
sensitive traffic in
ATM
networks
K.-C. Lai and T.-H. L,ee
Indexing terms: As~~fidironoii~~ trunsfer mode, Teleconzmunicution
2ruf$c
Simple estimates of loss probabilities Tor heterogeneous delay- sensitive traffic in ATM networks are presented. Cells of different connections can have different loss priorities. Numerical results show that the estimates, which are derived from the bufferless fluid flow model, are close to the actual cell loss probabilities. Introduction: Loss probability is considered to be an important measure of quality of service (QOS) in ATM networks. To make Fast admission control possible, the loss probability must be coni- puted in real-time. Unfortunately, it is often very lime consuming to compute the exact loss probability with queueing models.
In this Letter we present simple estimates of loss probabilities for heterogeneouy delay sensitive traffic with multiple QOS requirements. Cells of different connections (and within a connec- tion) are allowed to have different loss priorities. Tlhe estimates are derived from the bufferless fluid flow model. Nnmerical results show that the estimates are close to the actual cell loss probabili- ties.
Esliinutes of loss prohuhilitie,T: Consider a multiplexer with M independent connections that generate delay-sensi1.ive traffic. The link capacity is denoted by C. Since all connections generate delay-sensitive traffic, we assume that the buffer size in the multi- plexer is small and thus its effect can be neglected.
Assume that the multipllexer supports N loss priorities. Number the priorities 1 to N so that the loss probability of priority i cells is smaller than or equal to ithat of priority j cells if i > j . T o cope with multiple loss probability requirements, the link capacity C is divided into N bands denoted by C;, C2, .,., C,. which can be
dynamically adjusted to reduce connection blockirig probability. A cell of priority i can share bands C,, C,, ..., C,. Moreover, all cells of priority i or higher share band C, fairly.
All traffic sources are assumed to be non-negative, bounded; stationary and ergodic. We adopt the fluid flow model [l] to ski- pliflr the calculation of loss probability. Let Z(t) denote the aggre- gate traffic generated by these A4 mutually independent connections. Under the above assumptions, to compute loss prob- abilities, it suffices to use a random variable 2 to represent the random process Z(t), so long as the density functions of Z and Z(t) are identical for all t. Let 2, denote the priorityj traffic gener- ated by the existing connections. It can be shown that as M appsoaches infinity
with probability one [2], where MEAN =
4
2
1
and MEAN, =a?].
We prove a lemma concerning the average loss rate of prior-ity,j traffic in the following section.
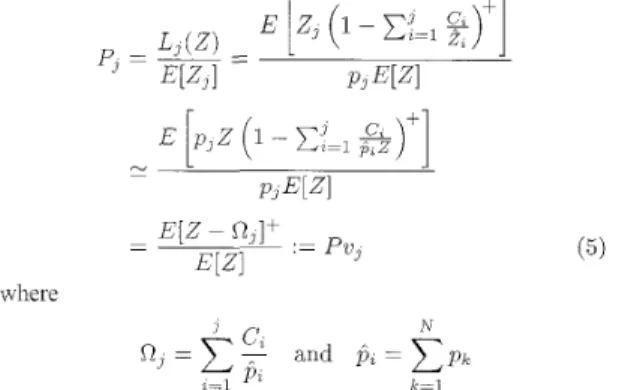
Lemma 1: Let L,(z) denote the average loss rate of priorityj traf- fic. It holds that
where
Proofi We prove this lemma by induction. Let lo.w,(z) denote the loss rate of priority j traffic so that L,(Z) = 4loss,(z)].
res,(Z) represent the traffic that will compete for band C,. have
resJ+l (2) = (res, (2) -
c,)+
z,+l
2, Hence, by eqns. 2 and 3 we have
For ,j = 1, we have resl(z) = Z and
Suppose that
For j = n
+
1 5 N, we have, by eqn. 4 &+l Zoss,+l(Z) = [res,+l - C T L + l ] + TZn+l
Therefore, it holds that
L
This completes the proof of Lenmia 1,
Also, let Then we
( 2 )
( 3 )
(4)
Let
P,
denote the loss probability of priority j traffic. It is clear thatwhich is difficult to compute in real-time. Fortunately, when the number of connections is large we have
(5) where
k = l
We suggest using Pv, to approximate P,. Notice that p J can be easily obtained if the variables MEAN, and MEAN are stored. Hence. Q, can be computed in real time. In a real system the bands C, ~ C,; . . . , C,- may be dynamically adjusted to reduce con-
nection blocking probability. In this case Q, needs to be recom- puted. which involves only a few divisions and thus can be accomplished in real time.
The difficulty to obtain P y is the computation of 42-41', A real-time computation algorithm for
42-.Q1]
+ can be found in [3].3
/80811/
number of category I 1 connections
Fig. 1 Loss probability uguinst number of cutegory II connections Number of category I connections is 100
ijp
= 0, & ? I = 1p , -
P? 0 PI,
0
Pi.:~V~ir~iei.icul examples: For the numerical examples, we assume C = 15OMbps and N = 2. The link capacity is partitioned into two bands C, and C?, where C, = 9/10 C and C, = 1/10 C. All traffic sources are assumed to be on-off sources. Two categories of con- nection are considered. A connection of category I has peak bit rate MAX(') = 64kbit/s and average bit rate AVG(I) = 32kbiVs. The peak bit rate and average bit rate of a category I1 connection are MAX(" = 2Mbit/s and AVGm = 0.2Mbit/s, respectively. The percentage of high priority cells of category I and category I1 con- nections are denoted by d?(') and @, respectively. In our study, is chosen to be 0 (i.e. all cells are of low priority) and dJ2) = 1 (i.e. all cells are of high priority). Fig. 1 illustrates the curves for Pv, and the actual cell loss probability PI. It can be seen that Pv, is an excellent approximation of the actual cell loss probability.
ELECTRONICS LETTERS 20th June 1996 Vol. 32 No. 13
Conclusion: We have presented asymptotic estimates of loss proba- bilities of all priority classes for delay-sensitive traffic with multi- ple quality of service requirements. The asymptotic estimates can be computed in real time and are close to actual loss probabilities. The estimates can be used to design real-time resource allocation schemes. We h w e also performed numerical examples for other cases (which are not presented here owing to space limitation), and have found that
Pv,
seems to be an upper bound of6.
0 IEE 1996Electronics Letters Online No: 19960783
K . X . Lai (Institute of Electronics, National Chiiro Tung University, Hsinchu, Taiwan 300, Republic of China)
T.-H. Lee (Institute of Communication Engineering, National Chiao Tung University, Hsinchu, Taiwan 300, Republic of China)
25 March 1996
References
1 SAITO, H.: 'Teletraffic technologies in ATM networks' (Artech House, 1994)
2 NEVEU, J . : 'Ma thematical foundations of the calculus oI" probability' (Holden-Day, San Francisco, 1965)
3 LEE, T.H., LAI, K.c., and U U A N N , s . I . : 'Real-time call admission control for ATM networks with heterogeneous bursty traffic'. IEEE ICC, 1994, 1, pp. 80-85
4 ESAKI, H.: 'Call admission control method in ATM networks'. IEEE ICC, 1992, 3, pp. 1628-1633
Frame decorrelation
for
noise-robust speech
recognition
H.Y. Jung,
D.Y.
Kim
and C.K. Un
Indexing teims: Speech recognition, Signal processing
The authors propose a frame decorrelation method to cope with background noise in speech recognition. Since noise is modelled as a stationary perturbation in most cases, it is cffective to reduce slow-varying components. One example ofnsing this principle is the highpass scheme. The proposed method has the same property as the h.ighpass scheme. It transforms feature vector sequences into decorrelated sequences and enhances transition regions. Simulation results show that this method is cffective for speech with significant noise, and works better than other highpass methods.
Introduction: It is well known that the performance of a speech recognition system becomes degraded severely when training and testing are carried out at different noise levels. To overcome this problem, many researchers used the spectral subtraction method developed in the context of speech enhancement, but in this method noise in corrupted speech must be estimated, which is a very difficult arid unsolved problem in real environments. This necessitates a technique that requires no noise estimation. The proposed decorrelation method is a kind of highpass scheme [l, 21. With this method slowly varying components can slowly be reduced to deal with background noise, thus enabling the station- ary regions to be more attenuated than the transition regions between speech ;segments. This effect can be considered as decorre- lation since the stationary regions are more correlated than the transition regions. The frame decorrelation method removes corre- lations between feature vectors. It transforms feature vector sequences into decorrelated sequences and enhances the transition regions as in the highpass scheme. The enhancement of transition regions will provide good discrimination for speech recognition. According to speaker-independent isolated word recognition experiments, the proposed method is effective for significantly noisy speech and yields better performance than other highpass schemes.
Estimation of the power spectrum: Here we need to estimate the power spectrum of feature vectors to apply this to the decorrela- tion procedure. This power spectrum is an important factor for
-
ELECTRONICS LETTERS 20th June 1996 Vol. 32 No. 13 1163
20 30 LO 50
1 2
t
, 1 , 1 ,,
,,
0 10
modulation frequency U , H z 19~911/ Fig. 1 Power spectrum of observation vectors
0
585 Hz, 1259 Hz+
2492Hz, X 4745Hzw2, 0 215Hz
decorrelation between feature vectors. It is estimated from statis- tics of feature vectors, and filter bank outputs are used as feature vectors. We assume that the filter bank vector O(j; t ) (wherefrep- resents frequency and t represents frame index) is independent of frequency, and estimate individually the power spectrum in each frequency band. The power spectrum of frequency band
AJ
is rep- resented byT
/ S ( f O , w)I2 =
1
;
1
o(fo. t)eJ2ZU'fdtwhere Tis the frame length, oCr;,, t ) is a feature coefficient at fre- quencyf,, and w is a modulation frequency that describes the tem- poral variation of subband energy. Fig. 1 shows the average power spectrum obtained using 1500 words uttered by 20 male speakers. It has a similar envelope in each subband, and the :spectral enve- lopes are approximately a fimction of Uw2. Therefore, the power spectrum in each subband is approximated by
F m m e decorrelation procedure: We assume that each feature vector Ov; t,) is independent of frcquency, and apply the decorrelation procedure to remove correlations between featuire coefficient sequences in each subband, i.e. the decorrelation procedure trans- forms feature sequences into decorrelated sequences. Assuming that the sequence of feature coefficients at subband
,fi,
O(oY;,, t i ) , ov;>, t2), ..., ov;, t,)) is transFormed into Y = CyV;], t l ) , y v i , t2), ..., yvi,j';)) by a decorrelation filter D, yv;, t ) is represented as a tern- poral convolution of D and 0. Here, in order for Y lo be decorre- lated, the correlation function of Y must satisfy the following [3]:E ( y ( f o , t)y*(f,,
t'))
= E ( ( D.
O ) ( D ' O T ) = S ( f 0 ; t - to( 3 )
where 6 6 ; t - t') is the Kronecker delta function which is one when t = t'. Thus, the Fourier transform of eqn. 3 is given by
o(fo,w)R(fo,lu)D"(f,,m) = 1 (4) where RV;, w) is the power spectrum of feature sequences in sub- bandf,, and is represented by the sum of signal ancl noise power spectra i.e. !S(fi, w ) ! ~