Reconstruction of fiber grating refractive-index
profiles from complex Bragg reflection spectra
Ding-Wei Huang and Chih-Chung Yang
Reconstruction of the refractive-index profiles of fiber gratings from their complex Bragg reflection spectra is experimentally demonstrated. The amplitude and phase of the complex reflection spectrum were measured with a balanced Michelson interferometer. By integrating the coupled-mode equations, we built the relationship between the complex coupling coefficient and the complex reflection spectrum as an iterative algorithm for reconstructing the index profile. This method is expected to be useful for reconstructing the index profiles of fiber gratings with any apodization, chirp, or dc structures. An apodized chirped grating and a uniform grating with a depression of index modulation were used to demonstrate the technique. © 1999 Optical Society of America
OCIS codes: 050.2770, 060.2340.
1. Introduction
Fiber gratings fabricated with UV laser exposure on photosensitive optical fiber have been widely used for optical filtering,1,2 sensing,3 dispersion
compensa-tion,4,5etc. Bragg reflection characteristics of a fiber
grating, including amplitude and phase, are con-trolled by its longitudinal refractive-index distribu-tion, i.e., the local grating period and the depth of effective index modulation. Therefore, the retrieval of the longitudinal index distribution is crucially im-portant for controlling the characteristics of a fiber grating. Several studies have been conducted for this purpose. The technique of side diffraction6has
been used to determine the index profile. However, this technique suffers from the disadvantage of strict alignment of the probe laser beam and the lack of information of background index change and grating chirp. Also, the spatial resolution is limited by the size of the probe beam. The technique of side scat-tering can be used to measure the grating chirp.7
However, the spatial resolution is limited by the de-tection system. An algorithm was proposed to re-trieve the index profiles by processing the data from
optical coherence-domain reflectometry 共OCDR兲.8
However, no experimental work was reported based on the proposed method. Besides, it is difficult to obtain the required phase information from the OCDR measurement. Recently, it was reported that the phase information could be obtained from reflec-tivity data through the Hilbert 共or Wiener–Lee兲 transformation without direct measurement.9 –11
However, this process has some limitation, i.e., the grating must be symmetric or the reflection response must be a minimum phase-shift function. There-fore, without direct measurement of phase, it is dif-ficult to retrieve the index profiles of gratings with apodization, chirp, or dc component structures.
Here we report our results of retrieving the index profiles of fiber gratings based on a novel technique. We measure both intensity and phase of Bragg re-flection from the fiber grating with an interferometric setup. Then, with a simple algorithm, we can re-trieve index profiles of fiber gratings with well-behaved apodization, chirp, or dc structures under the following conditions: 共1兲 the period of the fiber grating is either uniform or linearly chirped;共2兲 the envelope of index change is not exactly a linear func-tion. Although our basic theory is the same as that in Ref. 8, we provide more concrete discussions on the required procedures for retrieving the apodization, chirp, and dc structures. Meanwhile, our experi-mental implementation demonstrates the feasibility of this algorithm. Two fiber grating samples were tested to demonstrate the capability of the technique. In Section 2 we discuss the theoretical background of the technique. In Section 3 we describe the
pro-The authors are with the Department of Electrical Engineering and Graduate Institute of Electro-Optical Engineering, National Taiwan University, 1 Roosevelt Road, Section 4, Taipei, Taiwan. The e-mail address for C. C. Yang is [email protected].
Received 4 January 1999; revised manuscript received 29 March 1999.
0003-6935兾99兾214494-06$15.00兾0 © 1999 Optical Society of America
cedure for reconstructive refractive-index distribu-tion. We provide the reconstruction results of the two fiber gratings in Section 4. Finally, a discussion and the conclusion are presented in Section 5.
2. Theoretical Analysis
For fiber gratings fabricated with an UV laser, the index profile can be described by
n共z兲 ⫽ no⫹ ␦n共z兲
再
b⫹ cos冋
2 ⌳o
z⫹ 共z兲
册冎
, (1) where n0is the effective refractive index of the fiber before UV exposure, ␦n共z兲 is the envelope of index change, b is the background component of the index change 关b␦n共z兲 is the dc component of the index change兴, ⌳ois the nominal grating period, and 共z兲 describes the grating chirp. For a linearly chirped grating, the phase term has the form共z兲 ⫽⫺ ⌳o
␣z2
, (2)
where␣ ⫽ 0 for a uniform grating. If we define the complex amplitudes A共z, v兲 and B共z, v兲 for the for-ward propagating wave field E⫹共z, v兲 and the back-ward propagating wave field E⫺共z, v兲 in the grating as E⫹共z, v兲 ⫽ A共z, v兲exp关⫺j共z兲z兴, (3) E⫺共z, v兲 ⫽ B共z, v兲exp关 j共z兲z兴, (4) respectively, where 共z兲 ⫽2 ␦n共z兲b (5) is a slowly varying propagation constant correspond-ing to the dc component of the index change, the coupled-mode equation can be reduced to12
dA dz⫽ ˜*B exp共 j2vz兲, (6) dB dz⫽ ˜A exp共⫺j2vz兲, (7) Here, v⫽ ⫺ 1 ⌳o ⫽ 2no
冉
1 ⫺ 1 Bo冊
(8) is the frequency detuning, ⫽ 2no兾 is theback-ground propagation constant, andB
o⫽ 2no⌳ois the
central Bragg wavelength. Meanwhile, the complex coupling coefficient ˜共z兲, which contains the index change information, is given by
˜共z兲 ⫽ j
␦n共z兲exp兵⫺j关2共z兲z ⫹ 共z兲兴其. (9) By direct integration of Eqs.共6兲 and 共7兲, the backward propagating field at the input end, B共0, v兲, can be
expressed as an integral of the complex coupling co-efficient multiplied by the field distribution in the grating. This expression can be further reduced to the relation between the complex reflection spectrum and the complex coupling coefficient as
r共0, v兲 ⫽ ⫺
兰
0 L再
˜共z兲冋
1⫹兰
0 z ˜*共z兲r共z⬘, v兲 ⫻ exp共 j2vz⬘兲dz⬘册冎
exp共⫺j2vz兲dz, (10) where r共z, v兲 ⫽ B共z, v兲兾A共0, v兲 is the normalized backward propagating wave field and r共0, v兲 is the complex reflection coefficient measured at the input end of the fiber grating. Equation 共10兲 shows that the complex reflection spectrum is the Fourier trans-form of the quantity within braces on the right-hand side of Eq. 共10兲. After taking the inverse Fourier transform of Eq.共10兲, we can obtain an iterative re-lation as ˜m⫹1共z兲 ⫽ ⫺Ᏺ⫺1兵r共0, v兲其 ⫺ Ᏺ⫺1兵pm共v兲其, (11) where pm共v兲 ⫽兰
0 L ˜m共z兲兰
0 z ˜m*共z⬘兲rm共z⬘, v兲 ⫻ exp关 j2v共z⬘ ⫺ z兲兴dz⬘dz. (12) Meanwhile,Ᏺ denotes the Fourier transformation op-erator and the subscript m⫽ 0, 1, 2, . . . is the iter-ation number. We calculated the normalized backward propagating field rm共z, v兲 by using Eqs. 共6兲 and共7兲 with ˜共z兲 ⫽ ˜m共z兲 at each iteration.Equa-tion共11兲 describes the algorithm for reconstructing the complex coupling coefficient ˜共z兲 from the com-plex reflection spectrum. The initial conditions in the algorithm are set to be˜0共z兲 ⫽ 0 and r0共z, v兲 ⫽ 0.
Hence, with the procedure described above, we can obtain ˜共z兲 from the measured complex reflection spectrum from which the index profile of the fiber grating can be consequently obtained through Eq.共9兲.
3. Reconstruction Procedures
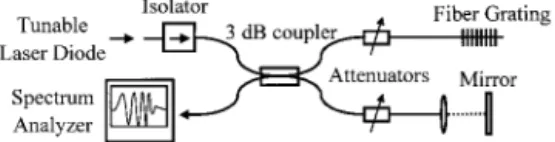
Figure 1 shows the experimental setup that we used to measure the amplitude and phase of the Bragg reflection coefficient. The system is a balanced Michelson interferometer with a test arm connected to the fiber grating to be characterized and a free-space reference arm in which the signal is retrore-flected by a gold-coated mirror. A tunable laser diode with a wavelength resolution of 0.001 nm was
used as the light source. We measured the fiber Bragg reflection, interference, and reference intensi-ties by appropriately blocking light with the two at-tenuators. The Bragg reflection, interference, and reference intensities, normalized by the input inten-sity, have the following relationships represented by
Ireflect, Iinter, and Iref, respectively:
兩r兩 ⫽
冑
Ireflect, (13)Iinter⫽ Iref⫹ Ireflect⫹ 2
冑
IrefIreflectcos共r兲, (14)Meanwhile,兩r兩 and rare the amplitude and phase of
the complex reflection coefficient at the position z⫽ 0. By measuring the spectra of Ireflect, Iinterand Iref, the
phase part of the complex reflection coefficient can be retrieved through Eqs.共13兲 and 共14兲 with a suitable curve fitting as described in Ref. 13. Note that the retrieved phase can be either positive or negative from Eq.共14兲. Because of the time reversal property of the Fourier transform of a conjugate signal, oppo-site signs of phase could lead to the reconstructed index distribution either in the region zⱖ 0 or z ⬍ 0. To avoid such ambiguity, we can carefully arrange the interferometer so that the optical path in the reference arm is equal to or shorter than that in the test arm. In other words, the interferometer is set as a causal system. Hence, we can choose the cor-rect sign for the retrieved phase of the reflection co-efficient, which ensures that the reconstructed index distribution is located in the region zⱖ 0.
After we have the complex reflection coefficient r共z,
v兲, Eq. 共11兲 can be used to reconstruct the complex
coupling coefficient˜共z兲. After we have ˜共z兲, we can then obtain ␦n共z兲 by taking the absolute values of both sides of Eq.共9兲, i.e.,
␦n共z兲 ⫽ 兩˜共z兲兩共兾兲. (15) Note that the dc component of index change and grat-ing chirp are mixed in the phase of the complex cou-pling coefficient. We can separate these two quantities with the following assumptions: 共1兲 the period of the fiber grating is either uniform or linearly chirped and共2兲 ␦n共z兲 is not a linear function. With these assumptions, the first-order derivative of the phase of the complex coupling coefficient can be a linear combination of the dc component of index change and grating chirp with the two parameters b and␣ as d˜共z兲 dz ⫽ d arg关˜共z兲兴 dz ⫽ ⫺b 2 ␦n共z兲 ⫹ 2 ⌳0 ␣z. (16)
We can then use a linear programming method to fit Eq.共16兲 to separate these two quantities. Figure 2 shows the retrieving algorithm procedures.
4. Reconstruction Results
In our experiment we measured two fiber gratings with different index profiles. First, we measured a fiber grating fabricated with a chirped phase mask 共chirp of the Bragg wavelength is 0.02 nm兾mm兲.
Apodization was assumed to be due to the nearly Gaussian profile of the UV laser beam that we used. Figure 3 shows the measured values of Ireflect, Iinter,
and Irefof this grating. Note that the structure on
the short wavelength side of the reflectivity spec-trum, Ireflect, is known as self-chirping, which implies
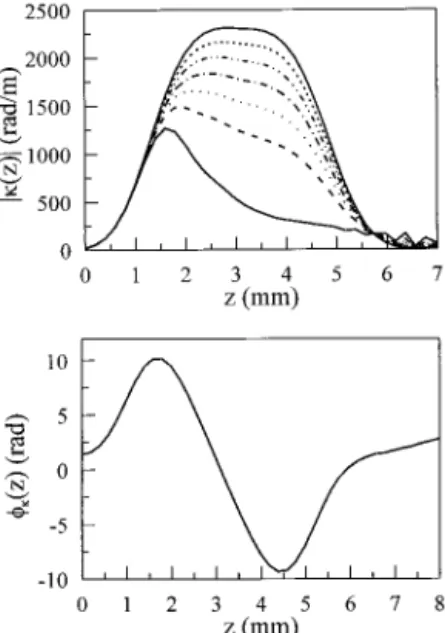
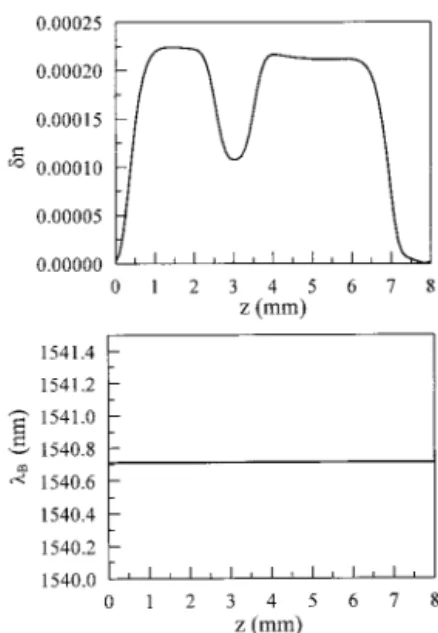
that the index profile might have a nonconstant dc component. Figure 4 shows the retrieved amplitude and phase of the reflection coefficient共the continuous curve in the lower portion is drawn to fit the data points of filled circles兲. After several iterations of the reconstructing algorithm, we obtained satisfac-tory results for the reconstructed complex coupling coefficient. Figure 5 shows the amplitude and phase of the reconstructed coupling coefficient of this grat-ing, as functions of position in the grating. The re-constructed amplitude of the coupling coefficient after each iteration is also shown. The curve at the top represents the result after the last iteration. The result implies a nearly exp共⫺兩z兩3兲 apodized pro-file of refractive-index change. Figure 6 shows the reconstructed profiles of the envelope of index change,␦n共z兲, and the local Bragg wavelength, B共z兲,
along the fiber grating. The grating length was
cal-Fig. 2. Procedures of the retrieving algorithm.
Fig. 3. Measured values of Ireflect, Iinter, and Irefof the chirped
ibrated to be approximately 6.2 mm. The dc compo-nent of the index change, b␦n共z兲, was calculated and
b⫽ 1.03 was fitted. The nonconstant dc component
of the index change, which caused the self-chirping in the reflectivity spectrum, was verified. The results are in good agreement with the fabrication condi-tions.
We then consider a fiber grating made with a uni-form phase mask. To demonstrate the capability of our reconstruction technique, we purposely fabri-cated the grating with an UV laser of two peaks in beam profile. Such a laser beam came from an ex-cimer laser, which oscillated with a higher-order transverse mode. Therefore, we expect a depression
of index modulation along the grating. Figure 7 shows the measured values of Ireflect, Iinter, and Irefof
this grating. We can see that the measured reflec-tion spectrum is asymmetric, which is contrary to what is expected from a uniform grating but is con-sistent with the expected index modulation depres-sion. Figure 8 shows the retrieved amplitude and phase of the reflection coefficient. Figure 9 shows the amplitude and phase of the reconstructed cou-pling coefficient as functions of position in the grat-ing. The result indicates a depression of the UV
Fig. 4. Retrieved amplitude and phase of the reflection coefficient of the chirped grating.
Fig. 5. Amplitude and phase of the reconstructed coupling coef-ficient of the chirped grating as functions of position in the grating.
Fig. 6. Reconstructed profiles of the envelope of index change and the local Bragg wavelength along the chirped grating.
Fig. 7. Measured values of Ireflect, Iinter, and Irefof the uniform
laser beam profile and of the index modulation, as expected. Figure 10 shows the reconstructed pro-files of the envelope of index change and the local Bragg wavelength along the fiber grating. The con-stant Bragg wavelength near 1540.7 nm is consistent with the period of the phase mask. We can clearly see the index modulation depression near z⫽ 3 mm, which agrees well with the laser beam profile. The dc component of the index change in this fiber grating was calculated as b ⫽ 1.
5. Discussions and Conclusion
The reconstruction algorithm is based on the coupled-mode equations and can be simplified by using
Fou-rier transformation. Because of the inherent characteristics of the Fourier transformation, the spatial resolution of the reconstructed index profile with this algorithm is limited by the measured spec-tral bandwidth. The spatial resolution ⌬z can be approximately expressed as
⌬z ⫽0.441B2
⌬ . (17) Here,⌬ is the spectral bandwidth of measurement andBis the Bragg wavelength. Equation共17兲
im-plies that the wider the spectral bandwidth, the higher the resolution of the index profile. For exam-ple, when the spectral bandwidth is 4 nm共as is the case in Fig. 3兲, the spatial resolution of the recon-structed index profile is approximately 0.26 mm.
The algorithm fails when there is an abrupt change in the index profile or Bragg wavelength of a grating. Another limitation of this method is that the envelope of index change cannot be so strong that signal pene-tration into the grating is short. Although an addi-tional measurement from the other side of the fiber grating can help to relieve this limitation,8 strong
Bragg reflection at the edges of a grating still hinders our measurement and reconstruction of the index structure at the middle of the fiber grating.
In summary, we have demonstrated a novel tech-nique for retrieval of the refractive-index profile of a fiber grating with any well-behaved chirp, apodization, and dc structures. Two purposely designed fiber grat-ings were used to demonstrate the capability of this technique. Currently, we are applying this method for the in situ study of the evolution of the index pro-files of fiber gratings during the fabrication process.
This research was supported by the National Sci-ence Council, the Republic of China, under grants NSC 88-2215-E-002-012, NSC 87-2215-E-002-006, and NSC 87-2215-E-002-007. The help of
Gang-Fig. 8. Retrieved amplitude and phase of the reflection coefficient of the uniform grating.
Fig. 9. Amplitude and phase of the reconstructed coupling coef-ficient of the uniform grating as functions of position in the grating.
Fig. 10. Reconstructed profiles of the envelope of index change and the local Bragg wavelength along the uniform grating.
Chih Lin with the fabrication of the fiber grating is appreciated.
References
1. L. Zhang, K. Sugden, J. A. R. Williams, I. Bennion, D. C. J. Reid, and C. M. Ragdale, “Postfabrication exposure of gap-type bandpass filters in broadly chirped fiber gratings,” Opt. Lett. 20, 1927–1929共1995兲.
2. G. Lenz, B. J. Eggleton, C. R. Giles, C. K. Madsen, and R. E. Slusher, “Dispersive properties of optical filters for WDM sys-tems,” IEEE J. Quantum Electron. 34, 1390 –1402共1998兲. 3. G. C. Lin, L. Wang, C. C. Yang, M. C. Shih, and T. J. Chuang,
“Thermal performance of metal-clad fiber Bragg grating sen-sors,” IEEE Photon. Technol. Lett. 10, 406 – 408共1998兲. 4. K. Ennser, M. N. Zervas, and R. I. Laming, “Optimization of
apodized linearly chirped fiber gratings for optical communi-cations,” IEEE J. Quantum Electron. 34, 770 –778共1998兲. 5. J. A. R. Williams, L. A. Everall, I. Bennion, and N. J. Doran,
“Fiber Bragg grating fabrication for dispersion slope compen-sation,” IEEE Photon. Technol. Lett. 8, 1187–1189共1996兲. 6. P. A. Krug, R. Stolte, and R. Ulrich, “Measurement of index
modulation along an optical fiber Bragg grating,” Opt. Lett. 20, 1767–1769共1995兲.
7. J. Canning, D. C. Psaila, Z. Brodzeli, A. Higley, and M. Janos, “Characterization of apodized fiber Bragg gratings for rejection filter applications,” Appl. Opt. 36, 9378 –9382共1997兲. 8. E. Brinkmeyer, “Simple algorithm for reconstructing fiber
gratings from reflectometric data,” Opt. Lett. 20, 810 – 812 共1995兲.
9. L. Poladian, “Group-delay reconstruction for fiber Bragg grat-ings in reflection and transmission,” Opt. Lett. 22, 1571–1573 共1997兲.
10. A. Carballar and M. A. Muriel, “Phase reconstruction from reflectivity in fiber Bragg gratings,” J. Lightwave Technol. 15, 1314 –1322共1997兲.
11. D. Pastor and J. Capmany, “Experimental demonstration of phase reconstruction from reflectivity in uniform fiber Bragg gratings using the Wiener–Lee transform,” Electron. Lett. 34, 1344 –1345共1998兲.
12. T. Edogan, “Fiber grating spectra,” J. Lightwave Technol. 15, 1277–1294共1997兲.
13. B. C. Collings, K. Bergman, S. T. Cundiff, S. Tsuda, J. N. Kutz, J. E. Cunningham, W. Y. Jan, M. Koch, and W. H. Knox, “Short cavity erbium兾ytterbium fiber lasers mode-locked with a sat-urable Bragg reflector,” IEEE J. Sel. Top. Quantum Electron. 3, 1065–1075共1997兲.