國 立 交 通 大 學
生物資訊研究所
碩 士 論 文
利用重疊基因建構原核生物的基因體樹之研究
On the Study of Constructing Genome Trees of
Prokaryotes Based on Overlapping Genes
研究生:姜禮瑋
指導教授:盧錦隆 博士
利用重疊基因建構原核生物的基因體樹之研究
On the Study of Constructing Genome Trees of Prokaryotes
Based on Overlapping Genes
研究生:姜禮瑋 Student:Li-Wei Jiang
指導教授:盧錦隆 博士 Advisor:Dr. Chin Lung Lu
國 立 交 通 大 學
生 物 資 訊 研 究 所
碩 士 論 文
A Thesis Submitted to Institute of Bioinformatics College of Biological Science and Technology
National Chiao Tung University in partial Fulfillment of the Requirements for the Degree of Master in
Biological Science and Technology June 2008
Hsinchu, Taiwan, Republic of China
利用重疊基因建構原核生物的基因體樹之研究
學生:姜禮瑋
指導教授:盧錦隆 博士
國立交通大學生物科技系生物資訊所碩士班
摘要
隨著DNA定序技術的進步,越來越多物種的完整基因體序列變得更 容易取得。因此,藉由完整基因體來建構出物種之間的演化樹,將有助 於了解物種演化的親屬關係。除了以序列為主的方法之外,還有利用整 個基因體基因內容和基因次序,這些都能被用來建構出更準確和穩定的 演化樹。然而已有文獻指出,只利用基因內容或基因次序來建構微生物 的基因體樹可能是不合適的。為了克服這個問題,Luo所屬的研究團隊 最近提出一個利用重疊基因的內容來建構出細菌演化樹的新方法。所謂 的重疊基因是指在染色體位置相鄰的兩個基因,它們的序列會部份或全 部重疊。實際上,重疊基因在微生物的基因體上是非常普遍的,而且他 們比非重疊基因在演化上是更具有保留性的,這意味著重疊基因在微生 物中是比非重疊基因更適合當作建構物種演化關係的特徵。事實上,物 種的基因在演化過程中是會很容易地發生基因體的重組,這導致了即使 在兩個親屬關係很近的物種上,他們之間的直向同源基因的次序可能會 不同,這當然也會造成他們之間的直向同源重疊基因的次序也會不同。 這似乎意味著不僅是重疊基因的內容而且重疊基因的次序也應該被考慮用來建構原核生物的基因體樹。因此,在這篇論文中,我們結合在物 種整個基因體上重疊基因的內容與次序定義出一個新的衡量兩個基因 體之間距離的方法,我們稱之為重疊基因距離。然後我們根據原核生物 基因體兩兩之間的重疊基因距離並且使用UPGMA、NJ和FM的方法來建 構出他們之間的基因體樹。 根據上面所描述的方法,我們發展出一個網站伺服器的工具稱之為 OGtree,其可利用原核生物整個基因體之間的重疊基因距離建構出原核 生物的基因體樹。除此之外,我們也利用一些蛋白細菌的基因體來測試 OGtree在建構基因體樹的品質。相較於Luo所屬的研究團隊所建構出的 演化樹,我們OGtree所建構出來的基因體樹與利用16s rRNA以及串接多 個蛋白質序列所建構出來的演化樹是相當一致的。這些結果已說明了我 們的OGtree可以做為一個有用的工具來建構出更準確與更穩定的原核 生物基因體樹。
On the Study of Constructing Genome Trees of Prokaryotes Based
on Overlapping Genes
Student: Li-Wei Jiang
Advisor: Dr. Chin Lung Lu
Institute of Bioinformatics
Department of Biological Science and Technology
National Chiao Tung University
ABSTRACT
As more and more complete genomes of species are available, phylogenetic tree inference by comparing whole genome can be helpful for the reconstruction of evolutionary relationships of species. In addition to sequence-based phylogenomic approaches, methods based on whole genomes, like those based on gene content and gene orders, can be used to construct more precise and robust phylogenetic trees. However, it has been reported in the literature that the genome trees constructed only based on gene content or gene order may not be suitable for microbial genomes. To address these problems, Luo et al. [6, 7] have recently proposed an alternative way to reconstruct genome trees of bacteria using a measure based on the presence and absence of overlapping genes. The overlapping genes (OGs) are defined as adjacent genes whose coding sequences overlap partially or entirely. Actually, OGs are ubiquitous in microbial genomes and more conserved between species than non-overlapping genes, implying that
OGs can serve as better phylogenetic characters than non-overlapping genes for reconstructing the evolutionary relationships among microbial genomes.
In fact, during evolutionary process, species genomes are subject to genome rearrangements that alter the order and orientation of genes on the genomes, leading to that the orders of orthologous genes, as well as the ones of orthologous OG pairs certainly, even between two closely related species may not be conserved. This suggests that not only OG content but also orthologous OG order should be considered to reconstruct the genome trees of prokaryotic species. Therefore, in this thesis, we define a new distance measure, called as overlapping-gene distance, between two genomes based on a combination of OG content and OG order in their whole genomes. We then use UPGMA, as well as NJ and FM (Fitch-Margolias), to build the genome tree of prokaryotic genomes according to their pairwise OG distance.
Based on the method described above, we have implemented a web-based tool, called OGtree, for constructing the genome trees of prokaryotes based on OG distance between prokaryotic complete genomes. In addition, we have tested our OGtree on several Proteobacteria complete genomes to assess its quality of genome tree reconstruction. Compared with the phylogenetic trees produced by Luo et al. [6, 7], the genome trees constructed by our OGtree are quite consistent with those reference trees that were reconstructed based on 16S rRNAs as well as concatenation of multiple proteins. All these results have suggested that our OGtree can serve as a useful tool for constructing more precise and robust genome trees for prokaryotic genomes.
誌謝
首先要感謝我的家人,有你們的支持及鼓勵,才讓我得以全
力以付攻讀碩士學位。
特別感謝我的戰友張演富同學,兩年不離不棄的奮戰,從他
身上我學到了很多,尤其是網管方面,他可說是達人中的達人,
也在他身上了解到,怎麼從低笑點的笑話中得到歡樂。謝謝康
樂團長的學姐,每次聚餐或出遊的時候,都是她在精心策劃及
聯絡,實驗室真的不能沒有她,並在我有問題時候,能很有耐
心為我解答。感謝已畢業的學長們:家榮、威勳和光倫,沒有
他們的引領,我無法順利進入生物資訊的領域及容入做研究的
樂趣。也感謝志偉和慶恩,有你們的加入,讓實驗室添加更多
的歡樂,讓我在做研究之外也能動動頭腦,使我得以在繁忙、
苦悶之餘得以放鬆心情,繼續向前邁進。感謝智先及忠翰,時
常與我討論研究上的進度,得以讓我的研究能繼續發揚光大,
真的是辛苦你們了。
最後,我要感謝我的指導老師盧隆教授,時時刻刻督導、訓
誡我要不眠不休、全心全力認真努力作研究,讓我得以順利畢
業。
Contents
Chinese Absract ... i
ABSTRACT... iii
Acknowledgement ... v
List of Figures ... vii
1 Introduction... 1
2 Preliminaries ... 4
2.1 Overlapping genes ... 4
2.2 Orthologous Genes and Horizontal Gene Transfer ... 5
2.3 Bidirectional Best Hit ... 8
2.4 INPARANOID... 8 2.5 Breakpoint ... 10 3 Methods... 11 3.1 Overlapping-Gene Distance ... 11 3.2 Algorithm... 13 4 Implementation ... 16 4.1 Input of OGtree... 16 4.2 Output of OGtree ... 18 5 Experiments ... 21
5.1 13 γ-Proteobacteria complete genomes ... 21
5.2 18 Proteobacteria complete genomes ... 27
6 Conclusion ... 30
List of Figures
2.1 Genes A and B and C and D are overlapping genes, however A and B are partially overlap and C and D are completely overlap…..………. 5 2.2 Genes A1 and A2 are said to be paralogous genes if they are derived
from a duplication event. Genes A1x and A1y are called orthologous genes if they are derived from a speciation event……….…... 6 2.3 Effect of HGT on orthology. Gene XB in species B is acquired by
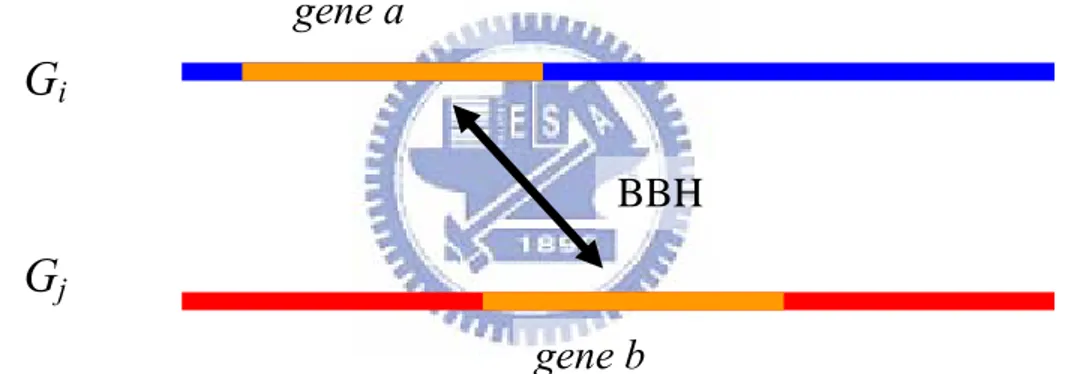
HGT from gene XC in species C………. 7 2.4 Gene a in genome Gi and gene b in genome Gj is called bidirectional
best-hit, if gene a is the most similar to gene b than any other gene in genome Gj, and vice versa……….8
3.1 The flowchartof our mehod……….15 4.1 OGtree web interface…...……….……..17 4.2 An example of OG distance matrix for 13 γ-Proteobacteria………...19 5.1 The NJ tree proposed by Luo et al. based on the 16S rRNA sequences
for 13γ-Proteobacteria………...22 5.2 The NJ tree proposed by Luo et al. based on the concatenation of 205 proteins for 13γ-Proteobacteria……….23 5.3 The UPGMA tree inferred by Luo et al. for 13γ-Proteobacteria…..23 5.4 The NJ tree constructed by OGtree for 13γ-Proteobacteria……..…25 5.5 The FM tree constructed by OGtree for 13γ-Proteobacteria…..…..26 5.6 The UPGMA tree constructed by OGtree for 13γ-Proteobacteria…26 5.7 The UPGMA tree inferred by Luo et al. using 18 Proteobacteria
5.8 The UPGMA tree produced by our OGtree using 18 Proteobacteria genomes………..29
Chapter 1
Introduction
The increasing availability of complete prokaryotic genomes provides us with an opportunity to reconstruct their genome trees based on the whole genomic information of organisms rather than based on individual genes or a small number of genes. In addition to sequence-based phylogenomic approaches, methods based on whole genomes, like those based on gene content (i.e., the presence and absence of genes) [1, 2] and gene orders [3–5], can be used to construct more precise and robust phylogenetic trees that are less influenced by anomalous events. As pointed out in [6, 7], however, the genome trees constructed only based on gene content or gene order may not be suitable for microbial genomes, because gene content (respectively, gene order) might have changed too little (respectively, too much) for biologists to perform adequate analyses of evolutionary distances between closely (respectively, distantly) related genomes. More recently, to address these problems, Luo et al. [6, 7] have proposed an alternative way to reconstruct genome trees of bacteria based on the presence and absence of overlapping genes in their complete genomes.
The overlapping genes (OGs) are defined as adjacent genes whose coding sequences partially or entirely overlap. OGs are ubiquitous in
microbial genomes, because approximately a third of all genes in all the microbial genomes sequenced to date are overlapping [8, 9]. In fact, there is a strong relationship between the total number of genes and the number of overlapping genes [8, 9]. In addition, it has been reported that OGs are more conserved between species than non-overlapping genes [10–12], because a mutation in the overlapping region causes changes in both genes and therefore natural selection against such mutations should be stronger. Based on these properties, Luo et al. [6, 7] have reported that overlapping genes can serve as better phylogenetic characters than non-overlapping genes for reconstructing the evolutionary relationships among bacterial genomes.
For the phylogenetic reconstruction of bacterial genomes, Luo et al. [6] defined the orthologous overlapping gene pairs between two different genomes, say i and j, to be pairs of genes that overlap in genome i and have orthologous counterparts that overlap in genome j. In an analogous method to that used in the analysis of gene content, they defined a new distance measure between two genomes based on the normalized number of their shared orthologous OG pairs. Based on this definition, they utilized current distance-based approaches of building tree, such as Neighbor-Joining (NJ) and Unweighted Pair-Group Method using Arithmetic Averages (UPGMA), to construct the genome trees of many completely sequenced bacterial genomes. In addition, Luo et al. [7] have further maintained an interactive database server, called BPhyOG (http://cmb.bnu.edu.cn/BPhyOG/), which allows the user to browse the genome trees of some bacterial genomes that were calculated in advance on the basis of shared orthologous OG pairs. However, their genome trees are not greatly consistent with those produced by traditional phylogenetic approaches based on 16S rRNAs and concatenation of multiple proteins (refer to the Experiments section for
details).
In fact, during evolutionary process, species genomes are subject to genome rearrangements (e.g., reversals and transpositions) that alter the order and orientation of genes on the genomes, leading to that the orders of orthologous genes, as well as the ones of orthologous OG pairs certainly, even between two closely related species may not be conserved. This suggests that not only OG content but also orthologous OG order should be considered to reconstruct the genome trees of prokaryotic species. For this purpose, we define the overlapping-gene distance between two genomes based on a measure of combining OG content and order in their whole genomes (refer to the Methods section for its detailed definition). We then use UPGMA, as well as NJ and FM (Fitch-Margolias), to build the genome tree of prokaryotic genomes according to their pairwise OG distance.
We have developed a web-based tool, called OGtree (http://bioalgorithm.life.nctu.edu.tw/OGtree/ ), for constructing the genome trees of prokaryotes based on OG distance between prokaryotic complete genomes. In addition, we have tested our OGtree on several Proteobacteria complete genomes to assess its quality of genome tree reconstruction. Compared with the phylogenetic trees produced by Luo et al. [6, 7], the genome trees constructed by our OGtree are quite consistent with those reference trees that were reconstructed based on 16S rRNAs as well as concatenation of multiple proteins. All these results have suggested that our OGtree can serve as a useful tool for constructing more precise and robust genome trees for prokaryotic genomes.
Chapter 2
Preliminaries
In this chapter, we shall first introduce basic concept of overlapping genes, orthologous genes, horizontal gene transfer and breakpoint. We shall then describe two approaches, BBH and INPARANOID, for identifying putative orthologous genes.
2.1
Overlapping genes
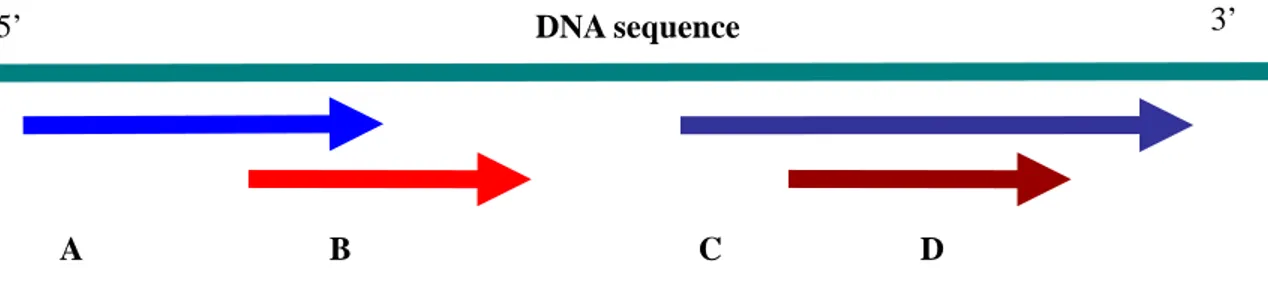
The overlapping genes (OGs) are defined as adjacent genes whose coding sequences partially or entirely overlap, as shown in Figure 2.1 for an example. OGs are ubiquitous in microbial genomes, because approximately a third of all genes in all the microbial genomes sequenced to date are overlapping [8, 9]. In fact, there is a strong relationship between the total number of genes and the number of overlapping genes [8, 9]. In addition, it has been reported that OGs are more conserved between species than non-overlapping genes [10–12], because a mutation in the overlapping region causes changes in both genes and therefore natural selection against such mutations should be stronger. All these properties above may suggest
that overlapping genes can serve as better phylogenetic characters than non-overlapping genes for reconstructing the evolutionary relationships among bacterial genomes.
5’ DNA sequence 3’
A B C D
Figure 2.1: Genes A and B and genes C and D are two pairs of overlapping
genes, where A and B overlap partially and C and D overlap completely.
2.2 Orthologous Genes and Horizontal Gene Transfer
Basically, orthologous genes are in different species that derived from a single gene in the last common ancestor of these species. By contrast,
paralogous genes are duplicated within a genome. In general, orhologous
genes have the same functions in the respective organisms; however, the biological functions of paralogous genes are distinct.
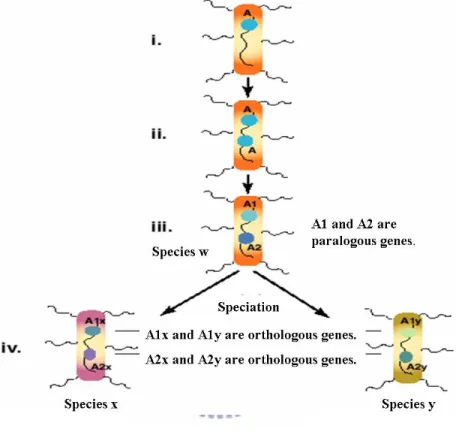
Figure 2.2 shows evolutionary process illustrating orhologous genes and paralogous genes relationships. (i) Initially, there is a gene called A in species w. (ii) Gene A is duplicated by producing two copies of A in the same chromosome. (iii) After that, the two copies diverge by evolution, forming related genes A1 and A2. Therefore, these two genes are called paralogous genes. (iv) Two species x and y evolve from species w, called
the gene A1 are denoted by A1x and A1y, and the descendants of the A2 by A2x and A2y. Therefore, genes A1x and A1y are orthologous genes and genes A2x and A2y are also orthologous genes.
Figure 2.2: Genes A1 and A2 are said to be paralogous genes if they are
derived from a duplication event. Genes A1x and A1y are called orthologous genes if they are derived from a speciation event.
With a rapid enrichment of genome sequences, how to identify orthologous genes between different genomes becomes an important task. The simple assumption is that the sequences of orthologous genes should be more similar to each other than with any other genes in compared genomes. In the following sections, we shall introduce two methods bidirectional best hit and INPARANOID, for identifying the orthologous genes with inparalogs between two give genomes.
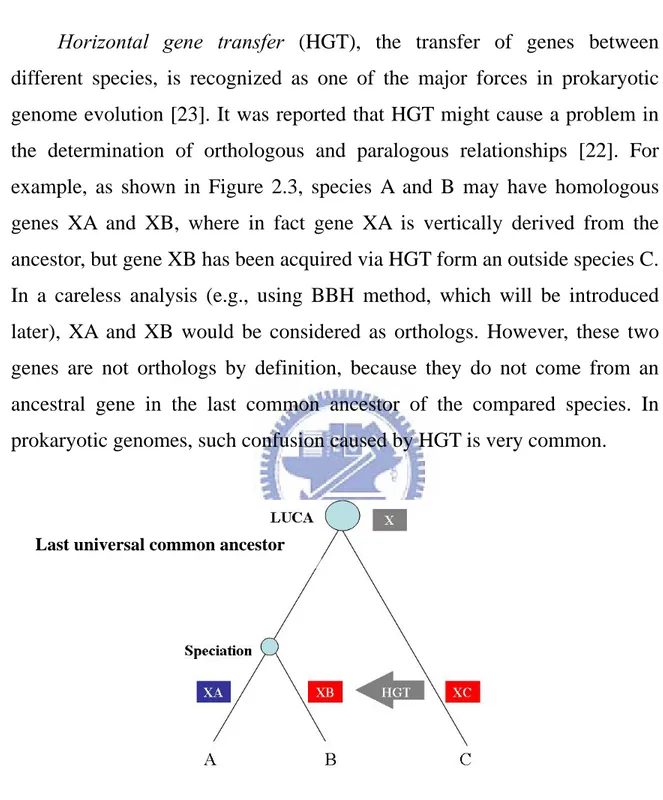
Horizontal gene transfer (HGT), the transfer of genes between different species, is recognized as one of the major forces in prokaryotic genome evolution [23]. It was reported that HGT might cause a problem in the determination of orthologous and paralogous relationships [22]. For example, as shown in Figure 2.3, species A and B may have homologous genes XA and XB, where in fact gene XA is vertically derived from the ancestor, but gene XB has been acquired via HGT form an outside species C. In a careless analysis (e.g., using BBH method, which will be introduced later), XA and XB would be considered as orthologs. However, these two genes are not orthologs by definition, because they do not come from an ancestral gene in the last common ancestor of the compared species. In prokaryotic genomes, such confusion caused by HGT is very common.
Last universal common ancestor
Figure 2.3: Effect of HGT on orthology. Gene XB in species B is acquired
2.3
Bidirectional Best Hit
A simple method, called the bidirectional best hit (BBH), for prediction of orthologous genes in two organisms is to search for a pair of sequences by performing a BLAST. BBH is defined to be a pair of genes a and b from two genomes Gi and Gj such that b is the best hit (i.e., most similar gene) when a
is compared against all genes of Gj , and vice versa (see Figure 2.4 for
illustration). It has been evidenced that such a BBH approach of identifying putative orthologs works reasonably well for bacterial genomes [15].
gene b gene a
BBH
G
jG
iFigure 2.4: Gene a in genome Gi and gene b in genome Gj form a BBH, if
gene a is the most similar to gene b than any other gene in genome Gj, and
vice versa.
2.4
INPARANOID
Remm et al. [18] have developed a program, called INPARANOID, for finding orthologs with inparalogs from two species genomes, based on the following steps.
Given two species genomes, the first step of INPARANOID is to run BLAST search between all pairs of gene sequences. Consequently, the pairs
with similarity scores above the predefined threshold are reserved for further analyses on the next step.
Next, INPARANOID continues to find two-way best hits (i.e., BBH) as potential orthologs and further include inparalogs to form putative orthologous groups, based on the idea that the main ortholog has more similarity to inparalogs from the same species than to any sequence from another species.
Third, INPARANOID applies a clustering algorithm to all the putative orthologous groups as follows:
(1) Merge two orthologous groups if the symmetric best orthologous genes are already clustered in the same group.
(2) Merge two orthologous groups if a main orthologous gene in one genome has equally best hit to two orthologous genes in the other genome.
(3) Delete a new group if one of the orthologous genes already belongs to a much stronger (i.e., high similarity) group.
(4) Merge two groups if one gene of the orthologous gene pair has a high similarity in another group.
(5) All other overlapping groups of inparalogs are separated based on their similarity to the orthologous gene.
Finally, the confidence values of a set of orthologous groups are calculated to estimate the reliability of each group (for details, we refer the reader to [18]). INPARANOID is a free program that can be accessed at
2.5
Breakpoint
We shall use the same notation as adopted in Sankoff’s paper [4] to introduce the breakpoint. Let G and H be two strings (genomes) of signed (+ or -) symbols (representing genes). Consider two strings G = g1g2…gn and H
= h1 h2…hn, where n is the number of gene families. We say that gi precedes
gi+1 in G for each 1≦i<n. If gene a precedes b in G and neither a precedes
b nor –b precedes –a in H, then they produce a breakpoint in G. The number
of breakpoints in G is equal to the number of breakpoints in H.
For example, let G = (-2, -1, -3, 4) and H = (3, 1, 2, 4). Note here that to calculate the breakpoint between G and H, it is the convention that an additional gene 0 will bee added in the beginnings of G and H, and an additional gene 5 will be added in the ends of G and H. That is, in this convention, G = (0, -2, -1, -3, 4, 5) and H = (0, 3, 1, 2, 4, 5). By definition, the breakpoint between G and H is 2, because the two breakpoints in G are (0, -2) and (-3, 4).
Chapter 3
Methods
In this chapter, we shall first introduce overlapping-gene distance, and then present our algorithm for construction of genome trees based on the overlapping-gene distance between species whole genomes.
3.1
Overlapping-Gene Distance
As used in the studies of genome rearrangements, we utilize a signed integer to represent a gene encoded in a chromosome, with its sign indicating the transcriptional orientation of the corresponding gene (e.g. , ”+” stands for 5’ → 3’ and ”−” stands for 3’ ← 5’ ). Moreover, we use a pair of signed integers ( x, y ) to represent an OG of x and y. Basically, there are three possible overlapping types (or structures / directions) of OGs [11, 13]: (1) unidirectional OGs with sign (+, +) or (−,−), that is, the 3’ end of one gene overlaps with the 5’ end of the other, (2) convergent OGs with sign (+,−), that is, the 3’ ends of the two genes overlap, and (3) divergent OGs with sign (−, +), that is, the 5’ ends of the two genes overlap. It has been reported that in prokaryotic genomes unidirectional OGs are most
widespread, convergent OGs are less common, and divergent OGs are rare [8, 9, 13].
For our purpose, the orthologous OG pairs we considered here are further restricted to those orthologous OG pairs with the same (i.e., conserved) overlapping structures. Let {c1, c2, . . . , cn} denote the set of total
orthologous OG pairs between two given genomes Gi and Gj. Then we
represent these two genomes by two permutations Gi = (a1, a2, . . . , an) and
Gj = (b1, b2, . . . , bn), respectively, on the same set of {c1, c2, . . . , cn}. We
also say that, for example, ak precedes ak+1 in genome Gi, where 1 ≤ k < n,
and an precedes a1 if Gi is circular. For simplicity of our description, we here
assume Gi and Gj to be circular, because the genomes of prokaryotes are
typically circular. Two consecutive OGs, say (u, v) and (x, y) with (u, v) preceding (x, y), in Gi determine a breakpoint if neither (u, v) precedes (x, y)
nor (− y, −x) precedes (−v, −u) in Gj . It is not hard to see that the number
of breakpoints in Gi is equal to the number of breakpoints in Gj . Then we
define the overlapping-gene distance Di,j between Gi and Gj as follows.
⎟
⎟
⎠
⎞
−
+
⎜⎜
⎝
⎛ −
×
+
⎟⎟
⎠
⎞
⎜⎜
⎝
⎛
×
=
j j i i c j i o j ix
n
x
x
n
x
w
n
b
w
D
, ,In the above formula, bi,j denotes the number of breakpoints in genome
Gi with respect to genome Gj, and xi and xj denote the numbers of total OGs
in Gi and Gj , respectively. Note that if the considered genomes are linear,
the denominator of the first term in the right hand of this equation should be
Gi and Gj . Basically, Di,j evaluates the distance between Gi and Gj by
considering the orthologous OG order measure as defined in the first term (i.e., the normalized breakpoint distance) and the OG content measure as defined in the second term (i.e., the sum of the ratios of OGs found in one genome but not found in another genome to the number of total OGs found in a genome). Then wo and wc can be considered as the weight of
orthologous OG order and the weight of OG content, respectively, where both of their defaults are 1’s in OGtree.
3.2
Algorithm
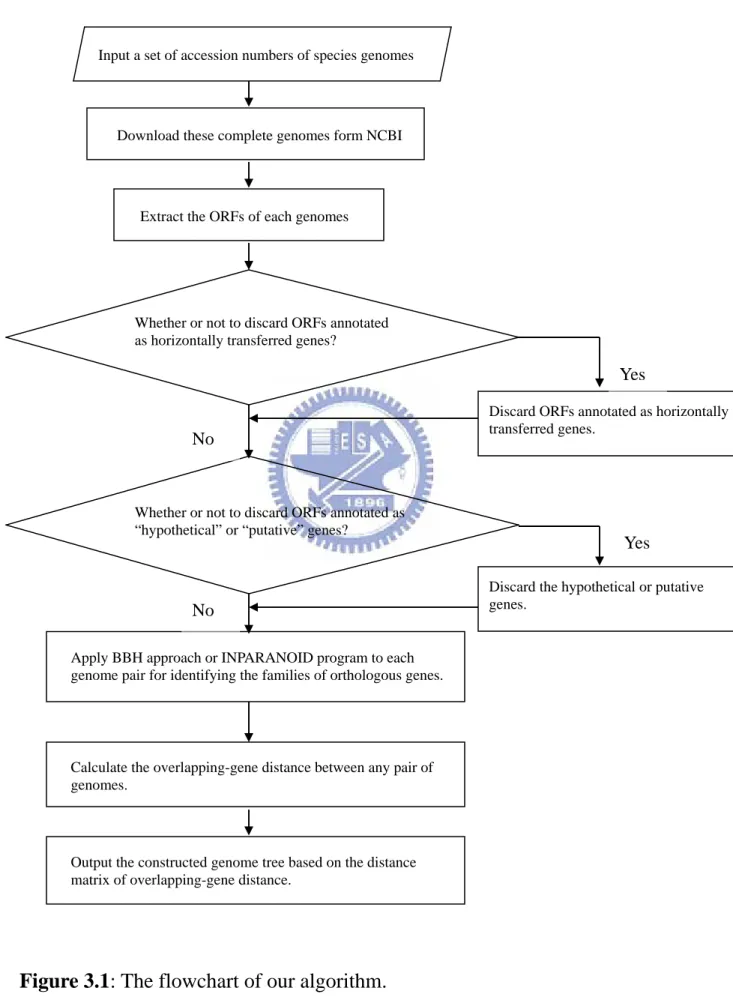
Figure 3.1 shows the flowchart of our algorithm for constructing the genome tree of prokaryotes based on overlapping-gene distance.
Given the accession numbers of several species, the first step of our algorithm is to download complete genomes from the National Centre for Biotechnology Information (NCBI) according to the accession numbers specified by the user. The putative genes are then extracted from each of these genomes on the basis of the coding sequence (CDS) annotation. Inevitably, some of these putative genes may be misannotated in each genome downloaded from the NCBI. We may therefore exclude those genes that were annotated as being unknown, hypothetical or putative for a stringent analysis. In addition, horizontal gene transfer (HGT), the transfer of genes between different species, has been reported to be very common in prokaryotes [14]. It may obscure the OG pairs with which we hope to reconstruct the genome tree of prokaryotes. Hence, we offer an additional option in our OGtree to remove those genes that were annotated as horizontally transferred genes at the HGT-DB database [14], where
HGT-DB currently provides the lists of putative horizontally transferred genes for a large number of prokaryotic complete genomes.
Next, we use BLASTP program to determine putative orthologous genes between two genomes by using bidirectional best hit (BBH) approach. In addition, we use Inparanoid [14] as an alternative to identify putative orthologous genes between any two genomes. It has been demonstrated that Inparanoid is the best among five currently existing methods of automatically detecting orthologous genes [16].
After that, two adjacent genes in each genome are identified as overlapping genes (OGs), or an OG pair, if their CDSs overlap partially or completely. Two OGs, say (a, c) and (b, d), from different genomes are then considered as an orthologous OG pair if a and b, as well as c and d, are orthologous to each other, and (a, c) and (b, d) have the same overlapping structure.
Finally, for any two genomes Gi and Gj , we compute their OG distance
Di,j on basis of their OG pairs. Then we apply distance-based approaches of
building trees, such as UPGMA, NJ and FM, to the matrix of overlapping-gene distance between genomes for constructing genome trees of the input prokaryotic genomes.
Input a set of accession numbers of species genomes
Download these complete genomes form NCBI
Extract the ORFs of each genomes
Whether or not to discard ORFs annotated as horizontally transferred genes?
Yes
Discard ORFs annotated as horizontally transferred genes.
No
Whether or not to discard ORFs annotated as “hypothetical” or “putative” genes?
Figure 3.1: The flowchart of our algorithm.
Yes
Discard the hypothetical or putative genes.
No
Apply BBH approach or INPARANOID program to each genome pair for identifying the families of orthologous genes.
Calculate the overlapping-gene distance between any pair of genomes.
Output the constructed genome tree based on the distance matrix of overlapping-gene distance.
Chapter 4
Implementation
Based on the algorithm we described in the previous chapter, we have implemented a web server called OGtree (short for genome tree based on
Overlapping Genes). The kernel programs of OGtree were written in C
and Perl. Its web interface was implemented in PHP. It is available at
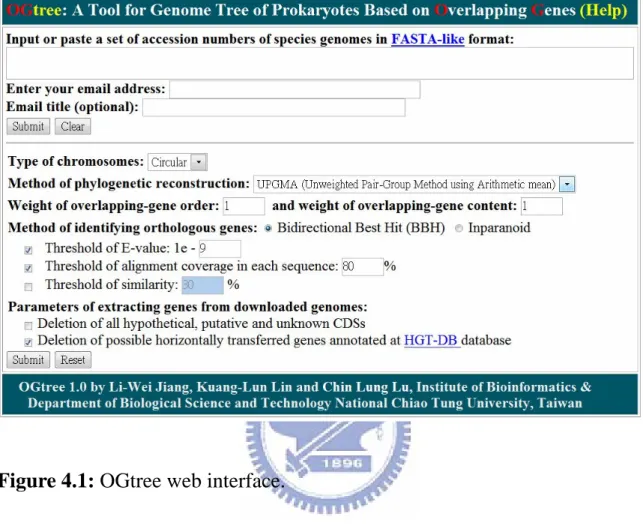
http://bioalgorithm.life.nctu.edu.tw/OGtree/ for online analysis and can be easily accessed via a simple web interface, as shown in Figure 4.1.
4.1
Input of OGtree
1. Enter or paste a set of accession numbers of prokaryotic genomes in FASTA-like format. The so-called FASTA-like format starts with a single-line description beginning with a right angle bracket (">"), followed by a line of accession number of a prokaryotic species. The following is an input example with 3 γ-proteobacterial genomes.
>Ba
NC_002528 >Ec
NC_000913 >Hi
Figure 4.1: OGtree web interface.
Then OGtree will automatically download the whole genomes of all the specified prokaryotes from the NCBI.
2. Enter an email address in the email box, via which the user will be notified of the result obtained by OGtree when the submitted job is finished. If necessary, the user can enter a text into the box of email title that will be served as the subject of the returned email later.
3. Just click "Submit" button, if the user would like to run OGtree with default parameters; otherwise, the user continues with the following parameter settings.
4. Choose the chromosomal type of the input prokaryotic genomes, which currently can be either circular (default) or linear.
5. Specify the method used by OGtree to reconstruct the genome tree. Currently, it can be either UPGMA (default), NJ or FM.
6. Specify the weight of overlapping gene order (whose default is 1) or specify the weight of overlapping gene content (whose default is 1). Note that both of them can be any real numbers.
7. Choose the method used by OGtree to identify the orthologous genes between any pair of input genomes. This method can be either bidirectional best hit (BBH) or Inparanoid. In addition, the user can further change the default parameters, if necessary, to control the results of BLASTP for determining the putative orthologous genes. They include threshold of E-value (whose default is 1e-9) and threshold of alignment coverage in each sequence (whose default is 80%), and threshold of similarity (that was disabled in default).
8. Check the box that deletion of all hypothetical genes, if the user would like OGtree to delete all the CDSs whose translated products were annotated as hypothetical, putative and unknown proteins in the NCBI. 9. Check the box that deletion of all horizontally transferred genes, if the
user would like OGtree to delete all the CDS that were annotated as horizontally transferred genes at the HGT-DB database.
10. Click "Submit" button to run OGtree.
4.2
Output of OGtree
In the output page, OGtree will first show the input genome data and user-defined parameters. Next, it will show the overlapping-gene distance matrix computed according to the downloaded genomes from the NCBI, as was shown in Figure 4.2.
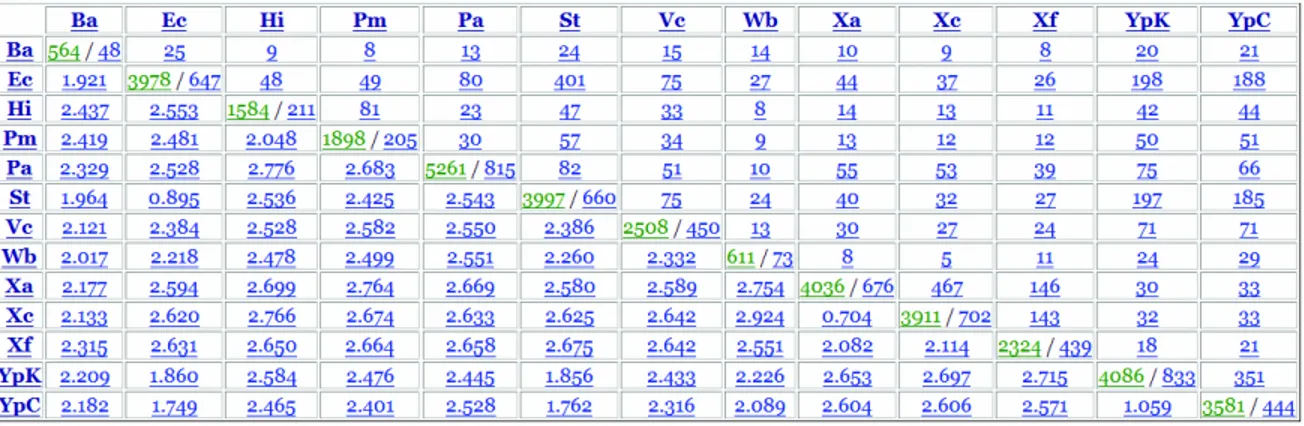
Figure 4.2: An example of OG distance matrix for 13 γ-Proteobacteria.
In each entry of the diagonal, the number of the numerator denotes the number of genes that are extracted from the corresponding genome, or remain in the genome after deleting those genes that were annotated as horizontally transferred genes and/or hypothetical, putative and unknown genes; the number of the denominator denotes the number of OG pairs identified by OGtree in the corresponding genome. Note that both of numerator and denominator are associated with a link, via which the user can further view the details about all the extracted genes or all the identified OG pairs from each corresponding genome. For example, the numerator link will show the gene ID, protein ID, gene name, locus-tag, start and end positions, and strand for each extracted gene, and the denominator link will display the gene IDs of each GO pair, as well as their overlapping direction.
In the upper triangle, each entry contains an integer denoting the number of identified orthologous OG pairs between the two corresponding genomes. Note that the entry link will show the details of each orthologous OG pair, including its overlapping direction and length, the number of its orthologous
OG pairs found in other genomes, as well as the details of its component genes, including gene ID, gene name, location, strand, locus-tag, protein ID and product, COG ID (if have), and translated protein.
In the lower left triangle, each entry denotes the computed overlapping-gene distance between the two corresponding genomes. Note that the user can click the entry link to view the details about the orthologous OG orders in the two corresponding genomes, their breakpoints, and their overlapping-gene distance.
Finally, OGtree will show a genome tree according to estimated OG distance between any pair of genomes using UPGMA, NJ or FM method. Note that our OGtree also provides in the output page with a text file of computed OG distance matrix in the PYLIP format and a text file of constructed genome tree in the Newick format, so that the user can download them for post-processing analysis.
Chapter 5
Experiments
In this chapter, we shall demonstrate the applicability of our OGtree by carrying out two experiments and compare the genome trees obtained by our OGtree to the phylogenetic trees predicted by Luo et al. [6] using the trees constructed based on 16s rRNA and concatenation of multiple genes as reference trees.
5.1
13 γ-Proteobacteria complete genomes
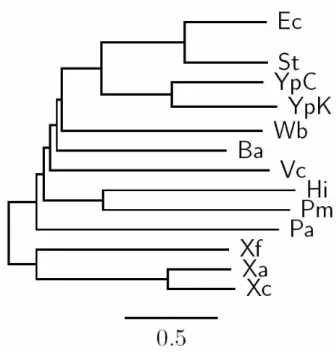
In this experiment, we selected 13 γ-Proteobacteria as the testing dataset that consists of B. aphidicola (abbreviated as Ba, NC_002528), E. coli (Ec, NC_000913), H. influenzae (Hi, NC_000907), P. aeruginosa (Pa, NC_002516), P. multocida (Pm, NC_002663), S. typhimuriu (St, NC_003197), V. cholerae (Vc, NC_002505), W. brevipalpis (Wb, NC_004344), X. axonopodis (Xa, NC_003919), X. campestris (Xc, NC_003902), X. fastidiosa (Xf, NC_002488), Y. pestis CO92 (YpC, NC_003143), and Y. pestis KIM (YpK, NC_004088). In addition, we used the phylogenetic trees constructed based on 16S rRNAs and concatenation
of 205 orthologous proteins [17] as reference trees (see Figures 5.1 and 5.2) and compared the genome trees obtained by our OGtree to those phylogenetic tree (see Figure 5.3) predicted by Luo et al. [6]. Basically, these two references have almost the same tree topology, just with a slight difference in the position of V. cholerae. The species of V. cholerae was placed as a neighbor of P. aeruginosa in the reference tree constructed using the concatenation of 205 proteins, whereas it was placed a little away from P.
aeruginosa in the reference tree of 16S rRNAs.
Figure 5.1: The NJ tree proposed by Luo et al. based on the 16S rRNA
Figure 5.2: The NJ tree proposed by Luo et al. based on the concatenation
of 205 proteins for 13γ-Proteobacteria (adapted form [6]).
Figure 5.3: The UPGMA tree constructed by Luo et al. for 13 γ
As mentioned before, some misannotated genes may be included in the genomes of public databases. Therefore, we may exclude those CDSs annotated as being unknown, hypothetical or putative from each downloaded genome in our analysis, as done in [6]. However, we found that most of the CDSs in W. brevipalpisa are currently annotated as unknown, hypothetical or putative, leading us to find no orthologous OG pair between W.
brevipalpisa and other species, if all these CDSs in W. brevipalpisa are
removed from our analysis. Here, instead of this method, we first removed those genes currently annotated as horizontally transferred genes at the HGT-DB database [14] and then applied more stringent criteria of identifying putative orthologous genes by using BBH and setting the parameters with at least 80% of each authentic CDS sequence involved in the alignment and a minimum E-value of 10−9.
Consequently, the NJ and FM trees (see Figures 5.4 and 5.5, respectively) we obtained using OGtree have the same tree topology, which slightly differ from the one in the UPGMA tree (see Figure 5.6) with respect to the positions of W. brevipalpis and B. aphidicola. The two endosymbionts of W. brevipalpis and B. aphidicola were placed as neighbor taxa in the NJ and FM trees, whereas they were as a sister group in the UPGMA tree.
In the comparison of the phylogenetic trees inferred by Luo et al. [6], our genome trees show more precise and robust phylogenies for the completely sequenced genomes of 13 γ- Proteobacteria. For instance, the topology of the UPGMA tree (see Figure 5.4) we constructed here based on the OG distance is completely consistent with that in the reference tree based on 16S rRNAs (see Figure 5.1), and nearly consistent with that in the reference tree constructed using the concatenation of 205 proteins (see Figure 5.2). It is worth mentioning that the two endosymbionts W.
brevipalpis and B. aphidicola were separated from each other in the
UPGMA tree (see Figure 5.3) constructed by Luo et al. [6]. In contrast, W.
brevipalpis and B. aphidicola in our UPGMA tree, as well as in both
reference trees, were placed as a sister group, suggesting that there should be a common origin for these two species both of which are symbiotic and have reduced genomes.
Among the three tree-building methods in our experiment, the UPGMA method produced a much more congruent genome tree compared to both the NJ and FM methods, if they were based on the OG distance we defined in this study. This characteristic was also pointed out by Luo et al. in their studies [6, 7] only on the basis of the content of OG pairs. It has been reported that evolution of OGs occurs at a universal mutation rate across bacterial genomes [8, 9]. Perhaps due to this property, the UPGMA method is more suitable for the reconstruction of phylogenies particularly based on OG pairs, when compared to the NJ and FM methods.
Figure 5.5: The FM tree constructed by OGtree for 13γ-Proteobacteria.
Figure 5.6: The UPGMA tree constructed by OGtree for 13 γ
5.2
18 Proteobacteria complete genomes
In the second experiment, we reconducted the above experiment but with including additional two α-Proteobacteria, C. crescentus (abbreviated as Cc, NC_002696) and R. conorii (Rc, NC_003103), and three
β-Proteobacteria, N. europaea (Ne, NC_004757), N. meningitides MC58
(NmM, NC_003112) and N. meningitidis Z2491 (NmZ, NC_003116). In the UPGMA tree constructed by Luo et al. [7], as was shown in Figure 5.7, the species N. europaea, a β-Proteobacteria, was separated from the other two
β-Proteobacteria N. meningitidis MC58 and N. meningitidis Z2491 and was
placed in the group containing all 13 γ-Proteobacteria. In contrast, all these three β-Proteobacteria in our UPGMA tree was placed as a sister group, as illustrated in Figure 5.8. Particularly, the testing α-, β- and γ-Proteobacteria correctly form three monophyletic clades in our UPGMA tree.
Figure 5.7: The UPGMA tree inferred by Luo et al. [7] using 18
GAMMA
BETA
ALPHA
Figure 5.8: The UPGMA tree produced by our OGtree using 18
Chapter 6
Conclusion
In this thesis, we have conducted the study of constructing genome trees for prokaryotes according to overlapping-gene distance that is based on a combination of overlapping-gene order and overlapping-gene content. Based on this approach, we have implemented a web server tool, called OGtree for online analysis.
According to our experiments, the genome trees constructed by our OGtree are quite consistent with those reference trees that were reconstructed based on 16S rRNAs as well as concatenation of multiple proteins, compared with the phylogenetic trees produced by Luo et al. [6, 7]. Furthermore, among the tree-building methods in our experiments, the UPGMA method produced much more congruent genome trees compared to both the NJ and FM methods, if they were based on the OG distance we defined in this study. This characteristic was also pointed out by Luo et al. in their studies [6, 7] only on the basis of the content of OG pairs. It has been reported that evolution of OGs occurs at a universal mutation rate across bacterial genomes [8, 9]. Perhaps due to this property, the UPGMA method is more suitable for the reconstruction of phylogenies particularly based on
OG pairs, when compared to the NJ and FM methods.
In this study, we have demonstrated that our OGtree was able to construct more precise and robust genome trees for some prokaryotic genomes. Therefore, we believe that our OGtree can provide interesting insights into the study of evolutionary relationships of completely sequenced prokaryotic genomes.
References
[1] Snel, B., Bork, P., and Huynen, M. A. (1999) Genome phylogeny based on gene content. Nature Genetics, 21, 108–110.
[2] Snel, B., Huynen, M. A., and Dutilh, B. E. (2005) Genome trees and the nature of genome evolution. Annual Review of Microbiology, 59, 191–209.
[3] Blanchette, M., Kunisawa, T., and Sankoff, D. (1999) Gene order breakpoint evidence in animal mitochondrial phylogeny. Journal of
Molecular Evolution, 49, 193–203.
[4] Sankoff, D. (1999) Genome rearrangement with gene families.
Bioinformatics, 15, 909–917.
[5] Belda, E., Moya, A., and Silva, F. J. (2005) Genome rearrangement distances and gene order phylogeny in γ-Proteobacteria. Molecular
Biology and Evolution, 22, 1456–1467.
[6] Luo, Y., Fu, C., Zhang, D. Y., and Lin, K. (2006) Overlapping genes as rare genomic markers: the phylogeny of γ-Proteobacteria as a case study. Trends in Genetics, 22, 593– 596.
[7] Luo, Y., Fu, C., Zhang, D. Y., and Lin, K. (2007) BPhyOG: an interactive server for genome-wide inference of bacterial
phylogenies based on overlapping genes. BMC Bioinformatics, 8, 266.
[8] Fukuda, Y., Nakayama, Y., and Tomita, M. (2003) On dynamics of overlapping genes in bacterial genomes. Gene, 323, 181–187.
[9] Johnson, Z. I. and Chisholm, S. W. (2004) Properties of overlapping genes are conserved across microbial genomes. Genome Research,
14, 2268–2272.
[10] Fukuda, Y., Washio, T., and Tomita, M. (1999) Comparative study of overlapping genes in the genomes of Mycoplasma genitalium and
Mycoplasma pneumoniae. Nucleic Acids Research, 27, 1847–1853.
[11] Krakauer, D. C. (2000) Stability and evolution of overlapping genes.
Evolution: International Journal of Organic Evolution, 54, 731–739.
[12] Sakharkar, K. R., Sakharkar, M. K., Verma, C., and Chow, V. T. (2005) Comparative study of overlapping genes in bacteria, with special reference to Rickettsia prowazekii and Rickettsia conorii.
International Journal of Systematic and Evolutionary Microbiology, 55, 1205–1209.
[13] Rogozin, I. B., Spiridonov, A. N., Sorokin, A. V., Wolf, Y. I.,
Jordan, I. K., Tatusov, R. L., and Koonin, E. V. (2002) Purifying and directional selection in overlapping prokaryotic genes. Trends in
Genetics, 18, 228–232.
[14] Garcia-Vallve, S., Guzman, E., Montero, M. A., and Romeu, A. (2003) HGT-DB: a database of putative horizontally transferred genes in prokaryotic complete genomes. Nucleic Acids Research, 31, 187–189.
[15] Tatusov, R. L., Koonin, E. V., and Lipman, D. J. (1997) A genomic perspective on protein families. Science, 278, 631–637.
[16] Hulsen, T., Huynen, M. A., deVlieg, J., and Groenen, P. M. (2006) Benchmarking ortholog identification methods using functional genomics data. Genome Biology, 7, 4.
[17] Lerat, E., Daubin, V., and Moran, N. A. (2003) From gene trees to organismal phylogeny in prokaryotes: the case of the
[18] Remm, M., Storm, C.E. and Sonnhammer, E.L. (2001) Automatic clustering of orthologs and in-paralogs from pairwise species comparisons,Journal of molecular biology, 314, 1041-1052. [19] David Sankoff (1999) Genome rearrangement with gene families,
Bioinformatics, 15,909,917.
[20] Fitch W. M. (1970) Distinguishing homologous from analogous proteins,Systematic zoology, 19, 99-106.
[21] Sonnhammer EL, Koonin EV. (2002) Orthology, paralogy and proposed classification for paralog subtypes, Trend Genet, 18, 619-620.
[22] Koonin E.V. (2005) Orthologs, Paralogs, and Evolutionary Genomics, Annual review of genetics, 39, 309-338.
[23] Koonin E.V., Makarova, K.S. and Aravind, L. (2001) Horizontal gene transfer in prokaryotes: Quantification and Classification,
Annual review of microbiology, 55, 709-742.
[24] Gray GS, Fitch WM. (1983) Evolution of antibiotic resistance genes: the DNA sequence of a kanamycin resistance gene from
Staphylococcus aureus,Molecular biology and evolution, 1, 57-66.
[25] Roman L. Tatusov, Michael Y. Galperin, Darren A. Natale an Eugene V. Koonin (2000) The COG database: a tool for
genome-scale analysis of protein function and evolution, Nucleic
Acids Research, 28, 33-36.
[26] Tatsov RL, Koonin EV, Lipman DJ. (1997) A genomic perspective on protein families, Science, 278, 631-637.
![Figure 5.1: The NJ tree proposed by Luo et al. based on the 16S rRNA sequences for 13γ-Proteobacteria (adapted form [6])](https://thumb-ap.123doks.com/thumbv2/9libinfo/8254162.171819/32.918.263.663.463.873/figure-tree-proposed-luo-based-sequences-proteobacteria-adapted.webp)
![Figure 5.2: The NJ tree proposed by Luo et al. based on the concatenation of 205 proteins for 13γ-Proteobacteria (adapted form [6])](https://thumb-ap.123doks.com/thumbv2/9libinfo/8254162.171819/33.918.160.785.106.941/figure-tree-proposed-based-concatenation-proteins-proteobacteria-adapted.webp)