分析專利資訊網絡以發掘企業競爭情報
研究生:陳皇志 指導教授:劉敦仁 博士
交通大學資訊管理研究所
摘要
競爭情報可以協助決策制定,並輔助決策執行者判斷企業體系是否具有競爭 力。此外,決策制定者可以藉由競爭情報來分析哪些產業或是技術領域具有競爭 性,藉以掌握競爭環境。如何發掘企業競爭情報,找出企業競爭對手的優勢以及 其市場的定位,以擬定正確的決策或策略是重要的研究議題。 專利資料可以用來分析和擷取一個公司企業的專利布局或技術的相關資 訊,是競爭情報重要的資料來源。本研究以實踐社群網絡(Community of Practice) 的概念分析專利資料,定義專利、技術領域與公司間之連結關係,以建構企業專 利資訊網絡。本研究進一步採用社群網絡演算法分析專利資訊網絡,以發掘企業 競爭情報。所提出的方法,可達到分析競爭情報趨勢,並找出企業的競爭者專利 布局以及潛在技術領域之成效。 關鍵字:專利趨勢,專利管理,競爭情報,實踐社群Analyzing Patent Information Network to
Discover Competitive Intelligence
Student:Huang-Chih Chen Advisor:Dr. Duen-Ren Liu
Institute of Information Management
National Chiao Tung University
Abstract
Competitive intelligence plays a key role to business in strategic decision-making support and assists executives in identifying whether the firm is competitive. Besides, decision maker can analyze which domains of technologies are competitive via competitive intelligence analysis. Accordingly, it is an important issue to discover competence intelligence to find out competitor’s strength and position in the marketing place in order to make a right decision or strategy.
Patent data is an important source of competitive intelligence. Patent data can be used to analyze and extract important information about a company’s patent portfolio and technology fields. In this work, we employ the concept of Community of Practice (COP) to analyze competitive intelligence. We define several link relationships between patent, technology field and company in order to construct a Patent Information Network (PIN). A COP algorithm is adopted to discover competitive intelligence from the patent information network. Our result shows that the proposed approach is effective to discover the trend of competitive intelligence and find out the patent portfolio of competitors and latent technology fields.
誌 謝
時光荏苒,兩年時間稍縱即逝,而我的學生生活也即將告一個段落,未來等 待著我去開創。 我要感謝我的論文指導教授劉敦仁老師,兩年來對我的指導和建議,以及給 予我極大的自由發揮空間,讓我能夠在安心的環境下,順利的完成碩士學位。另 外也感謝兩位口試委員蔡銘箴老師以及邱登裕老師,在口試時提供的寶貴意見, 使本論文能夠更加的完善。 另外要感謝實驗室的所有夥伴對我的支持以及幫助。感謝怡瑾學姊對我生活 上的問題細心關懷;志坤學長以及錦慧學姊對於我論文口試準備上的建議;感謝 桄瑋學長、柏村學長、秋雯學姊、韋孝學長以及明立學長對我的照顧。另外也感 謝北晨、栩嘉、宛蓉以及詩瑩等跟我兩年來一起努力的同學們,感謝你們的陪伴, 使這兩年的生活過的很精采,也恭喜你們順利畢業。感謝俊男、俞翔、聖鈞、彥 廷以及怡君等學弟妹為實驗室注入新的活力。此外,要特別感謝孟蓉學姊對我論 文的指導以及幫助,因為妳的幫助以及在我茫然的時候提供寶貴的意見,才能讓 我的論文進度能夠順利完成,謝謝妳。 最後要感謝我的父母以及我的姐姐,給予我精神以及物質上的支持,並給予 我最大的自由空間,且忍受我的任性,這份學位的榮耀應該歸於你們,你們的支 持是我堅持下去的原動力。 離開,並不是結束,而是另一個階段的開始,我將善用交大給我的一切,開 創我未來的人生旅程。 皇志 2006/7Table of Content
1. INTRODUCTION ... 1
2. RELATED WORKS... 3
2.1 Competitive Intelligence ... 3
2.2 Community of Practice and Ontology-Based Network Analysis ... 3
2.3 Patent Analysis... 4
2.4 Technology Indicators ... 5
3. PROPOSED METHODOLOGY... 6
3.1 Overview... 6
3.2 Information Extraction ... 8
3.3 Formal Relation Calculation ... 8
3.4 Trend Analysis... 9
3.5 Discovery of Competitive Intelligence ... 10
4. DISCOVERING COMPETITIVE INTELLIGENCE ... 11
4.1 Patent Information Network... 11
4.1.1 Class ↔ Patent Relation... 12
4.1.2 Patent ↔ Patent Relation ... 13
4.1.3 Company ↔ Class Relation... 14
4.1.4 Company ↔ Patent Relation ... 15
4.2 Identifying Competitive Intelligence... 15
4.2.1 Competitor Discovery... 16
4.2.2 Identifying Competitor’s Patent Portfolio... 17
4.2.3 Latent Technology Field Discovery... 18
5.2 Data Pre-Processing ... 22
5.3 Formal Relation Calculation ... 26
5.3.1 Class ↔ Patent Relation... 26
5.3.2 Patent ↔ Patent Relation ... 27
5.3.3 Company ↔ Class Relation... 27
5.3.4 Company ↔ Patent Relation ... 28
5.4 Discovery of Competitive Intelligence ... 29
5.4.1 Discovery of Competitors... 29
5.4.2 Identifying Competitor’s Patent Portfolio... 31
5.4.3 Latent Technology Field Discovery... 33
6. CONCLUSIONS AND FUTURE WORKS... 36
List of Tables
Table 3.1 Key Term Extracting Table... 8
Table 5.1 Key Term Table... 24
Table 5.2 Assignee Names Table of TSMC... 25
Table 5.3 Standard Names Table ... 25
Table 5.4 Part of Class ↔ Patent Relation Table ... 26
Table 5.5 Part of Patent ↔ Patent Relation Table... 27
Table 5.6 Part of Company ↔ Class Relation Table ... 28
Table 5.7 Part of Company ↔ Patent Relation Table... 28
Table 5.8 Competitor Discovery: Relevance Weight ... 30
Table 5.9 Patent Counts ... 30
Table 5.10 Cites per Patent ... 30
Table 5.11 Description of Groups ... 32
Table 5.12 Top 5 Classes in H Group... 32
Table 5.13 Top 4 Classes in G Group ... 32
Table 5.14 Top 2 Classes in B Gruop ... 32
Table 5.15 Description of Classes ... 33
Table 5.16 H Group... 34
Table 5.17 G Group ... 35
Table 5.18 Patent Counts of H Group... 35
List of Figures
Figure 3.1 Process of Discovering Competitive Intelligence ... 7
Figure 3.2 Patent Information Network ... 9
Figure 4.1 International Patent Classification Tree... 12
Figure 4.2 Competitor Discovery ... 16
Figure 4.3 Identifying Competitor’s Patent Portfolio ... 17
Figure 4.4 Latent Technlogy Field Discovery ... 18
Figure 4.5 Pseudo-code for the COP Calculation Algorithm ... 20
Figure 4.6 Example of Patent Informatino Network... 21
Figure 5.1 Patent Fetching (Quick Search) ... 23
Figure 5.2 Patent Fetching (Advanced Search) ... 23
Figure 5.3 PIN for Competitor Discovery ... 29
Figure 5.4 PIN for Identifying Competitor’s Portfolio Analysis ... 31
1. Introduction
Business environment today is very competitive such that enterprises need to find out their competitors’ strengths and positions in the marketing place in order to make a right decision or strategy. Besides finding out the competitors’ strengths and positions in the market, obtaining the information about their new technologies or future products is also important. Competitive intelligence can support strategic decision-making and assist executives in identifying whether the firm is competitive. Besides, decision maker can use competitive intelligence to analyze which domains of technologies are competitive.
The process of competitive intelligence is gathering internal and external information from multiple sources and analyzing the data systematically. Patent data is an important source of competitive intelligence. Patent data [15][16][17] contains technology and legal content, and can be used to analyze and extract important information about a company’s patent portfolio and technology fields. Tracking patent information can not only understand the research trends of competitors, but also can monitor if competitors involve in affairs of tort to protect a company’s intellectual property from being illegal used. Patent data reveals the know-how of technologies and helps to improve the development of new technology. By analyzing patent data, enterprises can control the progress of new technology development, understand the competitors’ technology strengths and development, and keep up with the market trend.
In this work, we employ the concept of Community of Practice (COP) to analyze competitive intelligence. We define several link relationships between patent, technology field and company in order to construct a Patent Information Network (PIN). A COP algorithm is adopted to discover competitive intelligence from the
The remainder of this work is organized as follow. Section 2 reviews related work to this research, including patent analysis, competitive intelligence and Community of Practice. Section 3 and 4 introduce our proposed methodology for discovering competitive intelligence. Section 5 describes the result of analyzing competitive intelligence by applying the proposed methodology to a set of patent data. Finally, the conclusions and future works are described in Section 6.
2. Related Works
This section reviews related work to this research, including competitive intelligence, patent analysis and Community of Practice.
2.1 Competitive Intelligence
Business management relies on timely and fact-based data in decision making and strategy development through competitive analysis, which is carried out to understand the strengths and weaknesses of competitors. Competitive intelligence reveals the information of market trend and competitors; thus plays a key role to understand the competitive arena, predict competitors’ and customers’ intentions, government action, and so forth [1].
The process of competitive-intelligence analysis includes discovering/predicting competitors’ strategic decisions and/or understanding the characteristics of the business using quantitative analysis techniques [2].
There are various data sources of competitive intelligence. The data sources used to discover competitive intelligence are usually free and public data, such as patents, business financial reports, government organs and marketing reports, and so on. Patent data, especially, is generally used in competitive intelligence discovery.
2.2 Community of Practice and Ontology-Based Network Analysis
Increasingly, organizations are harnessing communities of practice to carry out important knowledge management function. Communities of practice represent groups of individuals interested in a particular job, procedure, or work domain [3]. A
communities of practice [3]. The algorithm views instances defined in ontology as a set of nodes joined by the relationship in which they participate. Informal relations can be inferred from the presence of more formal relations to form a Community of Practice. For instance, A and B have no formal relation but they both have papers co-authored with C (formal relation), they might share similar interests (informal relation).
2.3 Patent Analysis
Patent analysis is used to evaluate and understand trends in the development of technologies, and in the competitive positioning of organizations within areas of technology [11]. Patent analysis has three main purposes:
z Assessing the technological and competitive landscape in which an organization operates.
z Changing emphasis in activities over time.
z Identifying the key technologies on which an organization’s portfolio is built.
An organization's patent portfolio forms a critical part of its IP holdings alongside its designs, trademarks, copyrights and trade secrets [11]. A well-defined and effective IP strategy critically incorporates a clear and effective strategy for managing an organization’s patent portfolio that can protect an organization’s inventions and business secrets perfectly.
Understanding the content of an organization’s portfolio can help explain the position and level of an organization’s invention and creativity in the market, and what the market opportunities are for exploiting the owned technology.
The results of patent analysis are usually presented in graph form, such as Counter Map [13], Radar Map [11], and Scatter Graph [11], etc. Counter Map
presents the investment and production of patents, and a Radar Map can be used to identify area of dominance and overlap. A scatter graph shows a number of significant inventions in an organization’s patent portfolio.
2.4 Technology Indicators
From the perspective of business world, patent data can be analyzed to derive various patent indicators for measuring a company’s R&D performance and competitiveness. In order to get reasonable results and quality of patent analysis, many researchers had brought up several patent indicators [5][6][7][8][14]. CHI Research [14] brings up a series of technology indicators in order to estimate a company’s technology development. The technology indicators that CHI Research has defined are described below:
z Patent Counts: Number of patents
z Cites per Patent (CPP): A count of the citations received by a company’s patents from front pages of subsequent patents.
z Current Impact Index (CII): The number of times the company’s patents, in a technology area, were cited, divided by the average citations received by all patent in that technology area.
z Technology Strength (TS): Numbers of Patents x Current Impact Index z Technology Cycle Time (TCT): The median age in years of the patent
references cited on the front page of the company’s patent.
z Science Linkage (SL): The average number of science papers referenced on the front page of the company’s patent.
3. Proposed Methodology
In this section, we introduce our proposed methodology to discover competitive intelligence, including data collection and information extraction, formal relation calculation, construction of patent information network, and three trend analyses in discovering competitive intelligence [9].
3.1 Overview
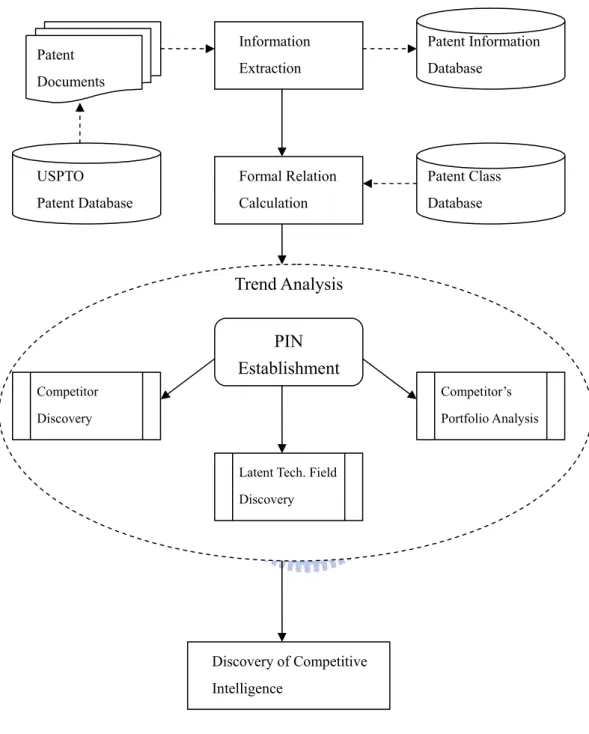
The propose methodology comprises four main processes (as shown in Figure 3.1):
1. Information Extraction: In this process, we download patent html files
from the USPTO database and extract useful information from the patent documents.
2. Formal Relation Calculation: In this process, we define and calculate
several formal relations between patent, technology class and company in order to establish a patent information network in the next process.
3. Trend Analysis: We establish a patent information network using formal
relations calculated in above process. Then we use the patent information network to analyze several trends and discover competitive intelligence.
4. Competitive Trend Analysis: In this phase, we integrate three trend
analyses in above process to identify the competitors, competitor’s patent portfolio, and potential technology field.
Figure 3.1 Process of Discovering Competitive Intelligence USPTO Patent Database Patent Documents Patent Information Database Patent Class Database Competitor Discovery Competitor’s Portfolio Analysis
Latent Tech. Field Discovery Information Extraction Formal Relation Calculation Discovery of Competitive Intelligence Trend Analysis PIN Establishment
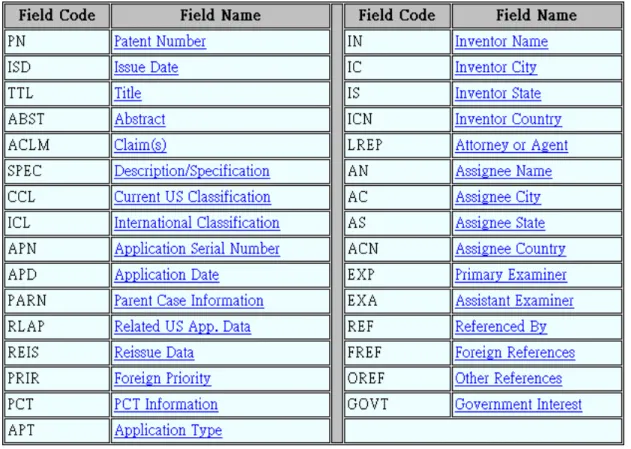
3.2 Information Extraction
In this phase, we first download patent document form USPTO patent database in html file form, then we analyze these files and remove the html tag and stop words, and extract information as shown in Table 3.1:
Table 3.1 Key Term Extracting Table
After extracting useful information from patent file, the extracted data is stored into the patent information database.
3.3 Formal Relation Calculation
In this process, we define and calculate several formal relations between patent, technology class and company in order to establish a patent information network in the next process. The details are described in Section 4.1. We extract the information
in the Information Extraction phase to calculate the link weight of a relation. To calculate patent difference for relation weight calculation, we construct the patent class database based on the technology class (IPC) of the downloaded patents.
3.4 Trend Analysis
After calculating formal relations in above phase, we establish a patent information network where companies, patents and classes are network nodes, and the formal relations are links with linkage weights between nodes (as shown in Figure 3.2). The discovery of competitive intelligence from patent information network is based on the concept of Community of Practice [3]. We establish several patent information networks with different nodes and relations in order to analyze different trends of competitive intelligence. There are three kinds of trend analysis to find out our competitors in the market place and their key technology fields.
Figure 3.2 Patent Information Network A B C : Company node : Class node : Patent node
In our study, we set weighted value to each node, and we use the strengths of formal relations as the weighted values of linkages. Then we can identify the node with the highest value, which may represent an important competitor, a key technology or a key patent. After identifying these trends, competitive intelligence discovery phase is conducted to discover competitive intelligence, including competitors, their patent portfolios and latent technologies.
3.5 Discovery of Competitive Intelligence
In this phase, we integrate three kinds of trend analyses to identify the competitors, competitor’s patent portfolio, and latent technology field. Such competitive intelligence discovery can clearly identify competitors and the technology areas that need to be focused to improve a company’s competitiveness in the market place.
In this phase we also use patent technology indicators to evaluate the results of
these analyses. We use four technology indicators to evaluate the results:
z Patent Counts: Number of patents
z Cites per Patent (CPP): A count of the citations received by a company’s patents from front pages of subsequent patents.
z Current Impact Index (CII): The number of times the company’s patents, in a technology area, were cited, divided by the average citations received by all patent in that technology area.
4. Discovering Competitive Intelligence
In this section, we introduce the concept of patent information network and the algorithm to discover competitive intelligence from PIN based on the concept of Community of Practice.
Community of Practice is a group of individual interested in a particular job, procedure or work domain [3]. This concept can be applied in the patent information network to find out competitors with related technology development through the analysis of patent data. Competitive intelligence including potential technology field and related patents can be discovered by analyzing the patent information network. Furthermore, the trends of technology development and patent portfolios of competitors can be identified.
We adopt the graph-based network analysis algorithm [4], which is developed to identify Community of Practice, to discover competitors, related technology fields and patent portfolio from the patent information network. Because our network is used to identify competitors and patent portfolio and technology, we refer to our network as a patent information network.
4.1 Patent Information Network
The network consists of a set of nodes joined by the relationship in which they participate. There exists a formal relation between two nodes just as each individual in a Community of Practice has a relation with another node. We associate a real numbered weight X(i) for each node in the network. And we associate a weight R(ij) for every network linkage representing the strengths of the relationship from node i to node j owing to a particular relation R that the linkage represents. In this study, we
z Company: including the target company and other competitors z Patent: all patents are represented by its patent numbers
z Class: a class number of a specific kind of patent class based on international patent classification (IPC) code.
Different types of relations are defined to record the relationships between nodes. Each relation connecting two nodes is associated with a relation weight representing the strength of the relationship between the two nodes. The relation weight is calculated according to the defined relation formulas.
4.1.1 Class ↔ Patent Relation
Each patent has an IPC (international patent classification) number defined by WIPO (World Intellectual Property Organization). The Class ↔ Patent relation represents the relationship of similarity between patent class and patent itself. We can treat IPC as a tree, as shown in Figure 4.1.
Figure 4.1 International Patent Classification Tree
As shown in Figure 4.1, class A is the top class and A01, A21, A22, A23…etc. are sub-classes (second layer) included in class A. And there are other sub-classes (third layer) included in upper classes. Each patent has an IPC number that belonged
A
A01 A21 A22 A23 A24
to a specific class.
In the patent information network, a “Class” node presents a specific IPC class or technology field that we focus on. For instance, class node “A01B” means a technology field of “SOIL WORKING IN AGRICULTURE OR FORESTRY; PARTS, DETAILS, OR ACCESSORIES OF AGRICULTURAL MACHINES OR IMPLEMENTS, IN GENERAL”. Each class node has a relation with every patent node. This relationship denotes the similarity between a class node and a patent node that the closer two IPC numbers are, the more similar they are, otherwise they are more different. The formula of calculating Class ↔ Patent relation weight is shown below [10]: ) , ( , 1 ) , ( ( , )
∑
∑
∑
∑
∑
∈ ∈ ∈ ∈ ∈ − ⎟ ⎟ ⎠ ⎞ ⎜ ⎜ ⎝ ⎛ − = A i j B comm k B j A i P L L P j i B A P L k P L j P L i WL WL Max WL WL WL Max patent class RPA: The path from the root to node A
PB: The path from the root to node B
Pcomm (A, B): The common path between PA and PB
WLi: The weight on the level of link i
WLj: The weight on the level of link j
4.1.2 Patent ↔ Patent Relation
The relationship between two patents can be considered from three parts of patent relations. The first relation is patent citation relation. If a patent cited or was cited by another patent, the relation between these two patents is high. The second relation is patent co-inventor relation. Two different patents may have the same
in these two patents. The calculation of Patent ↔ Patent relation weight is shown as below formula: ⎪ ⎩ ⎪ ⎨ ⎧ = = − = = = × + × + × = similarity hierarchy class patent PS otherwise Yes inventor co if CA otherwise Yes citation if C PS CA C patent patent R 1 , 0 0 , , 1 ; ) , ( α β γ
α, β, γ are defined by experts. The default values: α=0.5, β=0.2, γ=0.3
] 10 [ ) , ( , 1 ( , )
∑
∑
∑
∑
∑
∈ ∈ ∈ ∈ ∈ − ⎟ ⎟ ⎠ ⎞ ⎜ ⎜ ⎝ ⎛ − = A i j B comm k B j A i P L L P j i B A P L k P L j P L i WL WL Max WL WL WL Max PSPA: The path from the root to node A
PB: The path from the root to node B
Pcomm (A, B): The common path between PA and PB
WLi: The weight on the level of link i
WLj is the weight on the level of link j
4.1.3 Company ↔ Class Relation
Company ↔ Class relation represents the importance and maturity of a company’s technology in a specific technology field. We calculate the relation weight based on the number of citations of the company’s patents in that class relative to the total number of citations in that class. For instance, company A has 10 patents in the class A01B, the summation of the cited number of A’s patent in class A01B is divided by the total number of citations of all patents in class A01B to derive the Company ↔ Class relation weight. A higher value of the Company ↔ Class relation weight means that the company plays a more significant role to this technology class. The formula of calculating the Company ↔ Class relation weight is shown below:
∑ ∑ = = = m j j n i i CC PC class company R 1 1 ) , (
where PCi is the number of citations of the company’s patent i in that class; CCj
is the number of citations of a patent j in that class; n is the number of the company’s patents in that class; and m is the number of patents in that class.
4.1.4 Company ↔ Patent Relation
The relation between a company and a patent is obtained from whether this patent belongs to the company. Here, we simply use a binary value to set Company ↔ Patent relation weight: if patent X belongs to Company A, then we set their Company ↔ Patent relation weight as 1, otherwise 0. The formula of calculating the Company ↔ Patent relation weight is shown below:
⎪⎩ ⎪ ⎨ ⎧ = company the to belong not does patent if company the to belongs patent if patent company R , 0 , 1 ) , (
4.2 Identifying Competitive Intelligence
The purpose of our study is to discover the competitive intelligence to provide more useful information for a company to identify its strength and weakness. According to the patent information network, we can infer informal relations such as competitors and related technology fields/patents that define a Community of Practice from formal relations. These informal relations are competitive intelligence extracted from the PIN and are helpful for decision making and strategy development process. In this section, we define different types of competitive intelligence that
4.2.1 Competitor Discovery
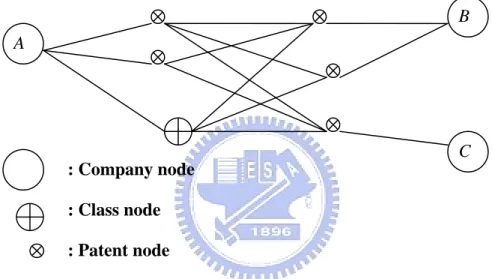
In the patent information network, there may be several formal or informal relations between one company node and another node. Here we define the informal relation between two companies as that these two companies may have similar patent interest or R&D activity in a specific technology field. In another words, one company may be a potential competitor to another. As shown in Figure 4.2, there is no direct relation between company A and company B, but there may be an informal relation between them by linking to other nodes through patent relations.
Figure 4.2 Competitor Discovery
Figure 4.2 shows that there may be many different linkages and nodes between company A, B and C. The nodes between company A, B and C may be class nodes or patent nodes, and there are several formal relations between them. In this network, we set company A as a starting node, and we expand the network by traveling the other nodes, calculating their formal relation weights and accumulating the weights until we reach the competitor. The company (node) with highest weight implies that it is much more competitive than other companies and is the potential competitor of company A. The algorithm of accumulating relation weights will be described in Section 4.3. In the discovery of competitors, we use the formal relations below to derive the weight of a competitor (company node).
A B C : Company node : Class node : Patent node
z Patent ↔ Patent Relation z Company ↔ Patent Relation z Patent ↔ Class Relation z Company ↔ Class Relation
4.2.2 Identifying Competitor’s Patent Portfolio
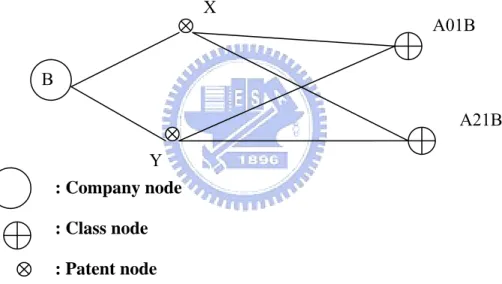
After discovering the competitors, analysis of competitors’ patent data is conducted to understand what technology fields the competitors focus on. We can also use patent information network to find out competitors’ technology development progress, or their patent portfolios, as shown in Figure 4.3.
Figure 4.3 Identifying Competitor’s Patent Portfolio
As Figure 4.3 shows, company B is one of our competitors, and class node A01B and A21B are the main technology field that the company B focuses on. Although company B does not have any direct linkage with class A01B and A21B, we can still find out their informal relations by calculating and accumulating their relation weights
B : Company node : Class node : Patent node X Y A01B A21B
z Company ↔ Patent Relation z Patent ↔ Class Relation
4.2.3 Latent Technology Field Discovery
Gap analysis is a critical part for strategy development of business intellectual property [12]. A company can be aware of what else it needs to get an edge over its competitors by discovering the latent technology fields of competitors. Accordingly, we focus on the discovery of latent technology fields. Figure 4.4 shows the discovery of latent technology fields of competitors using the patent information network.
Figure 4.4 Latent Technology Field Discovery
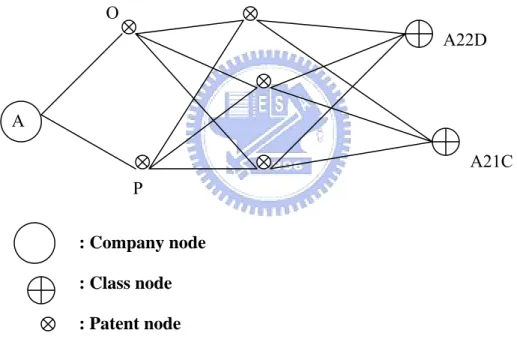
In Figure 4.4, we travel the nodes in the network form company A, and its two patent nodes O and P. We calculate each formal relation weight and accumulate them by traversing the network. Finally, we can find a class node A22D with higher weight, and the class node has informal relation with company A. If A22D does not have a direct formal relation with company A, it may be a latent technology filed that company A is exploring. Such technology class will be a latent technology field that
A : Company node : Class node : Patent node O P A22D A21C
needs to study and evaluate. In latent technology field discovery, we use the following formal relations to calculate and accumulate relation weights.
z Patent ↔ Patent Relation z Patent ↔ Class Relation z Company ↔ Patent Relation
4.3 Algorithm for Identifying Competitive Intelligence
We adopt the graph-based network analysis (COP) algorithm [3] to identify competitive intelligence (e.g. competitors or potential technology field) from the paten information network. The algorithm identifies a set of close instances which are ranked by the weights they accumulate from path traversals [4]. In this work, the nodes are company, patent or class nodes. The algorithm applies a breadth-first search with activation spreading manner to traverse the formal (semantic) relations between nodes (ignoring directionality) until it reaches a link threshold. Figure 4.5 shows the pseudo-code of the algorithm:
Figure 4.5 Pseudo-code for the COP Calculation Algorithm
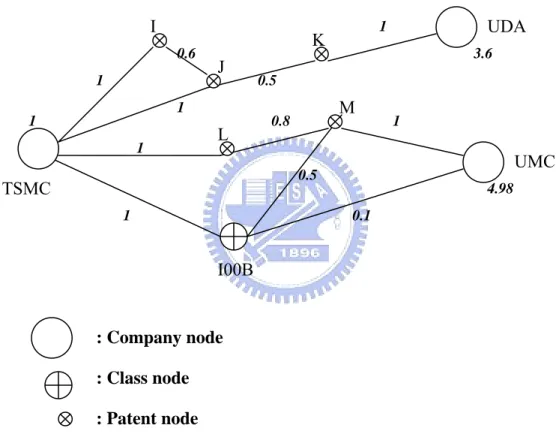
Consider an example network in Figure 4.6. Assume we want to identify company TSMC’s competitors by traversing the patent information network, using the formal relations Patent ↔ Patent and Company ↔ Patent. All instances have an initial weight 1. The calculation of formal relation weight for each linkage has been done. Activation spreads form the query node to neighboring nodes in the network. In the first expansion, node TSMC passes on weight to all of its connected nodes. The amount of weight passed equals the node’s weight multiplied by the traversed formal relation weight. In this case, TSMC pass 1 * 1 to patent node I and 1 * 1 to patent node J. We add these values to their initial weights of 1. In return, these nodes pass
Initialize all instances weights to 1
Create arrays of selected relationships and weights Set starting node as the current node
Add starting node on a node array
Loop to the maximum number of links to traverse Search for the current node in node array If found:
Mark node as locked
Get all node connected to current node with a relation weight in the relation weight array
Loop to number of connected nodes If node not in node array (new node)
Weight of node=initial weight + current node weight * weight of connecting relation Mark node as unlocked and add it to node array If node already in node array
Weight of node=node weight + current node weight * weight of connecting relation End loop
If not found then exit End loop
their total weights to all their neighboring nodes. So patent node I, for instance, passes (1+1 * 1) * 1 to TSMC and (1+1 * 1) * 0.6 to patent node J. Expansion stops when the link paths are exhausted. In this algorithm, we lock and unlock the nodes in order to prevent feedback loops from recursive traversal until the link paths are exhausted. By accumulating the formal relation weights, the network is expanded from TSMC until finding other company node. In this network, we finally found the company UDA with an accumulated weight 3.6 and UMC (weight 4.98).
Figure 4.6 Example of Patent Information Network
I00B I J K L M TSMC UMC UDA 1 1 0.6 0.5 1 1 1 1 0.1 0.8 0.5 3.6 4.98 : Company node : Class node : Patent node 1
5. Application and Analysis
This section describes the experiment of applying of proposed methodology to discover competitive intelligence from a patent data set. The following subsections describe the data source, data pre-processing, formal relation calculation and discovery of competitive intelligence.
5.1 Data Source
The data set contains patent data of semiconductor industry in Taiwan. We use Taiwan Semiconductor Manufacturing Co. Ltd (TSMC) as our target company, and other four companies as competitors (United Microelectronics Corp., Winbond Electronic Corp., Mosel Vitelic Inc. and Siliconware Precision Industries Co., Ltd.). The patent files are downloaded from United States Patent and Trademark Office (USPTO) database, and we classify the downloaded patents using the international patent classification (IPC).
5.2 Data Pre-Processing
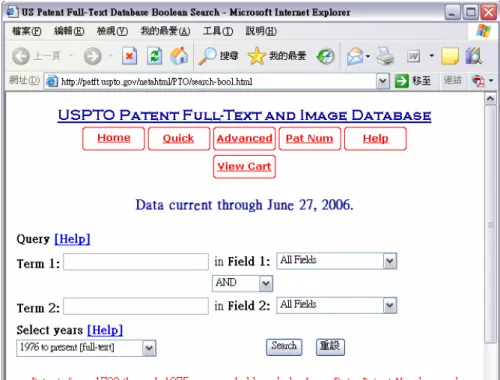
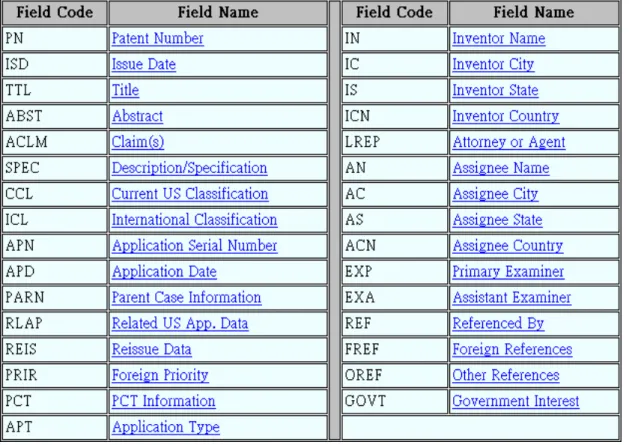
We design a patent downloading program based on the search engine of USPTO database to search the target companies’ patent and download the patent documents. Patent Fetching is divided into two modes: Quick Search and Advanced Search, as shown in Figure 5.1 and 5.2. The Program first transfers the keywords to USPTO database, analyzes the returning results, and then downloads the html files of patent documents for further analyzing and processing.
After downloading the patent documents form USPTO database, next step is to
translate the html files into database form and extract useful information from patents. We analyze patent files and remove the html tag and stop words, and then we extract several key terms as shown in Table 5.1. The extracted data are stored in a patent information database.
Table 5.1 Key Term Table
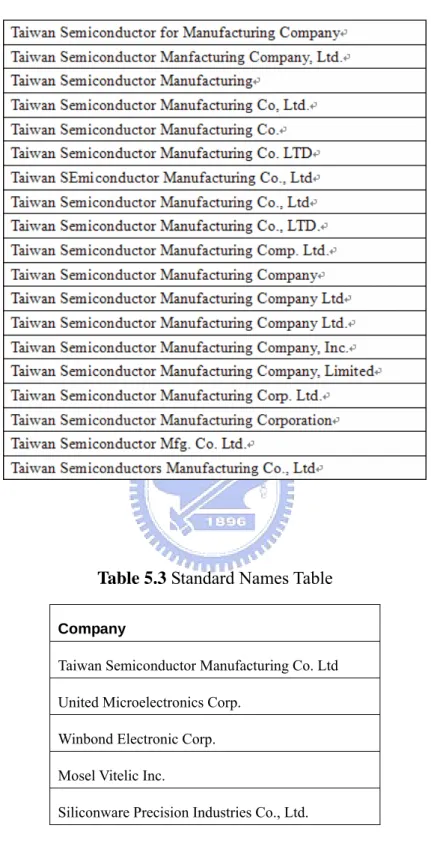
Data consistency is an important process to patent analysis. Term inconsistency often appears in patent documents. There are usually several inconsistent names in “Assignee” field because of the mistake of factitious data import or the abbreviation of company name. TSMC, for instance, has more than 20 assignee names, as shown in Table 5.2. After the processing for data consistency, the standard name of TSMC and its competitors is shown in Table 5.3. By these data, we can use our processed information for constructing the patent information network.
Table 5.2 Assignee Names Table of TSMC
Table 5.3 Standard Names Table
Company
Taiwan Semiconductor Manufacturing Co. Ltd United Microelectronics Corp.
Winbond Electronic Corp. Mosel Vitelic Inc.
5.3 Formal Relation Calculation
In this section, we calculate the formal relation weights mentioned in Section 4.2, using the data extracted in Section 5.2.2. Each relation is described in the following sub-sections.
5.3.1 Class ↔ Patent Relation
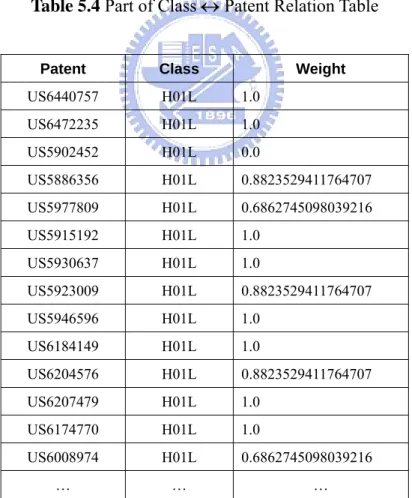
The Class ↔ Patent relation represents the relationship of similarity between patent class and patent itself. The calculation of Class ↔ Patent relation weight is based on the formula mentioned in Section 4.1.1. Part of data table of Class ↔ Patent relation is shown in Table 5.4.
Table 5.4 Part of Class ↔ Patent Relation Table
Patent Class Weight
US6440757 H01L 1.0 US6472235 H01L 1.0 US5902452 H01L 0.0 US5886356 H01L 0.8823529411764707 US5977809 H01L 0.6862745098039216 US5915192 H01L 1.0 US5930637 H01L 1.0 US5923009 H01L 0.8823529411764707 US5946596 H01L 1.0 US6184149 H01L 1.0 US6204576 H01L 0.8823529411764707 US6207479 H01L 1.0 US6174770 H01L 1.0 US6008974 H01L 0.6862745098039216 … … …
5.3.2 Patent ↔ Patent Relation
The most important relation between patents is citation or reference. Furthermore, two different patents may have the same inventor, or co-inventor, which represents similarity or cross-influence of the two patents. The calculation of Patent ↔ Patent relation weight is based on the formula mentioned in Section 4.1.2. Part of data table of Patent ↔ Patent relation is shown in Table 5.5.
Table 5.5 Part of Patent ↔ Patent Relation Table
Patent1 Patent2 Weight
US6495422 US6649535 0.5 US6495422 US6329234 0.3 US6495422 US5874843 0.2 US6495422 US5920499 0.0 US6495422 US5514617 0.3 US6664028 US6348301 0.264 US6664028 US6177874 0.2 US6664028 US6277717 0.0 US5851885 US5920499 0.0 US5851885 US5920779 0.3 US5851885 US6080991 0.264 US5851885 US6239733 0.2 US6169029 US6320230 0.3 US6169029 US6344995 0 US6169029 US5003062 0.3 … … …
5.3.3 Company ↔ Class Relation
Company ↔ Class relation represents the importance and maturity of a company’s technology in a specific technology field. The calculation of Class ↔ Patent relation weight is based on the formula mentioned in Section 4.1.3. The data
Table 5.6 Company ↔ Class Relation Table
Company Class Weight
Taiwan Semiconductor Manufacturing Co. Ltd H01L 0.245 United Microelectronics Corp. H01L 0.148
Winbond Electronic Corp. H01L 0.023
Mosel Vitelic Inc. H01L 0.012
Siliconware Precision Industries Co., Ltd. H01L 0.01
5.3.4 Company ↔ Patent Relation
The direct relation between a company and a patent denotes whether this patent belongs to the company. The calculation of Company ↔ Patent relation weight is based on the formula mentioned in Section 4.1.4. Part of data table of Company ↔ Patent relation is shown in Table 5.7.
Table 5.7 Part of Company ↔ Patent Relation Table
Patent Company Weight
US6407368 Taiwan Semiconductor Manufacturing Co. Ltd 1 US6561877 Taiwan Semiconductor Manufacturing Co. Ltd 1 US6620702 Taiwan Semiconductor Manufacturing Co. Ltd 1 US6720132 Taiwan Semiconductor Manufacturing Co. Ltd 1 US6742532 Taiwan Semiconductor Manufacturing Co. Ltd 1 US6780788 Taiwan Semiconductor Manufacturing Co. Ltd 1 US6800496 Taiwan Semiconductor Manufacturing Co. Ltd 1 US6281069 United Microelectronics Corp. 1 US6312855 United Microelectronics Corp. 1 US6303484 United Microelectronics Corp. 1 US6376882 United Microelectronics Corp. 1 US6368941 United Microelectronics Corp. 1 US6355105 United Microelectronics Corp. 1 US6159798 Winbond Electronic Corp. 1 US6346725 Winbond Electronic Corp. 1
5.4 Discovery of Competitive Intelligence
5.4.1 Discovery of Competitors
We use TSMC as the target company to discover competitors from the patent information network. We set Class H01L as the target technology area because its patent count is the highest. The H01L class presents a class of “SEMICONDUCTOR DEVICES; ELECTRIC SOLID STATE DEVICES NOT OTHERWISE PROVIDED FOR”. The patent information network for Competitor Discovery is shown in Figure 5.3.
Figure 5.3 PIN for Competitor Discovery
... ... TSMC UMC Other Patents TSMC Patents Class H01L Mosel Siliconware Windband
Table 5.8 Competitor Discovery: Relevance Weight
Company Weight
1 United Microelectronics Corp. 4203295.24 2 Winbond Electronic Corp. 594613.78
3 Mosel Vitelic Inc. 481972.41
4 Siliconware Precision Industries Co., Ltd. 281930.98
Table 5.9 Patent Counts
Company Patent Count
1 United Microelectronics Corp. 2551
2 Winbond Electronic Corp. 337
3 Mosel Vitelic Inc. 267
4 Siliconware Precision Industries Co., Ltd. 152
Table 5.10 Cites per Patent
Company Cites per patent
1 United Microelectronics Corp. 3.256
2 Winbond Electronic Corp. 2.831
3 Mosel Vitelic Inc. 2.614
4 Siliconware Precision Industries Co., Ltd. 2.579
Table 5.8 shows that the weight value of UMC is the highest, and weight value of Silicomware is the lowest. Comparing the result with these four companies’ patent counts and cites per patents listed in Table 5.9 and 5.10, UMC also has the highest patent counts and cites per patent. Thus, UMC is the most competitive competitor among other companies, and is worth further analysis.
5.4.2 Identifying Competitor’s Patent Portfolio
Patent portfolio of UMC can be derived by using the patent information network. We divide the patent classes into three groups (H group, G group and B group, as shown in Table 5.11) according to the IPC. The patent information network for Identifying Competitor’s Patent Portfolio is shown in Figure 5.4
The patent portfolios, including CII (current impact index), TS (technology strength) and patent count, are listed in Table 5.12, 5.13 and 5.14, for each group of technology area. In H group, H01L has the highest weight value, which means H01L is the most important technology area in the H group of UMC’s patent portfolio. Similarly, G03F is the most important class in G group and B24B is the most important class in B group because they have the highest weight value in their groups. Comparing the result with the patent counts, CII and TS for each class in each group, H01L, G03F and B24B have the highest weight value as well as the patent counts, CII and TS values in their groups. They are important technology classes for their groups in UMC’s patent portfolio. The description of each class is listed in Table 5.15
UMC ... ...
...
...
Table 5.11 Description of Groups
Group Description
H Group ELECTRICITY G Group PHYSICS
B Group PERFORMING OPERATIONS; TRANSPORTING
Table 5.12 Top 5 Classes in H Group
Class Weight CII TS Patent Count
1 H01L 4056.2 0.1482 284.544 1920
2 H03K 2808.2 0.1046 3.138 30
3 H02H 2799.24 0.1012 1.6192 16
4 H03M 2796.04 0.0963 1.0593 11
5 H04L 2794.12 0.0951 0.7608 8
Table 5.13 Top 4 Classes in G Group
Class Weight CII TS Patent Count
1 G03F 490.84 0.0732 5.7828 79
2 G11C 482.52 0.0702 4.6332 66
3 G06F 479.32 0.0701 4.2761 61
4 G01R 458.84 0.0503 1.4587 29
Table 5.14 Top2 Classes in B Group
Class Weight CII TS Patent Count
1 B24B 163.82 0.0232 0.6264 27
Table 5.15 Description of Classes Class Description
H01L ELECTRIC SWITCHES; RELAYS; SELECTORS; EMERGENCY PROTECTIVE DEVICES
H03K PULSE TECHNIQUE
H02H EMERGENCY PROTECTIVE CIRCUIT ARRANGEMENTS H03M CODING, DECODING OR CODE CONVERSION, IN GENERAL
H04L TRANSMISSION OF DIGITAL INFORMATION, e.g. TELEGRAPHIC COMMUNICATION
G03F PHOTOMECHANICAL PRODUCTION OF TEXTURED OR PATTERNED SURFACES, e.g. FOR PRINTING, FOR PROCESSING OF SEMICONDUCTOR DEVICES; MATERIALS THEREFOR; ORIGINALS THEREFOR; APPARATUS SPECIALLY ADAPTED THEREFOR
G11C STATIC STORES
G06F ELECTRIC DIGITAL DATA PROCESSING
G01R MEASURING ELECTRIC VARIABLES; MEASURING MAGNETIC VARIABLES B24B MACHINES, DEVICES, OR PROCESSES FOR GRINDING OR POLISHING,
DRESSING OR CONDITIONING OF ABRADING SURFACES; FEEDING OF GRINDING, POLISHING, OR LAPPING AGENTS
B08B CLEANING IN GENERAL; PREVENTION OF FOULING IN GENERAL
5.4.3 Latent Technology Field Discovery
After finding the target company’s competitor and competitor’s portfolio, another important issue is to locate the technology field of competitors that is a latent or important field to the target company. In this analysis, we divide the technology classes into two groups: H group and G group. The patent information network for latent technology field discovery is shown in Figure 5.5.
of TSMC and UMC of these two groups, as listed in Table 5.18 and 5.19.
As shown in Table 5.18 and 5.19, TSMC has relative low patent counts and patent counts percentage for class H03K, H03M and H04L in H group, and it has lower patent counts and patent counts percentage for class G11C in G group. Thus, H03K, H03M and H04L may be latent technology fields for TSMC in H group. TSMC may need to pay attention to these classes to improve their patent portfolio. G11C in G group may also be an important class which should pay attention to.
Figure 5.5 PIN for Latent Technology Field Discovery
Table 5.16 H Group
Class Patent Count Weight
1 H01L 1920 2565516.714 2 H03K 30 1656722.896 3 H02H 16 1436166.422 4 H03M 11 1432108.251 5 H04L 8 1429798.496 ... ... TSMC ... ... ... ...
...
...
TSMC Classes UMC Patents
Table 5.17 G Group
Class Patent Count Weight
1 G06F 61 30908.9
2 G03F 79 30749.75
3 G11C 66 29786.6
4 G01R 29 25785.241
Table 5.18 Patent Counts and Patent Table 5.19 Patent Counts and Patent
Counts Percentage of H Group Counts Percentage of G Group
Class TSMC UMC H01L 67.25% (2058) 75.26% (1920) H03K 0.49% (15) 1.18% (30) H02H 0.75% (23) 0.63% (16) H03M 0.03% (1) 0.43% (11) H04L 0.03% (1) 0.31% (8) Class TSMC UMC G06F 2.68% (82) 2.391% (61) G03F 3.99% (122) 3.10% (79) G11C 1.80% (55) 2.59% (66) G01R 1.27% (39) 1.137% (29)
6. Conclusions and Future Works
Discovering competitive intelligence is important for business to stand at an advantageous position. In this work, we propose a methodology to discover competitive intelligence from the patent information network based on the concept of Community of Practice. We extract information form patents and identify several patent/class/company relations to construct the patent information network. A graph-based network analysis algorithm is then adopted to discover competitive intelligence from the patent information network. Competitive intelligence including competitors, patent portfolios and latent technology fields are identified to support enterprises’ decision making and strategy development.
Future work can be addressed in the following. First, change mining techniques can be integrated to analyze the trends of patent change from the patent information network. Second, the network analysis algorithm can be further improved by considering multi-level analysis to discover competitive intelligence. Third, the similarity between patents can be derived based on the key terms extracted from the content of patents. Fourth, current work only uses the patent data of Taiwan’s companies to identify competitive intelligence. Future work should use worldwide patent data to discover global competitive intelligence. Finally, the graph-based algorithm for identifying competitive intelligence can be further improved to reduce the computation time in order to deal with huge amount of patent data.
7. References
[1] Helen N. Rothberg and G. Scott Erickson, From Knowledge to Intelligence: Creating Competitive Advantage in the Next Economy, Elsevier Butterworth-Heinemann, Jordan Hill, 2004.
[2] A. Zanasi, “Competitive Intelligence through Data Mining Public Sources,” Competitive Intelligence Review, vol.9, no.1, pp.44-54, 1998.
[3] H. Alani, S. Dasmahapatra, K. O’Hara, and N. Shadbolt, “Identifying
Communities of Practice through Ontology Network Analysis,” IEEE Intelligent System 18(2), pp. 18-25 , 2003.
[4] K. O’Hara, H. Alani, and N. Shadbolt, “Identifying Communities of Practice:
Analysing Ontologies as Networks to Support Community Recognition,” Proc. Conf. Int’l Federation Information Processing, World Computer Congress (WCC2002), Kluwer Academic Publishers, 2002.
[5] T. H. Hall, A. B. Jaffe, M. Trajtenberg, “The NBER Patent Citation Data File:
Lessons, Insights and Methodological,” National Bureau of Economic Research, NBER Working Papers, 2001.
[6] B. W. Kjersten, S. D. Laurel. “Quality versus Quantity: Women's Patenting in the
Life Sciences,” Conference of the Science and Engineering Workforce Project (SEWP) at the National Bureau of Economic Research (NBER), 2005
[7] M. Karki, “Patent Citation Analysis: A Policy Analysis Tool,” World Patent Information 19, pp. 269-272, 1997.
[8] J. Lerner, J. Tirole, M. Strojwas, “Coopoerative Marketing Agreements between
Competitors: Evidence from Patent Pools,” NBER Working Papers, 2003.
[9] D. R. Liu, M. J. Shih, H. C. Chen, “Discovering Competitive Intelligence from
Evaluating Portfolios”, Thomson Scientific, June 2005, at URL:
http://scientific.thomson.com/news/newsletter/2005-06/8279628/
[12] B. Stembridge, B. Corish, “Patent data mining and Effective Patent Portfolio
Management”, Intellectual Asset Management, October/November 2004, at URL:
http://scientific.thomson.com/news/newsletter/2004-11/8254450/ [13] MicroPatent, http://www.aurigin.com/static/advanced.htm [14] CHI-Research, http://www.chiresearch.com [15] 李文傑,2004,利用專利分析評估半導體企業的技術定位與發展-以快閃記 憶體MLC技術為例,交通大學科管所 [16] 林伯恒,2002,專利分析對研發策略規劃之探討以覆晶技術為例,交通大學 科管所 [17] 陳省三,2004,專利檢索與情報分析/智慧財產與智慧資本經營管理課程講 義,交通大學科法所