行政院國家科學委員會專題研究計畫 成果報告
滲流狀況對於廢棄物掩埋場穩定性之影響
研究成果報告(精簡版)
計 畫 類 別 : 個別型
計 畫 編 號 : NSC 97-2221-E-009-125-
執 行 期 間 : 97 年 08 月 01 日至 98 年 07 月 31 日
執 行 單 位 : 國立交通大學土木工程學系(所)
計 畫 主 持 人 : 單信瑜
計畫參與人員: 碩士班研究生-兼任助理人員:盧彥森
碩士班研究生-兼任助理人員:游君暉
報 告 附 件 : 出席國際會議研究心得報告及發表論文
處 理 方 式 : 本計畫可公開查詢
中 華 民 國 98 年 10 月 13 日
行政院國家科學委員會補助專題研究計畫
■ 成 果 報 告
□期中進度報告
滲流狀況對於廢棄物掩埋場穩定性之影響
計畫類別:■ 個別型計畫 □ 整合型計畫
計畫編號:NSC 97-2221-E -009 -125 -
執行期間: 97 年 8 月 1 日至 98 年 7 月 31 日
計畫主持人:單信瑜
共同主持人:
計畫參與人員:盧彥森、游君暉
成果報告類型(依經費核定清單規定繳交):■精簡報告 □完整報告
本成果報告包括以下應繳交之附件:
□赴國外出差或研習心得報告一份
□赴大陸地區出差或研習心得報告一份
■出席國際學術會議心得報告及發表之論文各一份
□國際合作研究計畫國外研究報告書一份
處理方式:除產學合作研究計畫、提升產業技術及人才培育研究計畫、
列管計畫及下列情形者外,得立即公開查詢
□涉及專利或其他智慧財產權,□一年□二年後可公開查詢
執行單位:交通大學土木工程系
中 華 民 國 98 年 10 月 20 日
摘要
台灣大部份的掩埋場位於山谷與坡腳處,降雨強度大,而在掩埋場的設計與施工上並無明
確的法規及規範,導致掩埋場具有滲出水與邊坡穩定的問題,部份掩埋場因營運維護不當,
造成滲出水淤積問題,並且具有邊坡穩定之危險性。本研究針對八里掩埋場與頭份掩埋場
此兩座設立於山谷中的掩埋場,使用 HELP 軟體做滲出水行為模擬,並以 SLOPE/W 軟體
對計算由 HELP 所得之滲出水水頭高狀況做邊坡穩定分析。滲出水行為之研究中,蒸散層
深度影響滲出水量最巨,其次為集排水層坡度;掩埋層中滲出水水頭高受集排水層的透水
係數影響,且當滲出水透水係數達 10
-3cm/s 以上時,滲出水水頭高將明顯增高;廢棄物層
的透水係數則會影響滲出水延遲排放的時間,廢棄物透水係數越低,其延遲排放時間將會
加長。邊坡穩定之計算中,掩埋場的安全係數隨著滲出水水頭高的增加與掩埋面的增高而
減低,並因集排水層的剪力強度減弱而降低。
關鍵字:掩埋場、滲出水、邊坡穩定、水文平衡、HELP
Abstract
Most landfills in Taiwan locate in the valley or mountain area due to the shortage of available
land. With poor design and operation regulations, and improper maintenance, the clogging of
leachate collection system is quite common and thus might cause the instability of landfill slopes.
The objective of this study is to perform water balance analysis to assess leachate generation and
accumulation by HELP (Hydrologic Evaluation of Landfill Performance) and further evaluate
slope stability by SLOPE/W. For two true landfill cases, Bali landfill and Toufen landfill , the
results of simulation by HELP shows that the increase of evaporative zone depth will cause the
decrease of leachate accumulation, while the leachate head will rise due to the decrease of
leachate permeability. In addition, the permeability of the waste layer will increase the time delay
of leachate collection. The results of slope stability analysis indicate that the factor of safety will
decrease when the cover waste and leachate head increaes. The decrease of shear strength of
leachate collection system will also reduce the factor of safety to be about 50% for elevation of
waste material up to date and 60% after the construction of the designed final cover.
第1章 研究背景
台灣地狹人稠,在土地取得不易的情況下,大部份的掩埋場設置在山區或偏遠地區,
易造成邊坡穩定之問題。在 Qian 與 Koerner 所收集的掩埋場破壞案例[1, 2]中,大部份的掩
埋場邊坡問題發生在營運中的掩埋場,其中具有集排水層與 HDPE 不透水布阻水層的掩埋
場皆發生滑移破壞。在 Mitchell 與 Seed 針對 Kettleman Hills Waste Landfill 破壞案例[3, 4]
的研究中指出,掩埋場集排水層系統中各地工合成材料間的摩擦角較低,由其以 HDPE 不
透水布/地工織布、HDPE 不透水布/地工格網、HDPE 不透水布/飽和夯實黏土等三種狀況最
顯著,其內摩擦角甚至只有 8∘。
掩埋場中,造成滲出水水頭高增加的主因為集排水層排水速度不足,當有過量的降雨
產生時,大量滲出水因不及排出而在掩埋場內部造成滲出水的淤高。在 Rowe 與 Koerner
等人的研究[5, 6]與 Fleming 的現地勘查[7]與實驗[8]中,指出在集排水層系統中,其包覆集
排水層的地工織布容易因為碎屑、滲出液中的化學作用、生物薄膜等原因,造成地工織布
的阻塞,導致透水係數的降低。根據衛生署的統計[9],台灣的掩埋場具有滲出水處理設備
未操作或操作不當的問題,因此當集排水層系統無法順利排除滲出水時,將導致邊坡穩定
問題,造成安全上的顧慮。
本研究目的為利用數值模式模擬掩埋場內在不同狀況下的滲出水水位分佈狀況,並據
以進行邊坡穩定之分析,以評估掩埋場在滲出水集排水系統運作不良時的風險以及改善之
必要性。另一方面,本研究亦評估山坡地掩埋場在掩埋場下之地下水位升高時對於掩埋場
穩定性之影響。
第2章 研究方法
2.1 研究規劃
本研究藉由輸入真實氣象資料與實際掩埋場設計狀況,以及掩埋場現場滲出水資料作
水文平衡分析與邊坡穩定分析。在水文平衡分析中,將針對蒸散層深度、集排水層坡度、
集排水層透水係數、廢棄物層透水係數,探討在各種不同的條件下,掩埋場中滲出水排放
的情況與行為。在經由水文平衡分析後得到滲出水水頭高後,針對不同的水頭高做掩埋場
邊坡穩定之計算。
2.2 分析方法
2.2.1 水文平衡分析
本研究利用 HELP[10]分析掩埋場的滲出水行為。HELP 是一維(亦稱之為類二維)水文
平衡分析軟體,主要做掩埋場設計的水文狀況分析。在氣象資料的給定與掩埋場設計值的
輸入後,可輸出逕流量、掩埋場滲出水、滲出水水頭高與滲漏量,作為掩埋場設計規劃的
依據。掩埋場形狀因子中,可以輸入掩埋場面積、植被狀況、表層坡長坡度、底層坡長坡
度、集排水層排水長度與坡度等。掩埋場的材料參數中分為縱向排水層、側向排水層、阻
水土壤層、不透水布層、地工織布與地工網層五種,其中在縱向排水層、側向排水層與阻
水土壤層和地工織布與地工網層中,可以輸入孔隙率、田間含水量、凋萎點、飽和透水係
數、地下入流與初始含水量;在不透水布層中,主要可輸入飽和透水係數、針孔洞密度、
安裝缺失、安裝品質與地工織布的透水率。HELP 在計算上主要結合各專家學者所提出的
公式[11],成為一整合性的計算。
2.2.1.1 固定參數
為求得最適當之參數,在水文平衡分析中,有以下之參數為固定值:
1. 逕流面積百分比:一般掩埋場的設計為碗型,絕大部份的降雨應該在落入掩埋場之後直
接成為滲出水流出,或是在掩埋場中蒸散,因此本研究中將逕流面積假設為 0%,將無
逕流發生。
2. 植被情況:植被情況在 HELP 程式中所代表蒸散情況與逕流狀況,本研究中將植被情況
設為裸露土壤,減少因為植物所造成的蒸散作用。
2.2.1.2 探討參數
表 2-1 為各探討變因的範圍與編號方式。台灣掩埋場的集排水層設計上,是以管中流
速為 1m/s 的 HDPE 管做為集排水層中的滲出水收集管,因此無所謂集排水層的存在,因此
集排水層的透水係數是以 HDPE 管的管中流速與場中廢棄物層的透水係數做修正,其修正
式為:
其中 K
pipe是 HDPE 管的透水係數,K
waste為廢棄物的透水係數,A
pipe為 HDPE 管的面積,
A
total為掩埋場滲出水流出面的面積;廢棄物的透水係數在比較 Oweis、Jang、Fungaroli 等
人的研究[12-14]後,得到一般廢棄物的透水係數應為 10
-3cm/s。
表 2-1 HELP 之探討參數
編號 變因 範圍 CASE1 蒸散層深度 3cm - 30 cm CASE2 集排水層坡度 0% - 平均坡度 CASE3 集排水層透水係數 現地估算值 - 10-7 cm/s CASE4 廢棄物透水係數 10-3cm/s - 10-5cm/s CASE5 掩埋厚度 依現地情況為主2.2.2 邊坡穩定分析
本研究利用 Geo-Slope 公司的產品 SLOPE/W 分析掩埋場的邊坡穩定。在假設邊坡穩定
上,其材料參數的假設是以范與單[15]在 2007 年做的大型直剪試驗為廢棄物剪力強度的參
考標準,集排水層的剪力強度則是以不透水布的剪力強度為主,根據劉家男 [16]整理外國
文獻所得到光滑面 HDPE 地工膜布對黏土與砂土的界面剪力強度,為 c=0,
∘,掩埋
場底部與邊坡的土壤則假設為軟岩層,所有的參數如表 2-2。
表 2-2 邊坡穩定分析之材料參數
分層 單位重(kN/m) 凝聚力(kPa) 摩擦角(∘) 廢棄物層 10 35 34 集排水層 20 0 15 軟岩 24 245.25 0第3章 研究結果
3.1 掩埋場概況
3.1.1 八里下罟子掩埋場
八里掩埋場一、二期場內掩埋使用面積為 11.8626 公頃,掩埋高程為 60m 至 105m,目
前已接近掩埋完成。圖 3-1 為掩埋場的分區示意圖,其中紅線為目前掩埋高度,青線為集
排水管線路徑,綠線為主要分區線段,本研究依不同的掩埋高度、表面坡度、底層層坡度
等,共分為五大區域,這五區各別形狀參數如表 3-1 所示。
圖 3-1 八里掩埋場分區與等高線圖
表 3-1 八里掩埋場各分區形狀參數
Area-1 Area-2 Area-3 Area-4 Area-5 集排水層坡度(%) 21.470% 11.971% 20.300% 0% 11.067% 排水坡長(m) 82.24296 85.95424 52.52347 95.14158 66.22245 掩埋厚度 35.3458 48.9432 33.4657 40 40 表面坡度(%) 5.8294 27.1025 2.3451 4.7992 0 表面坡長(m) 85.7726 125.2407 147.7863 95.9201 361.4402 面積(公頃) 1.643 2.7 1.1784 1.4926 4.8486
3.1.2 苗栗頭份掩埋場
頭份掩埋場二期場內掩埋使用面積為 2.1618 公頃,掩埋高程為 270m 至 285m,最終掩
埋高度為 307m。圖 3-2 為掩埋場的分區示意圖,其中藍線是目前掩埋高度,紅線為最終掩
埋高度,青線為集排水管線路徑,綠線為主要分區線段,本研究依不同的掩埋高度、表面
坡度、底層層坡度等,共分為二大區域,這二區各別形狀參數如表 3-2 所示。
圖 3-2 頭份掩埋場分區與等高線圖
表 3-2 頭份掩埋場各分區形狀參數
Area-1 Area-1-C* Area-2 Area-2-C 集排水層坡度(%) 0.5 0.5 21.647 21.647 排水坡長(m) 29.21223 29.2122 61.25404 61.25404 掩埋厚度 16.4161 36.4408 20 37 表面坡度(%) 4.726 19.4813 4.726 0.4463 表面坡長(m) 135.763 135.763 75.8353 125.2854 面積(公頃) 0.8722 1.3462 1.2896 1.5898 *:-C 表示掩埋完成後的形狀因子
3.2 水文平衡分析結果
3.2.1 八里下罟子掩埋場
圖 3-3 為蒸散層深度對掩埋場滲出水量的影響,在蒸散層為 3cm 時,其滲出水收集量
的計算結果為現場紀錄值的 91.54%,最大日滲出水量則由 1468m
3降至 747 m
3。由圖 3-4
的每日降水量曲線圖,可得知蒸散層僅影響到滲出水量的多寡,並不會對每日滲出水造成
延遲排出時間上的差異。
0 100000 200000 300000 400000 500000 600000 0 5 10 15 20 25 30 35 累 積 滲 出水 量 (C M D ) 蒸散層深度(cm) DRAINAGE TRUE 0 600 1200 1800 2400 3000 3600 最大日 滲出水量 (C M D ) DAILY DRAINAGE圖 3-3 蒸散層深度對累積滲出水量與最大日滲出水量之影響
0 250 500 750 1000 1250 1500 1750 2000 2250 2500 2007/1/1 2008/1/1 2008/12/31 每 日 滲 出水 量 (C M D ) 日期 TRUE CASE 1-1 CASE 1-2 CASE 1-3 0 50 100 150 200 250 300 350 400 450 500 1/1 2/13/1 4/1 5/1 6/1 7/1 8/1 9/110/1 11/1 12/11/1 2/1 3/1 4/1 5/1 6/1 7/1 8/1 9/110/1 11/1 12/1 降雨量 (m m ) RAIN圖 3-4 蒸散層對每日滲出水量之影響
圖 3-5 中可看出,當各區坡度越大時,滲出水水頭高也將越低,但由於各區坡度情況
不同,除了第四區的坡度為 0%外,其他區域皆在 10%以上,導致滲出水排放速度較快,滲
出水也較不易淤積。
0.000 0.050 0.100 0.150 0.200 0.250 0.300 0.350 0.400 0.450 0.500 Highest Hea d a t Zone 1 Highest Hea d a t Zone 2 Highest Hea d a t Zone 3 Highest Hea d a t Zone 4 Highest Hea d a t Zone 5 滲 出水璀 頭高 區域 CASE 1-1 CASE 2-1,0% CASE 2-2,1% CASE 2-3,2% CASE 2-4,3% CASE 2-5,4% CASE 2-6,5% CASE 2-7,6% CASE 2-8,6.76% CASE 2-9,7%圖 3-5 集排水層坡度對滲出水水頭高之影響
圖 3-6 為集排水層透水係數對掩埋場滲出水影響的結果,當集排水層系統的透水係數
達到 10
-4cm/s 後,滲出水水量與滲出水水頭高便達到一穩定值,此結果主要是因為當滲出
水水頭高超過集排水層厚度後,HELP 便將集排水層上一層(如垃圾層)的透水係數加入
計算水頭高與排水速度的模擬中。因為在本研究中,集排水層以上為廢棄物層,而廢棄物
層的透水係數為 10
-3cm/s,導致當集排水層的透水係數小於廢棄物層的透水係數時,集排水
層的透水係數對滲出水水頭高計算的影響將越小,使得累積滲出水量與滲出水水頭高趨近
於一定值。
0 100000 200000 300000 400000 500000 600000 0.0000001 0.000001 0.00001 0.0001 0.001 0.01 0.1 1 累 積 滲 出水 量 (C M D ) 集排水層系統透水系數(cm/s) DRAINAGE TRUE 0.000 2.000 4.000 6.000 8.000 10.000 12.000 滲 出 水 水頭 高 (m )
HIGHEST HEAD of ZONE 1 HIGHEST HEAD of ZONE 2 HIGHEST HEAD of ZONE 3 HIGHEST HEAD of ZONE 4 HIGHEST HEAD of ZONE 5
0.5
圖 3-6 集排水層透水係數對累積滲出水量與滲出水頭高之影響
圖 3-7 為廢棄物層的透水係數對掩埋場滲出水量的影響,當廢棄物的透水係數到達
10
-5cm/s 時,廢棄物的累積滲出水量將有大幅的下降,其主要原因為當降雨發生之後,滲出
水下滲至排水層的速度太慢,導致部份的滲出水被蒸發,讓滲出水收集量減少 35.63%。
0 100000 200000 300000 400000 500000 600000 1E-05 0.0001 0.001 累 積 滲 出 水 量 (C MD ) 廢棄物透水系數(cm/s) DRAINAGE TRUE 0 600 1200 1800 2400 3000 3600 最 大 日 滲出 水量 (C M D ) DAILY DRAINAGE圖 3-7 廢棄物透水係數對累積滲出水量與最大日滲出水量之影響
3.2.2 苗栗頭份掩埋場
圖 3-8 為集排水層坡度對滲出水水頭高的影響, 最高滲出水水頭高發生於集排水層坡
度為 0%時,滲出水水頭高不及 30cm,並在坡度增加後,大幅降低最大滲出水水頭高。
0.000 0.050 0.100 0.150 0.200 0.250 0.300 0.350 0.400 0.450 0.500Highest Hea d a t Zone 1 Highest Hea d a t Zone 2
滲出水璀頭高 區域 CASE 1-1 CASE 2-1,0% CASE 2-2,1% CASE 2-3,3% CASE 2-4,5% CASE 2-5,7% CASE 2-6,9% CASE 2-7,9.4519% CASE 2-8,11%
圖 3-8 集排水層坡度對各區滲出水水頭高之影響
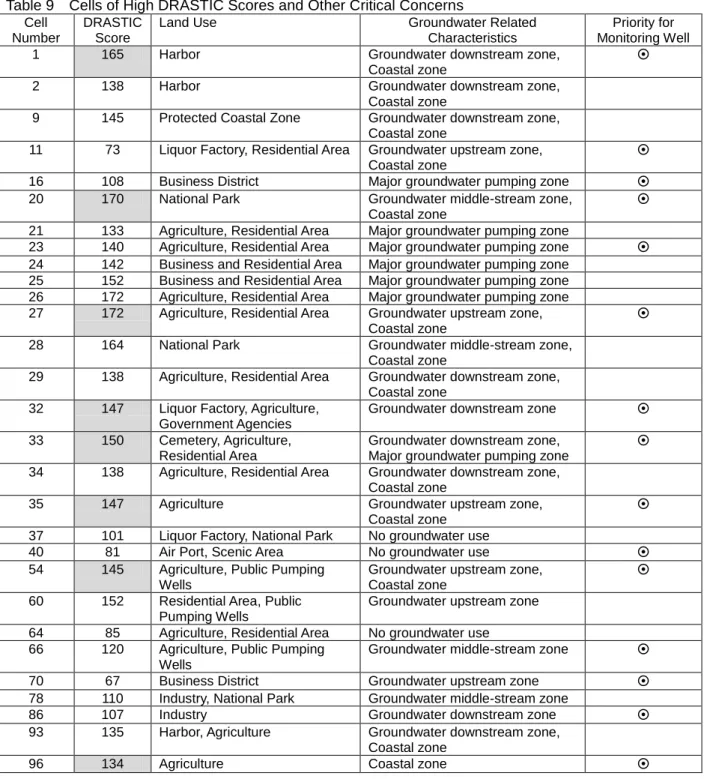
圖 3-9 為集排水層透水係數對滲出水與滲出水水頭高的影響,巨觀下,累積滲出水量
並未有太大的改變,最大滲出水量與最小滲出水量的相差幅度在 2.9%。在集排水層的透水
係數降低到 10
-3cm/s 後,滲出水水頭高將超過 1m 高,當集排水層的透水係數到 10
-4cm/s
時,滲出水水頭高便趨近於一穩定值。
0 10000 20000 30000 40000 50000 60000 0.0000001 0.000001 0.00001 0.0001 0.001 0.01 0.1 1 累 積 滲 出 水 量 (C MD ) 集排水層系統透水系數(cm/s) DRAINAGE TRUE 0.000 2.000 4.000 6.000 8.000 10.000 12.000 滲 出 水 水頭高 (m )HIGHEST HEAD of ZONE 1 HIGHEST HEAD of ZONE 2
0.3345 0.1 0.01 0.001
圖 3-10 為廢棄物透水係數對滲出水的影響,在廢棄物透水係數降低的情況下,累積滲
出水量與最大日滲出水量都大幅度地下降。
0 9000 18000 27000 36000 45000 54000 1E-05 0.0001 0.001 累 積 滲 出水 量 (C M D ) 廢棄物透水系數(cm/s) DRAINAGE TRUE 0 100 200 300 400 500 600 最 大 日 滲出水量 (C M D ) DAILY DRAINAGE圖 3-10 廢棄物透水係數對累積滲出水量與滲出水水頭高之影響
3.3 邊坡穩定分析
3.3.1 八里下罟子掩埋場
八里下罟子掩埋場滑移破壞的邊坡穩定分析中,其縱斷面圖如圖 3-11 所示,邊坡穩
定的結果如圖 3-12 所示,當滲出水水頭越高時,其邊坡穩定的安全係數越低,當集排水層
的滲透係數由 0.5cm/s 降為 10
-6cm/s 時,安全係數亦由 3.552 降至 3.19,降低幅度為 10.2%。
1 2 3 1 2 3 4 5 6 7 8 9 1 0 1 1 1 2 1 3 1 4 1 5 1 6 1 7 1 8 1 9 2 0 2 1 2 2 2 3 2 42 5 2 6 2 7 2 82 9 3 03 1 3 23 3 3 4 3 53 6 3 73 8 3 94 0 4 14 2 4 34 4 4 5 4 6 4 7 4 8 4 9 5 0 5 1 5 2 5 3 5 4 5 5 5 6 5 7 5 8 5 9 6 0 6 1 6 2 6 3 6 4 6 5 6 6 6 7 6 8 6 9 7 0 7 1 7 2 7 37 4 7 5 7 6 7 7 7 8 7 9 8 08 1 8 28 3 8 48 5 8 6 8 7 8 8 8 9 9 0 9 19 2 9 39 4 9 5 9 6 9 7 9 8 9 9 1 0 0 1 0 1 Edg e of a rea 1 /2 Edg e of a rea 2 /4 Edg e of a rea 4 /5 e l ev . li n e of a re a 5 e l ev . li n e of a re a 1圖 3-11 SLOPE/W 八里場斷面圖(集排水層透水係數為 10
-6cm/s)
0 2 4 6 8 10 滲出水水頭高 AREA 1 AREA 2 AREA 3 AREA 4 AREA 5 0.5 3.1 3.2 3.3 3.4 3.5 3.6 0.0000001 0.000001 0.00001 0.0001 0.001 0.01 0.1 1 安全系數 集排水層透水系數 MOMENT FORCE圖 3-12 集排水層透水係數與滲出水水頭高對邊坡穩定之影響
3.3.2 苗栗頭份掩埋場
苗栗頭份掩埋場滑移破壞的邊坡分析中,其縱斷面圖如圖 3-13,與圖 3-14 所示,圖
3-13 為目前掩埋情況所設定的縱斷面圖,圖 3-14 為掩埋完成情況所設定的縱斷面圖。
1 2 3 4 1 23 45 67 891011 1213 1415 1617 1819 2021 2223 2425 26 2728 2930 3132 3334 3536 3738 39 40 41 42 43 4445 46 47 4849 5051 5253 5455 5657 5859 60 61 62 63 64 6566 67 68 6970 7172 7374 7576 77 78 79 Material #: 1 Description: GM Model: MohrCoulomb Wt: 20 Cohesion: 0 Phi: 15 Piezometric Line: 1Material #: 2 Description: WASTE Model: MohrCoulomb Wt: 10 Cohesion: 34 Phi: 35 Piezometric Line: 1Material #: 3 Description: Soft Rock Model: UndrainedPhiZero Wt: 24 Cohesion: 245. 25 Piezometric Line: 0
圖 3-13 頭份場 SLOPE/W 目前掩埋面斷面圖(集排水層透水係數為 10
-6cm/s)
1 2 3 4 1 23 4567 89 101112131415 1617 1819 2021 22 2324 25 2627 2829 3031 3233 3435 3637 38 39 40 41 42 4344 45 46 4748 4950 5152 5354 5556 5758 59 60 61 62 6364 65 66 6768 6970 7172 73 74 75 76 7778 7980 8182 8384 8586 87 88 89 9091 92 93949596 97 98 Material #: 1 Description: GM Wt: 20 Cohesion: 0 Phi: 15 Material #: 2 Description: WASTE Wt: 10 Cohesion: 34 Phi: 35 Material #: 3 Description: Soft Rock Wt: 24 Cohesion: 245.25圖 3-14 頭份場 SLOPE/W 掩埋完成斷面圖(集排水層透水係數為 10
-6cm/s)
由圖 3-15 可看出,在目前掩埋情況下,掩埋場邊坡穩定的安全係數隨著滲出水水頭
高的增加而由 6.033 下降至 5.268,其下降幅度為 12.68%;當集排水層的內摩擦角下降至 8
°時,安全係數亦從 3.164 下降到 2.761,下降幅度為 12.6%。
0 2 4 6 8 10 滲出水水頭高 AREA 1 AREA 2 0.3345 2.2 2.4 2.6 2.8 3 3.2 0.0000001 0.000001 0.00001 0.0001 0.001 0.01 0.1 1 安全系數 集排水層透水系數 MOMENTFORCE圖 3-15 集排水層透水係數與滲出水水頭高在弱滑動界面對邊坡穩定之影響
而由圖 3-16 可看出,在掩埋完成後,掩埋場邊坡穩定的安全係數隨著滲出水水頭高的
增加而由 3.255 下降至 3.077,降低幅度為 5.5%;當集排水層的內摩擦角下降至 8°時,安
全係數亦隨水頭高的增加從 2.050 下降到 1.949,下降幅度為 4.9%。當集排水層的剪力強度
由內摩擦角由 15°降低到 8°時,在目前掩埋狀況下,安全係數將下降約 47%,在掩埋完成
情況下,安全係數將下降約 37%。
0 2 4 6 8 10 滲出水水頭高 AREA 1 AREA 2 1.2 1.4 1.6 1.8 2.0 2.2 0.0000001 0.000001 0.00001 0.0001 0.001 0.01 0.1 1 安全系數 集排水層透水系數 MOMENTFORCE 0.3345圖 3-16 掩埋完成時集排水層透水係數與滲出水水頭高在弱滑動界面對邊坡穩定之影響
第4章 結論
本計畫的研究結果可以歸納出以下論點:
1. 在 HELP 中,降雨的蒸散為主要控制滲出水量的關鍵。在本研究中,滲出水量的多寡主
要受到蒸散層深度、廢棄物透水係數與廢棄物層厚度控制,當蒸散層越深時,滲出水量
越低;當廢棄物透水係數降低時,因為滲出水向下滲漏的速度變慢,所以滲出水水量也
越低;在廢棄物層厚度增加後,場中可容納的滲出水變多,滲出水量也因此增加。
2. 滲出水水頭高受到集排水層透水係數與集排水層坡度影響,而集排水層透水係數影響最
大。集排水層的透水係數越小時,滲出水水頭高將越高。另外在 HELP 的模擬中,滲出
水水頭高超過集排水層的厚度時,滲出水的排放速度會將集排水層的上一層,也就是本
研究中的廢棄物層列入計算之一,因此當集排水層透水係數遠小於廢棄物層的透水係數
後,滲出水水量與出流速度將因為廢棄物層的透水係數一致而趨於穩定。集排水層的坡
度趨於陡峭時,滲出水的出流速度也將加快,因此滲出水水頭高會隨著集排水層的降
低,但與集排水層透水係數的影響相較後較不顯著。
3. 滲出水延遲排出的情況主要受廢棄物層的透水係數影響,當廢棄物的透水係數越低時,
滲出水延遲排放的時間將會越久,在一般廢棄物透水係數為 10
-3cm/s 時,滲出水延遲排
出時間約為 15 日,當廢棄物的透水係數下降到 10
-5cm/s,滲出水延遲排出時間則可以達
到 30 日以上。
4. 當集排水層面臨阻塞,導致集排水層透水係數下降,而且滲出水水頭高隨之上升後,邊
坡穩定的安全係數也將隨之下降,若是集排水層間的內摩擦角強度不足,則安全係數也
將下降,但與內摩擦角強度高的情況相比,其降幅較低。
5.
依據美國環保署的設計規範,一般的掩埋場設計可採用透水係數為 10
-4cm/s 以上之砂層
作為集排水層的保護層,但是依據本研究的模擬結果,在台灣的氣象情況下,當集排水
層的透水係數達到 10
-3cm/s 以下時,掩埋場的最高滲出水水頭高都將在 1.5m 以上,以
美國環保署的規定來看,是不合格的。
6.
依據 2009 年 6 月環保署環境督察公佈的各掩埋場滲出水狀況表,八里掩埋場的設計處
理量為 800CMD,頭份掩埋場為 250CMD。對八里掩埋場分析後,只有在蒸散層為 30cm
時,最大日滲出水量為 749m
3,其餘的影響因子皆使得滲出水的最大日滲出水量超過
800m
3;對頭份掩埋場分析後,在最適情況下,最大日滲出水的計算與設計處理量僅差
0.08m
3,僅在集排水層坡度大於 3%時,其最大日滲出水量將大於 250m
3;當掩埋完成
後,滲出水反而會些微降低,或是在集排水層坡度大於 7%時會造成最大日滲出水量將
大於 250m
3。
在適用性上,HELP 所計算之八里掩埋場的最大日滲出水量高過於設計值,
而頭份掩埋場的最大日滲出水量則是相同的。
第5章 參考文獻
1.
Koerner, R.M. and T.-Y. Soong. Stability Assessment of Ten Large Landfill Failures. 2000:
ASCE.
2.
Qian, X. and R.M. Koerner, A New Method to Analyze for, and Design against,
Translational Failures of Geosynthetic Lined Landfills, in Geosynthetics and
Geosynthetic-Engineered Structures, The 2005 Joint ASME/ASCE/SES Conference on
Mechanics and Materials (McMat 2005). 2005: Baton Rouge, Louisiana. p. 61-98.
3.
Mitchell, J.K. and R.B. Seed, Kettleman Hills Waste Landfill Slope Failure.
I:Liner-System Properties. Journal of Geotechnical Engineering, 1990. 116(4): p.
647-668.
4.
Seed, R.B. and J.K. Mitchell, Kettleman Hills Waste Landfill Slope Failure.
669-690.
5.
Rowe, R.K. and J.F. VanGulck, Filtering and drainage of contaminated water, in 4th
International Conference on Filters and Drainage in Geotechnical and Environmental
Engineering. 2004, Geofilters 2004: Stellenbosch, South Africa.
6.
Koerner, R.M. and G.R. Koerner, Leachate Clogging Assessment of Geotextile and Soil
Landfill Filters. EPA/600/SR-95/141,1995, National Risk Management Research
Laboratory: Cincinnati, OH 45268.
7.
Fleming, I.R., R.K. Rowe, and D.R. Cullimore, Field observations of clogging in a
landfill leachate collection system. Canada Geotechnical Journal, 1999. 36: p. 685-707.
8.
Fleming, I.R. and R.K. Rowe, Laboratory studies of clogging of landfill leachate
collection and drainage system. Canada Geotechnical Journal, 2004. 41: p. 134-153.
9.
行政院環境保護署,
一般廢棄物衛生掩埋場妥善營運管理措施. 2006.
10.
Schroeder, P.R., et al., The Hydrologic Evaluation of Landfill Performance (HELP) Model:
User's Guide for Version 3. EPA/600/R-94/168a,1994, September 1994, U.S.
Environmental Protection Agency Office of Research and Development, Washington, DC.
11.
Schroeder, P.R., et al., The Hydrologic Evaluation of Landfill Performance (HELP) Model:
Engineering Documentation for Version 3 EPA/600/R-94/168b,1994, September 1994,
U.S. Environmental Protection Agency Office of Research and Development, Washington,
DC.
12.
Jang, Y.S., Y.W. Kim, and S.I. Lee, Hydraulic properties and leachate level analysis of
Kimpo metropolitan landfill, Korea. Waste Management, 2002. 22(3): p. 261-267.
13.
Fungaroli, A.A. and R.L. Steiner, Investigation of Sanitary Landfill Behavior. 1979,
Municipal Environmental Research Laboratory: Cincinnati, Ohio.
14.
Oweis, I.S., et al., Hydraulic Characteristics of Municipal Refuse. Journal of Geotechnical
Engineering, 1990. 116(4): p. 539-553.
15.
范佐憲 and 單信瑜, 廢棄掩埋場現地試驗與三維穩定分析, in 第 12 屆大地工程研
討會. 2007: 南投溪頭(NSC 95-2221-E-009-201).
可供推廣之研發成果資料表
□ 可申請專利 □ 可技術移轉
日期:98 年 10 月 20 日
國科會補助計畫
計畫名稱:
計畫主持人:
計畫編號: 學門領域:
技術/創作名稱
發明人/創作人
技術說明
中文:
(100~500 字)
英文:
可利用之產業
及
可開發之產品
技術特點
推廣及運用的價值
※ 1.每項研發成果請填寫一式二份,一份隨成果報告送繳本會,一份送 貴單位
研發成果推廣單位(如技術移轉中心)
。
※ 2.本項研發成果若尚未申請專利,請勿揭露可申請專利之主要內容。
※
3.本表若不敷使用,請自行影印使用。
滲流狀況對於廢棄物掩埋場穩定性之影響
NSC 97-2221-E -009 -125
出國報告
一、研討會概要
本計畫主持人利用本年度國科會計畫出國經費參加於葡萄牙科英布拉大學(University of
Coimbra)由其舉辦之土木工程研討會(The 1st International Conference on Civil Engineering -
Towards A Better Environment)
。研討會舉行的時間為 2009 年 6 月 17 – 19 日三天。地點位
於科英布拉大學的新校區。
本研討會定調為「創造更好的環境」
(Towards A Better Environment),其徵求論文的主
題包括空氣品質、教育、節能、土壤與地下水保護等,詳細主題如下:
A. Air quality
B. Education
C. Energy savings
D. Fluvial and coastal protection
E. Reuse and recycling in construction
F.
Risk management
G. Soil and water protection
H. Territorial and Urban planning
參加研討會的各國與會人士約四十餘人,發表論文共約 20 篇。本計畫主持人發表之論
文為:Assessment of Ground Water Pollution Potential of Kinmen Island (金門之地下水污染
潛勢評估),係以美國環保署發展之地下水污染潛勢評估模式(DRASTIC),蒐集金門的地
文、地質、水文地質等資料以該模式評估金門各區地下水易受污染的相對潛勢。在論文發
表後,也和與會人士針對本論文的相關內容進行討論。
科英布拉大學為葡萄牙最古老且目前國內第一名的大學,在土木工程領域也具有相當之
知名度,該系的 Pedro Pinto 教授現為國際土壤力學與大地工程學會主席,更使該校知名度
提升。
二、與會心得
本次參加研討會的學者專家來自世界各地,較特殊的是東歐、中東地區也都有學者參
與。本次研討會設定的主題較為廣泛,因此與會者不限於土木工程的特定專業領域,但仍
以了環境工程、大地工程、營建材料為主。由發表的論文來看,廢棄物再利用、掩埋場設
計、土壤與地下水污染方面的論文佔了絕大多數。
根據主辦單位的統計,原先投稿摘要的論文約一百多篇,但或許因為經濟不景氣的影
響,導致報名人數降低、實際出席人數銳減的狀況。因此研討會的規模與原先設定的有頗
大落差,也影響了各專業領域學者專家的交流。
本次研討會的副標題為 Towards A Better Environment,因此投稿的論文大都以較先進的
觀念為導向,無論是土壤與地下水污染評估或營建廢棄物的再利用等,都是以前瞻性的概
念來面對資源的管理。可見世界各國也都支持這類型的研究,以積極面對未來的人類生活
環境變化。因而更可以確認國內研究也都將跨越過去以個別污染物特性為主的研究類型,
而以污染物生命週期、物質流、環境管理、風險管理等為未來的研究發展主軸。
綜合而言,本次研討會讓各國的與會人員得以就其所長,在以 Towards A Better
Environment 的概念下進行交流,不僅增進了對於各國環境議題與目前研究發展概況的瞭
解,也更使得與會人員得以拓展國際視野,學習各國在不同環境議題與研究領域得最新知
識與技術。
ASSESSMENT OF GROUND WATER POLLUTION POTENTIAL OF
KINMEN ISLAND
Hsin-Yu Shan, Department of Civil Engineering, National Chiao Tung University, Taiwan Ying-Chun Hung, Department of Civil Engineering, National Chiao Tung University, Taiwan
Abstract
In Kinmen district, the rate of ground water usage is very high due to the congenital
lack of surface water resources. The water used for domestic purpose accounts for more
than forty-five percent of total public water supply. Therefore, it is important for the
government agencies to keep track of the ground water quality. In this research, extensive
hydrologic and geologic data of Kin-men district were collected. By using the DRASTIC
model established by United States Environmental Protection Agency (USEPA) in
association with American Well Association, the contamination potential index of ground
water in Kin-men is established. The results could be used as a basis for establishing a
ground water monitoring program. Fifteen locations with highest DRASTIC scores are
suggested as the first-priority sites for installing ground water monitoring wells. In addition,
risk assessment done by incorporating additional information on the land development
conditions could also be used to set up wellhead protection program in the future.
Keywords: groundwater, pollution, monitoring, vulnerability, risk
1. Introduction
In recent years, the importance of groundwater quality protection has been recognized by the central governments in Taiwan. For the main Taiwan Island, network of groundwater monitoring wells has been in service for more than 10 years. On the other hand, for the several small islands, among which some are located near the mainland of China, the groundwater monitoring network has not been fully established. However, the water supply of these islands is highly dependent on groundwater. Kinmen is an island located less than 10 kilometers off the coast of mainland China. Approximately 86,000 people lived on the island of 150 km2. The population consumes 20,000 tons of water daily, of which 9,000 tons comes from groundwater [1]. Currently, there is no groundwater monitoring wells to monitor regional groundwater quality of the island.
The purpose of this study is to assess the vulnerability of groundwater by mapping the Kinmen island using the assessment tool DRASTIC developed by the U.S. EPA. The results will serve as the basis for zoning development area and allowable activities by the local government in order to protect the groundwater quality of Kinmen.
2. Background
Although the Kinmen water supply company pumps approximately 9000 tons of groundwater to provide 45% of the domestic water use, there is no groundwater monitoring well network set up to safeguard the groundwater from being polluted by human activities. The groundwater quality is only examined at the 22 pumping wells of the water supply company. Study of groundwater by investigation on domestic pumping wells revealed that the turbidity and hardness of the groundwater in Kinmen is low, while no significant signs of pollution had been observed [2]. For the time being, agriculture and tourism are the two major source of income of the islanders. Industry, except for the Kaoliang wine production, is limited in number and size. In addition to the agricultural pollution that caused by the use of fertilizers, herbicides, and pesticides, the
considerable number of military bases and camps used to occupied by around 100,000 military personnel in the cold war era are potentially the major source of groundwater pollution. BTEX in petroleum products leaked from the storage tanks and chlorinated solvents used in the maintenance facilities and garages of the bases and camps are very likely to appear in the groundwater.
In order to establish the priority of locations to install groundwater monitoring wells, systematic approaches must be employed. The monitoring well can be installed according to their spatial distribution or the potential impact of various regions on the groundwater quality. When available financial resource is very limited, the effectiveness of the monitoring well network to serve as early warning system becomes the critical issue. As a result, vulnerability assessment of the groundwater resources by mapping the recharge regions provides the most reasonable approach to determine the location for installing monitoring wells. DRASTIC is a standardized system for evaluating groundwater pollution potential using parameters that represent the hydrogeologic settings. DRASTIC was developed by the U.S. Environmental Protection Agency in collaboration with the American Well Association [3]. DRASTIC stands for Depth to water table, Net recharge, Aquifer media, Soil media, Topography, Impact of vadose zone, and Conductivity of the aquifer. DRASTIC uses index values derived from the 7 key aquifer properties to generate an overall vulnerability distribution for the aquifer.
The D parameter represents the depth of the water table below ground surface. As potential contaminants must cross this distance before reaching the groundwater, greater water table depth implies lower vulnerability.
The R parameter represents recharge to the aquifer. Recharge is the principal means for leaching and transporting contaminants to the water table; therefore greater recharge increases the likelihood that contaminants will reach the groundwater. Recharge from precipitation was added to recharge from irrigation to obtain the total recharge.
The A parameter represents the nature of the aquifer medium. The larger the grain size, the higher the permeability, and thus vulnerability, of that aquifer. Material data was converted to A-Rating on a well-by-well basis.
The S parameter represents the influence of soil material on the overall infiltrability of the ground. In general, the less clays shrink and swell, and the smaller the grain size of the soil, the less permeable the soil will be and the less likely contaminants will be to reach the water table.
The T parameter represents the effect that the slope of the land surface has on infiltration. On steeper slopes, runoff is typically greater and a given pollutant has an increased chance of being incorporated into that runoff. This reduced likelihood that a contaminant will enter an aquifer in areas with steeper topography therefore implies reduced aquifer vulnerability in such areas.
The I parameter represents the impact of the vadose (unsaturated) zone material on the overall infiltrability of the ground. The texture of this material influences the ease with which contaminants may pass through it. Finer-grained vadose zone material generally inhibits this movement and therefore implies lower aquifer vulnerability.
The C parameter represents the hydraulic conductivity (K) of the aquifer medium. This corresponds to the ease with which water (and contaminants) may flow and disperse through the aquifer. Therefore, a medium having greater hydraulic conductivity (permitting higher flow) implies increased aquifer vulnerability. The final DRASTIC score is determined by calculating a weighted sum of the individual aquifer attribute:
DRASTIC score =D wD + R wR + A wA + S wS + T wT + I wI + C wC (1)
where D, R, A, S, T, I, C are index ratings and wD, wR, wA, wS, wT, wI, wC are weighting factors. Weighting
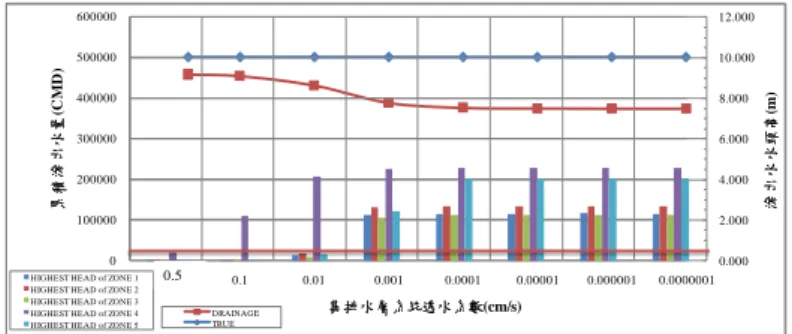
factors for general cases and agricultural purpose are listed in Table 1. Table 1 Weighting Factors of DRASTIC [3]
Index General Agricultural
D (Depth to Water Table) R (Net Recharge) A (Aquifer Media) S (Soil Media) T (Topography)
I (Impact of Vadose Zone)
C (Hydraulic Conductivity of the aquifer)
5 4 3 2 1 5 3 5 4 3 5 3 4 2
3. Determination of DRASTIC Index Rating
Kinmen is an island of granite formation. The Taiwu Mountain with highest altitude of 253 meters above mean sea level locates in the eastern part of the island, which has a hilly terrain of granite formation (Fig. 1). The unconfined aquifer consists of materials from sandy soil, residual soils, to weathered rocks. On the other hand, the western part of the island is relatively flat and the unconfined aquifer primarily consists of sand. The unconfined aquifers underneath the eastern part and western part of the island are hydraulic independent. Groundwater in Kinmen basically flows following the terrain. In east Kinmen, groundwater flows from Taiwu Mountain towards the coast in all directions. In west Kinmen, groundwater generally flow from east to west and towards the sea.
and cells 45 to 96 cover the west and the east Kinmen, respectively (Fig. 2). N 3 0 0 0 m 0 S c a l e 1 : 1 2 5 0 0 0 1 2 3 4 5 6 7 8 9 10 11 12 13 14 15 16 17 18 19 21 22 23 24 25 26 27 28 29 30 31 32 33 34 35 36 37 38 39 40 41 42 43 44 45 46 48 49 50 51 52 53 54 47 55 56 57 58 59 60 61 62 63 64 65 66 67 68 69 70 71 72 73 74 75 76 77 78 79 80 81 83 84 85 86 87 88 92 93 94 95 96 20 91 90 89 82 圖5.1、金門地區DRASTIC之網格編號 Fig. 1 Satellite Photograph of Kinmen Fig. 2 Division and Numbering of Cells
The ratings of the DRASTIC indices are determined by examining existing data of the hydrogeologic settings. Range of values of the data and the rating were chosen to distinguish the characteristics of the island aquifer and the resultant vulnerability.
For determining ratings of index D, the depth to water was taken directly from the static water level data of 1179 domestic wells [4]. The locations of the public and domestic pumping wells are shown in Fig. 3. The groundwater table of west Kinmen, where groundwater is the major source water supply, changes significantly from dry to wet seasons every six months. The groundwater table near the western coast of Kinmen is approximately 10 m below ground surface. The depth of groundwater table of the central part of west Kinmen, where groundwater is most abundant, ranges from 15 to 20 m. On the other hand, the groundwater table of east Kinmen, where reservoirs serve as the major source of water supply, ranges from 20 to 30 m and remains fairly constant throughout the year. The contour map of depth of groundwater table of March 1998 is shown in Fig. 4. The rating of index D corresponding to the depth to groundwater table is listed Table 2. 3000 m 0 Scale 1 : 125000 - 5 5 - 5 0 - 4 5 - 4 0 - 3 5 - 3 0 - 2 5 - 2 0 - 1 5 - 1 0 -5 地下水 位深度 (單位:公尺) 3000 m 0 Scale 1 : 125000 圖5.4、金門地區三月份地下水水位分佈圖 Fig. 3 Locations of Pumping Wells Fig. 4 Depth to Groundwater Table
Since there is only one official weather station in Kinmen and no experimental data of the infiltration rate of Kinmen, it is difficult to estimate the net recharge into the aquifer accurately. Rational formula is thus used to estimate the runoff and the net recharge:
R = P - Q = (1 – CR) I A (2)
where R = Net recharge; Q = Peak runoff discharge, cfs; CR = Rational method runoff coefficient; I= Rainfall
intensity, inch/hour; A = Drainage area. The land use pattern of the 96 cells was investigated and CR values
are assigned to each cell. Net recharge is computed with the average rainfall of 1047 mm/yr. Runoff coefficients specified in ASCE/WPCF Manual of Design and Construction of Sanitary and Storm Sewers [5] was adopted in this study.
The boring data of 437 boreholes were collected from the boring records of public and private constructions kept by the Construction Bureau of Kinmen County Government. Locations of boreholes whose boring logs were used to determine rating of indices A, S, I, and C are shown in Fig. 5. As shown in Figs. 3 and 5, both the pumping wells and the boring logs are well distributed and covers most of the island, only very limited number of cells do not have wells or borings located within.
Based on the soil data from the boreholes, the aquifer media in Kinmen are divided into six categories. The aquifer media of a large part of the aquifer in east Kinmen is weathered sandstone. On the other hand,
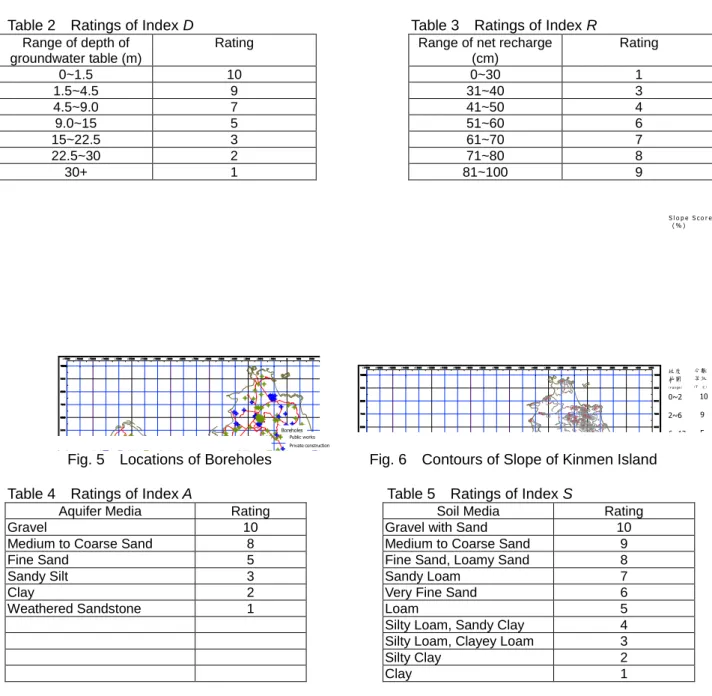
west Kinmen aquifer composed of granular soils in most cases. The rating of index A for each type of aquifer media is listed in Table 4. The soil types found at the ground surface are more diverse such that they are divided into ten categories. The ratings of index S assigned to each category are listed in Table 5. Table 2 Ratings of Index D Table 3 Ratings of Index R
Range of depth of groundwater table (m)
Rating Range of net recharge
(cm) Rating 0~1.5 10 0~30 1 1.5~4.5 9 31~40 3 4.5~9.0 7 41~50 4 9.0~15 5 51~60 6 15~22.5 3 61~70 7 22.5~30 2 71~80 8 30+ 1 81~100 9 3000 m 0 Scale 1 : 125000 公共工程鑽探井 民間工程鑽探井 圖例: 圖5.7、金門地區已調查之鑽探井位置圖 N Public works Private construction Boreholes 10 9 5 3 1 分數 等級 (T 值) 圖、 金門地形坡度圖 0 3000 m Scale 1 : 125000 0~2 2~6 6~12 12~18 18+ 坡度 範圍 (range) 10 50 40 30 20 30 60 304060 50 40 30 20 10 40 40 30 20 10102030404050 4030 40 20 20 30 57 40 42 47 68 70 20 20 40 50 30 40 40 20 20 40 30 20 20 3020 20 30 20 20 30 49 30 30 20 20 50 40 43 4240 30 50 5040 30 30 40 20 40 30 41 5050 29 50 50 414747 304040 50 50 30 20 40 30 53 40 30 40 40 30 42 20 56 50 40 30 20 20 20 20 20 20 33 30 20 26 20 30 30 47 47 50 50 50 50 40 40 50 30 40 45 10 20 30 71 7430 57 30 20 10 10 20 30 120 90 133 110 80 90 60 8090100 80 80 100 107 90 80 70 60115 90120130 218 161 173 64 50 40 50 53 40 30 30 20 167 255 253 115 100 90 100 40 20 20 20 20 30 30 20 20 20 20 20 30 55 20 30 10 23 55403020 20 20 20 20 30 40 50 40 304030 20 37 40 40 30 60 60 70 70 80 8060 70 50 111 1269174 40 30 20 20 413030 20 107 107 58 60 30 20 20 20 30 30 35 40 52 55 53 62 40 43 3020 20 30 30 30 20 20 31 30 44 31 3220 28 78 81 54 40 30 30 40 53 40 40 80 93 155 162 262 30 50 20 20 32 27 30 20 36 32 40 35 38 34 43 20 20 20 20 51 53 40 30 36 20 20 S l o p e S c o r e ( % )
Fig. 5 Locations of Boreholes Fig. 6 Contours of Slope of Kinmen Island Table 4 Ratings of Index A Table 5 Ratings of Index S
Aquifer Media Rating Soil Media Rating
Gravel 10 Gravel with Sand 10
Medium to Coarse Sand 8 Medium to Coarse Sand 9
Fine Sand 5 Fine Sand, Loamy Sand 8
Sandy Silt 3 Sandy Loam 7
Clay 2 Very Fine Sand 6
Weathered Sandstone 1 Loam 5
Silty Loam, Sandy Clay 4
Silty Loam, Clayey Loam 3
Silty Clay 2
Clay 1
The average slope of each cell was determined by averaging the slope of four sides, which, in turn, were computed with the elevations of the four corners of each cell obtained from the topographic map of Kinmen. East Kinmen has steeper slopes while west Kinmen is relatively flat. The ratings of index T corresponding to the slope of the ground surface are listed in Table 6.
The soils of the vadose zone in Kinmen are mostly sand and sandy loam. The central part of Kinmen used to be mine quarry of Kaolinite such that shallow zone near the ground surface is still mostly clay. The ratings of index I for various types of vadose zone soil are listed in Table 7.
Table 6 Ratings of Index T Table 7 Ratings of Index I
Slope (%) Rating Vadose Zone Soil Rating
0~2 10 Gravel with Sand 10
2~6 9 Coarse Sand 7
6~12 5 Medium Sand 6
12~18 3 Fine Sand 4
18+ 1 Silty Sand, Silt 3
Clay 1
Due to the lack of experimental data of hydraulic conductivity of aquifer media in Kinmen, ratings for index C are assigned to each cell were assigned based on types of soils identified in the boring logs and their corresponding range of hydraulic conductivity [6].
The weighting factors for general cases in Table 1 were adopted for this study. Therefore, the final DRASTIC score is calculated with the following equation:
DRASTIC score = 5D + 4R + 3A + 2S + 1T + 5I + 3C (3) where the highest possible DRASTIC value calculated is 230 while the lowest is 23.
Table 8 Ratings of Index C for Soils of Various Hydraulic Conductivity
Type of Soil Hydraulic Conductivity (cm/s) Rating
Gravel 10-2-1 10 Coarse Sand 10-3-10-1 9 Medium Sand 10-2-10-4 8 Fine Sand 10-5-10-3 6 Sandy Silt 10-6-10-4 4 Sandy Clay 10-6-10-7 2
Clay, Weathered Sandstone 10-6-10-9 1
4. Results and Discussion
The distribution of ratings of index D is shown in Fig. 7. The depth to groundwater is shallower, i.e. 10 to 20 m, in west Kinmen such that most cells are rated 3 or 5; while the depth of groundwater table is considerable deeper, i.e. 20 to 30 m, for the hilly east Kinmen, the corresponding ratings are 1 and 2 for most cells.
As determined by using Eq. (2), the net recharge near the coastal area which is mostly sandy farmland or undeveloped zone ranges 80 – 100 cm per year and the index R was rated 8 to 9 (Fig. 8). The net recharge of agricultural zones with loamy soils that occupy the most area of central parts of east and west Kinmen is estimated to be around 50 – 70 cm. The rating of R of these area ranges from 6 – 7. Furthermore, for the townships where the a large portion of the ground surface is covered by concrete buildings or asphalt concrete, the net recharge is less than 40 cm so that the R rating is 4.
N 1 2 3 4 5 6 7 8 9 10 3000 m 0 Scale 1 : 125000 D分數 權重:5 圖 、金門DRASTIC之D(地下水位深度)分數 3 0 0 0 m 0 S c a l e 1 : 1 2 5 0 0 0 N 1 2 3 4 5 6 7 8 9 10 R分數 權重:4 圖 、金門DRASTIC之R(淨補注量)分數 Fig. 7 Distribution of Ratings of Index D Fig. 8 Distribution of Ratings of Index R
The boring logs collected in this study show the porous media of the west Kinmen aquifer are alluvial sands deposited by the streams that changed their courses numerous times in the past. The aquifer media ranges from medium to coarse sands and silty sands with rating of index A of 8 and 5, respectively (Fig. 9). The aquifer of east Kinmen near the Taiwu Mountain consists of weathered sandstone and granite with a low A-rating of 1. The aquifer materials of the other part of east Kinmen are often sandy silt and sandy clay which correspond to a rating of 3.
N 1 2 3 4 5 6 7 8 9 10 3000 m 0 Scale 1 : 125000 權重:3 圖 、金門DRASTIC之A(含水層介質)分數 N 1 2 3 4 5 6 7 8 9 10 3000 m 0 Scale 1 : 125000 S分數 權重:2 圖 、金門DRASTIC之S(土壤介質)分數 Fig. 9 Distribution of Ratings of Index A Fig. 10 Distribution of Ratings of Index S
The soil within less than 1 m below the ground surface of Kinmen is largely sands and silty loam. In the central part and coastal zones of east Kinmen the top soil is sand. The relatively high potential to allow
pollution to infiltrate into the aquifer leads to a high rating of index S of 9 (Fig. 10). The central-east of Kinmen are farmlands and protected natural reserve areas with sandy top soils of an S-rating of 8. The center of Kinmen with clay top soils was rated 1 for index S.
For west Kinmen with a rather flat terrain, the rating of index T is either 9 or 10 for most cells (Fig. 11). For east Kinmen, the steeper slopes around Taiwu Mountain result in lower ratings of T.
Approximately 70% of the vadose zone of Kinmen consists of medium to coarse sands and weathered sandstone with considerable ability to allow vertical migration of pollutants with little retardation. These areas are assigned with a rating of index I of 6 (Fig. 12). The areas near the central part of Kinmen with silty or clayey soils in the vadose zone are assigned a low I-rating of 1 and 2.
N 1 2 3 4 5 6 7 8 9 10 3000 m 0 Scale 1 : 125000 T分數 權重:1 圖 、金門DRASTIC之T(地形坡度)分數 N 1 2 3 4 5 6 7 8 9 10 3000 m 0 Scale 1 : 125000 I分數 權重:5 圖 、金門DRASTIC之I(未飽和層影響)分數 Fig. 11 Distribution of Ratings of Index T Fig. 12 Distribution of Ratings of Index I
The majority of the aquifer media in northern west Kinmen is sandy or silty soils of medium hydraulic conductivity ranging from 10-6 to 10-4 cm/s. As a result, the cells in these areas were given rating of index C from 4 to 6 (Fig. 13). For southern part of west Kinmen, the aquifer material is mostly medium to coarse sand, the I-rating is significantly higher and range from 8 to 10. For Taiwu Mountain region in east Kinmen whose aquifer consists of porous media of lower hydraulic conductivity, such as clayey soils or weather rock, the C-rating ranges from 1 to 2.
The total DRASTIC score of the 96 cells are shown in Fig. 14. There are 10 cells with DRASTIC score less than 90 all located in the region of Taiwu Mountain which extends towards the center of the island. There are 13 cells given DRASTIC scores higher than 140, among which 5 higher than 160. Among the cells of top 15 DRASTIC score, only 2 are in east Kinmen. The frequency distribution of the DRASTIC score is shown in Fig. 15. N 1 2 3 4 5 6 7 8 9 10 3000 m 0 Scale 1 : 125000 C分數 權重:3 圖 、金門DRASTIC之C(含水層水力傳導特性)分數 N 3000 m 0 Scale 1 : 125000 DRASTIC 總分數 < 80 91-100 121-130 151-160 111-120 > 160 131-140 101-110 141-150 81-90 圖5.14、金門地區DRASTIC地下水污染潛勢指標值 Total Score
Fig. 13 Distribution of Ratings of Index C Fig. 14 Spatial Distribution of DRASTIC Score The southwestern part of the island obtained the highest scores. It happens to be the most developed area of Kinmen where the county government and business dictrict are located. The pumping wells of the water treatment plant are all located in this region. The Kinmen Liquor Company near the southwestern tip of Kinmen also draws groundwater from this aquifer. On the other hand, since the ground surface is steeper, aquifer material is less permeable, and the groundwater table is deeper, the vulnerability of aquifer to pollution of east Kinmen is significantly lower.
In addition to the vulnerability of aquifer to pollution due to hydrogeological settings, various types of human activities also give rise to potential of groundwater pollution of different degrees. The density of population and economic activities in southwestern Kinmen further increases the risk of groundwater pollution.
0 2 4 6 8 10 12 14 West Kinmen East Kinmen N u m b e r o f 1 k m x 1 k m c e ll DRASTIC Score
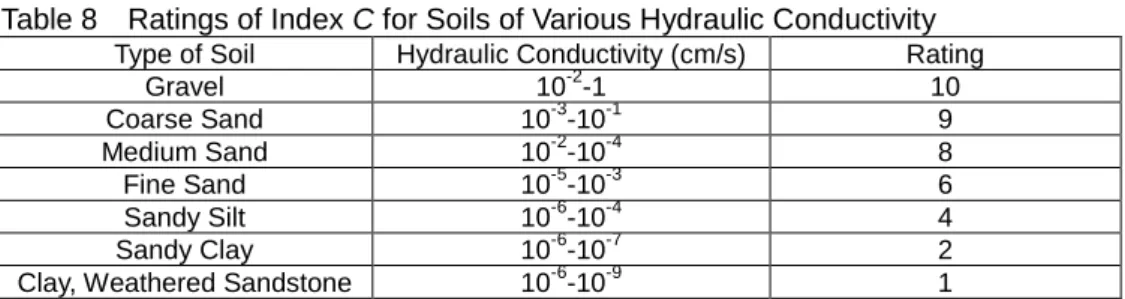
Fig. 15 Frequency Distribution of DRASTIC Score Table 9 Cells of High DRASTIC Scores and Other Critical Concerns
Cell Number
DRASTIC Score
Land Use Groundwater Related
Characteristics
Priority for Monitoring Well
1 165 Harbor Groundwater downstream zone,
Coastal zone
2 138 Harbor Groundwater downstream zone,
Coastal zone
9 145 Protected Coastal Zone Groundwater downstream zone,
Coastal zone
11 73 Liquor Factory, Residential Area Groundwater upstream zone,
Coastal zone
16 108 Business District Major groundwater pumping zone
20 170 National Park Groundwater middle-stream zone,
Coastal zone
21 133 Agriculture, Residential Area Major groundwater pumping zone
23 140 Agriculture, Residential Area Major groundwater pumping zone
24 142 Business and Residential Area Major groundwater pumping zone
25 152 Business and Residential Area Major groundwater pumping zone
26 172 Agriculture, Residential Area Major groundwater pumping zone
27 172 Agriculture, Residential Area Groundwater upstream zone,
Coastal zone
28 164 National Park Groundwater middle-stream zone,
Coastal zone
29 138 Agriculture, Residential Area Groundwater downstream zone,
Coastal zone
32 147 Liquor Factory, Agriculture,
Government Agencies
Groundwater downstream zone
33 150 Cemetery, Agriculture,
Residential Area
Groundwater downstream zone, Major groundwater pumping zone
34 138 Agriculture, Residential Area Groundwater downstream zone,
Coastal zone
35 147 Agriculture Groundwater upstream zone,
Coastal zone
37 101 Liquor Factory, National Park No groundwater use
40 81 Air Port, Scenic Area No groundwater use
54 145 Agriculture, Public Pumping
Wells
Groundwater upstream zone, Coastal zone
60 152 Residential Area, Public
Pumping Wells
Groundwater upstream zone
64 85 Agriculture, Residential Area No groundwater use
66 120 Agriculture, Public Pumping
Wells
Groundwater middle-stream zone
70 67 Business District Groundwater upstream zone
78 110 Industry, National Park Groundwater middle-stream zone
86 107 Industry Groundwater downstream zone
93 135 Harbor, Agriculture Groundwater downstream zone,
Coastal zone
96 134 Agriculture Coastal zone
could be identified. However, when selecting locations to install groundwater monitoring wells, the direction of groundwater flow and the nature and intensity human activities must also be taken into account. Among the cells with highest DRASTIC scores, the cells in which pumping wells of water supply companies are located, the cells with potential source of pollution or important groundwater use, and the cells of major recharge area are listed in Table 9. The cells determined to have priority for installing groundwater
monitoring wells are also indicated. A total of 15 groundwater monitoring wells are proposed to be installed to establish the groundwater quality monitoring network (Fig. 16).
Out of the 15 proposed monitoring wells, 10 are located in west Kinmen where groundwater is the major source of water supply, to safeguard the quality of water for public and private use. On the other hand, the other 5 monitoring wells are proposed to be installed in east Kinmen to establish long-term groundwater quality database. The cells where groundwater is extracted in a large amount, such as 16, 21, 22, 23, 24, 25, 26, 33, 54, 60, and 66, groundwater monitoring wells are proposed to be installed in cells upstream, such as 16, 23, 32, 33, 54, and 66. N 3000 m 0 Scale 1 : 125000 1 2 3 4 5 6 7 8 9 10 11 12 13 14 15 16 17 18 19 21 22 23 24 25 26 27 28 29 30 31 32 33 34 35 36 37 38 39 40 41 42 43 44 45 46 48 49 50 51 52 53 54 47 55 56 57 58 59 60 61 62 63 64 65 66 67 68 69 70 71 72 73 74 75 76 77 78 79 80 81 83 84 85 86 87 88 92 93 94 95 96 20 91 90 89 82
圖5.17、金門地區地下水監測站網分佈情形
1 11 16 20 27 23 35 32 33 40 54 66 70 86 96Fig. 16 Locations of Fifteen Proposed Groundwater Monitoring Wells
5. Results and Discussion
In this study, hydrogeologic data of the aquifer of Kinmen were collected and mapped to obtain ratings corresponding to the seven DRASTIC indices. The resultant total DRASTIC scores reveal that the aquifer of west Kinmen, where groundwater is the major source of water supply, is also more vulnerable to pollution induced by human activity than east Kinmen. Since Kinmen is very limited in size and its terrain is rather flat there is no clearly defined upstream recharge zone of groundwater. In other words, the entire west Kinmen is simply the recharge zone. It is thus even more critical to regulate land use and human activities in order to prevent pollution infiltrating into the aquifer.
A total of 15 groundwater monitoring wells are proposed as an initial effort to establish a groundwater quality monitoring network. The locations are selected not only based on DRASTIC score but also taking into account the direction of groundwater flow, the land use pattern, and the potential of pollution by human activities.
Furthermore, the study also shows that DRASTIC is a very simple and straight forward tool for evaluating vulnerability of aquifer. The rating of indices based on relative magnitude of the hydrogelogic parameters is a very powerful tool. Even without accurate experimental data on properties such as hydraulic conductivity, their values can still be obtained by using general values for the basic soil types. Ratings based on these data can still yield discrete ratings ready to be used to compute the total score. If coupled with more detailed data on the potential of discharge of pollutants into the aquifer, a risk assessment and management system for aquifer can be developed based on DRASTIC.
References
[1] Kinmen Water Supply Company, 1998, Water Resources Planning of Kinmen, 256 p. (in Chinese) [2] Kinmen Water Supply Company, 1995, Proposal for Groundwater Monitoring Network of Kinmen, 135 p. (in Chinese)
[3] U.S. Environmental Protection Agency, 1987, DRASTIC:A Standardized System for Evaluating Ground
Water Pollution Using Hydrogeologic Settings, EPA Number: 600287035, 643 p.
[4] Kinmen County Government, 1987, Project Report on Planning of Kinmen Water Right Registration
Management System, 344 p. (in Chinese)
[5] ASCE, 1993, Design and Construction of Urban Stormwater Management Systems (Manual of
Practice No. 77), 724 p.

![Table 1 Weighting Factors of DRASTIC [3]](https://thumb-ap.123doks.com/thumbv2/9libinfo/8585727.189538/21.892.99.639.870.1003/table-weighting-factors-drastic.webp)