www.elsevier.com / locate / chroma
E
ffects of metal ions on concentration of DNA in high-conductivity
media by capillary electrophoresis
*
Chih-Ching Huang, Tai-Chia Chiu, Huan-Tsung Chang
Department of Chemistry, National Taiwan University, 10764 Taipei, Taiwan Received 28 November 2001; received in revised form 2 May 2002; accepted 17 May 2002
Abstract
On-line concentration and separation of DNA prepared in low- or high-conductivity media has been demonstrated using poly(ethylene oxide) (PEO) solution in the presence of electroosmotic flow. DNA fragments migrating against EOF stacked at the boundary between the sample zone and PEO solutions, mainly because of sieving and increases in the viscosity. Unlike conventional methods, the large DNA fragments were detected earlier toward the cathode end in this study. The limit of detection (LOD) at a signal-to-noise ratio53 for fX174 RF DNA-Hae III digest prepared in 50 mM Tris–borate, pH 10.0, was down to 0.171 ng / ml, with an 860-fold improvement (compared to that obtained by 10-s injection at 25 V/ cm) in the sensitivity, when injecting about 2.58 ml. By applying a short plug (2.3 cm) of 0.5 mM AgNO prepared in 1.5% PEO3 solution after sample injection, the analysis of up to 0.75 ml DNA prepared in phosphate-buffered saline (PBS) has been carried out without any tedious desalting processes. This results in an LOD of 6.86 ng / ml for the DNA sample and a 155-fold improvement in the sensitivity. Moreover, this method has allowed the analysis of 0.75 ml of polymerase chain reaction products amplified after 18 cycles with good reproducibility.
2002 Elsevier Science B.V. All rights reserved.
Keywords: Electroosmotic flow; DNA; Metal cations; Poly(ethylene oxide)
1
. Introduction cell, diffusion and imperfect distribution of the
electric field strength inside the capillary that might Capillary electrophoresis (CE) compared to high- cause loss of resolution, sensitivity improvement was performance liquid chromatography suffers from low not great (only several tens fold). Thus, these concentration sensitivity, despite its advantages of methods are not quite useful for DNA analysis such rapidity, high-resolving power, and lesser amounts of as DNA sequencing and single nucleotide polymor-sample and reagents used [1–4]. This is mainly due phism (SNP), wherein high-resolving power is of to small injection volumes (nl) and short optical path extreme importance [7–10].
lengths (e.g. 75 mm). To enlarge the optical length, Although DNA can be amplified by polymerase Z-shaped and bubble-cell capillaries have been used chain reaction (PCR), techniques allowing improve-[5,6]. Owing to the limit of the size of the bubble ments in the sensitivity are always welcomed with respect to speed and cost [11]. So far, a number of friendly on-line electrophoretic concentration
tech-*Corresponding author. Tel. / fax: 1886-2-2362-1963.
E-mail address: [email protected](H.-T. Chang). niques have been developed in CE, including iso-0021-9673 / 02 / $ – see front matter 2002 Elsevier Science B.V. All rights reserved.
tachophoretic (ITP) analysis [12,13] and field ampli- volumes of DNA or proteins prepared in low-con-fication [14,15]. Although, more than 100-fold im- ductivity media, but not for that prepared in high-provements in the sensitivity for DNA prepared in conductivity media [22]. This is mainly due to a low-conductivity media are easily achieved by these small DNA migration in high-conductivity media. To techniques, the analysis of DNA prepared in high- overcome this shortage, techniques based on switch-conductivity media remains problematic, including ing the polarity after removing large amounts of the loss of resolution, a poor stacking efficiency, and background electrolytes have been developed irreproducibility [16–18]. To partially overcome [25,26]. Alternatively, we described a method similar these shortages, the separation could be performed at to our previous ones for the analysis of up to about low electric field strengths or the conductivity of the 0.75 ml DNA prepared in high-conductivity media sample zone must be decreased. The former is not [20–22]. We have found the importance of applying attractive because of slowness and poor stacking a plug of AgNO solution between the sample zone3 efficiency. Titrating tris(hydroxymethyl) amino- and PEO solution. To show the feature of this new methane (Tris) cations used to prepare DNA samples method, the analysis of large volumes of polymerase with hydroxide ions was found effective to reduce chain reaction (PCR) product was also demonstrated. the conductivity, leading to DNA stacking [19]. One
shortage of this method is a low sensitive
improve-ment (less than 100-fold) because the injection 2 . Materials and methods length was limited in order to provide a
high-resolv-ing power. 2 .1. Apparatus
Recently, we have developed methods for the
separation of large volumes of proteins and DNA in The basic design of the separation system has been poly(ethylene oxide) (PEO) solution using bare previously described [27]. Briefly, a high-voltage fused-silica capillaries [20–22]. In the presence of power supply (Gamma High Voltage Research, Or-electroosmotic flow (EOF), PEO enters the capillary mond Beach, FL, USA) was used to drive electro-filled with Tris–borate (TB) buffer from the anode phoresis. The entire detection system was enclosed end after DNA injection. With small migration in a black box with a high-voltage interlock. The mobilities (EOF mobility minus the electrophoretic high-voltage end of the separation system was put in mobility of DNA), DNA fragments migrate in PEO a laboratory-made plexiglass box for safety. A 1.5-solutions, resulting in decreases in the electropho- mW He–Ne laser with 543.6 nm output from Melles retic mobilities. As a result, DNA stacks at the Griot (Irvine, CA, USA) was used for excitation. The interface between the sample zone and PEO solu- light was collected with a 103 objective (numeric tions. In contrast to conventional methods (in the aperture50.25). One RG 610 cut-off filter was used absence of EOF), large DNA fragments are detected to block scattered light before the emitted light earlier in the cathode end because DNA migrates reaches the photomultiplier tube (Hamamatsu R928). against EOF. We have pointed out that poor con- The amplified currents were transferred directly centration, irreproducibility, and loss of resolution through a 10-kV resistor to a 24-bit A / D interface at are problematic when injecting large-volume samples 10 Hz (Borwin, JMBS Developments, Le Fontanil, prepared in low-conductivity media. These problems France) and stored in a personal computer. Capil-are mainly due to PEO adsorption on the capillary laries (Polymicro Technologies, Phoenix, AZ, USA) wall and have been partially overcome by using high of 75 mm I.D. and 365 mm O.D. were used for DNA concentrations of TB buffers to fill the capillary and separations without any further coating process. The to prepare PEO solution, and by preparing DNA in a capillary length was 60 cm (50 cm of effective buffer with a suitable conductivity [22,23]. More length).
recently, we have demonstrated the separation of
DNA up to 5 ml, with a sensitivity improvement up 2 .2. Materials to 450-fold, using a 150-mm capillary [24].
chemicals for preparing buffer solutions were from Aldrich (Milwaukee, WI, USA). Ethidium bromide (EtBr) was obtained from Molecular Probes (Eugene, OR, USA). Please note that wearing gloves is required when handling EtBr because it is a highly carcinogenic compound. TB buffers prepared from Tris were adjusted with boric acid to pH 10.0 and 9.0, respectively. Unless otherwise noted, an X mM TB buffer herein means a buffer containing X mM Tris adjusted with suitable amounts of boric acid. Phosphate-buffered saline (PBS), pH 7.4, was pre-pared by dissolving 8.0 g of NaCl, 0.2 g of KH PO ,2 4 0.46 g of Na HPO , and 0.2 g of KCl in 1 l of H O.2 4 2 PEO solutions were prepared in the TB buffers containing 5 mg / ml EtBr. fX174 RF DNA-Hae III digest (500 mg / ml) was purchased from Pharmacia Biotech (Uppsala, Sweden). QIAamp DNA Blood
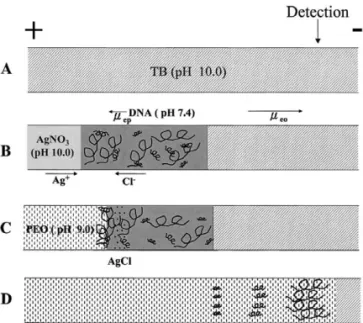
Fig. 1. Schematic of on-line concentration of DNA using PEO mini kit was purchased from QIAGEN (Hilden,
under discontinuous conditions. (A) Capillary is filled with 400 Germany). PCR kits were obtained from Promega
mM TB, pH 10.0, prior to DNA injection. (B) Discontinuous (Madison, WI, USA). plugs are existent in the capillary after subsequent injections of DNA and a short plug of AgNO . (C) AgCl particles form and3
DNA stacks mainly because of sieving and increases in the 2
.3. Preparation of PEO solutions
viscosity. (D) Separation of the stacked DNA takes place based on the sieving mechanism in CE. meo and mep represent the EOF Certain amounts of PEO were gradually added
mobility and the electrophoretic mobility of the DNA fragments, into the TB buffer, pH 9.0, in a beaker stirring in a respectively.
water bath at 85 to 90 8C. During the addition of PEO, a magnetic stirring rod was used to produce a
well homogeneous suspension. After addition was solutions entered the capillary from the anode end by complete, the suspension was stirred for at least one EOF and acted as sieving matrices. After each run, more hour. Finally, polymer solutions were degassed capillaries were washed with 0.5 M NaOH at 25 with a vacuum system in an ultrasonic tank. Polymer V/ cm for 10 min to remove PEO solutions and solutions stored in a refrigerator at 4 8C were usable refresh the capillary wall. This treatment has been
for at least 3 days. shown useful for reproducibility, with a relative
standard deviation (RSD) of EOF less than 2.0%. 2
.4. Stacking and separation
2
.5. DNA extraction and PCR products New capillaries were treated with 0.5 M NaOH
overnight. Prior to analysis, the base was flushed out The blood sample was from a normal male. with 400 mM TB buffer, pH 10.0, by pressure means Human genomic DNA from buffy coat was extracted for 20 s. DNA samples were injected into the using the QIAamp DNA blood mini kit in accord-capillary filled with 400 mM TB buffers, pH 10.0, by ance with the manufacturer’s instructions. Amplifica-electrokinetic means at 25 or 250 V/ cm for certain tion of the DNA sample was conducted as suggested times (10–120 s). The estimated injection volume by the manufacturer. Briefly, 22.5 ml PCR master was calculated from the injection length and the mix component was prepared by mixing 17.45 ml capillary I.D. [22]. When a short plug of AgNO was3 sterile water, 2.50 ml STR 103 buffer, 2.50 ml TH01 applied after sample injection as shown in Fig. 1, 103 primer pair, and 0.05 ml Taq polymerase (5 electrokinetic injection was carried out at 250 V/ cm U / ml). To the PCR master mix, 2.5 ml of human for 60 s. During the separation at 333 V/ cm, PEO genomic DNA (25 ng) were added. PCR was
conducted as: initial incubation at 96 8C for 2 min; more appropriate [28]. It has been shown that the cycling for the first 10 cycles at 94 8C for 1 min, at adsorption is profound at low ionic strengths and 64 8C for 1 min, and at 70 8C for 1.5 min; and sample matrix plays a crucial role in determining cycling for the last eight or 22 cycles at 90 8C for 1 migration time, resolution, and stacking when inject-min, at 64 8C for 1 inject-min, and at 70 8C for 1.5 min. ing a large volume of DNA [22]. Table 1 shows the results when using a number of TB buffers, pH 7.0 to 11.0, to prepare DNA samples. At the same pH, 3
. Results and discussion migration times became shorter due to reduced PEO adsorption, while resolution decreased with increas-3
.1. Matrix effect ing ionic strength (concentration). In terms of sen-sitivity improvement (injection volume up to about The on-line concentration of DNA in the presence 1.86 ml) and resolution, TB buffers of 5–10 mM, pH of EOF described here is based on the decrease in 10.0 and 11.0, are superior. On the other hand, the the electrophoretic mobility of DNA mainly due to injection volumes were much less when DNA sam-sieving and increases in the viscosity when migrating ples were prepared in TB buffers, pH 7.0, 8.0, and from the sample zone to the polymer solution 9.0 (10 and 25 mM Tris). This indicated the use of [20,22]. It is thus important to select a suitable high amounts of boric acid to prepare DNA samples polymer solution for optimum concentration and is not suitable. The limit of injection volume is also separation. One other critical consideration when due to the small electrophoretic mobility of the DNA applying this method is adsorption of polymer fragments at low pH (or high ionic strength). Please molecules on the capillary wall mainly due to note that the analysis is also not favored at low pH hydrogen bonding and hydrophobic patches, leading because of the relatively low quantum yields of to a small EOF mobility and difficulty of refreshing intercalated DNA fragments at pH 7.0 and 8.0. the capillary wall. In this aspect, use of hydrophilic As the goal of this work aimed to the development polymers such as PEO and hydroxyethylcellulose is of a method allowing sensitivity improvement for the Table 1
Effect of the sample matrix on injection volume, peak height, bandwidth, resolution, and migration time using a 60-cm capillary
a
pH TB Borate V Peak height (mV) Bandwidth (min) Resolution Migration time (min)
(mM) (mM) (ml) 1353b 271b 72b 1353 271 72 1353 / 1078 271 / 281 118 / 72 tc t d td 0 1353 72 7.0 5.0 26.5 0.46 140.5 4.9 2.0 0.02 0.11 0.22 1.84 0.96 12.12 19.51 22.27 31.11 10.0 53.0 0.02 20.1 1.4 1.0 0.03 0.03 0.07 1.22 6.29 62.34 14.12 16.86 24.97 8.0 5.0 9.0 0.62 155.0 3.7 2.7 0.01 0.08 0.08 5.02 6.91 18.24 30.04 32.75 42.24 10.0 18.0 0.15 67.6 1.8 1.7 0.02 0.05 0.06 2.36 6.76 55.17 16.42 19.25 28.06 25.0 45.0 0.05 13.1 1.3 0.7 0.03 0.07 0.09 1.95 5.25 14.37 14.87 17.57 26.15 9.0 5.0 4.1 1.86 574.8 20.1 18.8 0.03 0.02 0.04 4.99 5.40 55.03 70.85 74.35 85.63 10.0 8.2 0.93 859.9 10.0 8.6 0.02 0.07 0.05 3.54 1.90 27.43 56.93 59.83 70.94 25.0 20.5 0.46 151.1 3.9 1.8 0.03 0.11 0.16 1.45 1.09 20.45 24.27 27.67 37.97 10.0 5.0 0.3 1.86 1223.2 21.9 40.3 0.04 0.03 0.04 3.33 3.89 43.27 65.56 66.77 75.12 10.0 0.6 1.86 1224.3 54.5 53.6 0.03 0.02 0.03 2.18 5.44 54.23 50.18 51.30 58.37 25.0 1.5 1.86 1184.7 444.3 48.7 0.04 0.02 0.04 0.96 6.65 56.15 43.03 45.98 56.74 11.0 5.0 0.3 1.86 1203.3 67.8 35.1 0.02 0.04 0.03 3.29 4.35 56.98 63.57 66.16 75.05 10.0 0.6 1.86 1205.5 122.2 40.2 0.02 0.03 0.03 2.78 4.86 53.32 51.22 53.60 60.13 25.0 1.5 1.86 1208.2 523.1 45.4 0.01 0.03 0.05 0.73 8.17 40.62 34.97 37.72 46.38 a
Maximum injection volume.
b
1353, 271, and 72 represent the 1353-, 271-, and 72-bp fragments, respectively.
c
Time when the baseline shifted.
d
analysis of DNA in biological samples without ments in high-conductivity media (the major salt is 2 sample pretreatment, it is required to optimize the NaCl, 138 mM ). To reduce the effect of Cl , we condition for increasing injection volumes at pH 7.4. tested the possibility of forming AgCl particles with
1
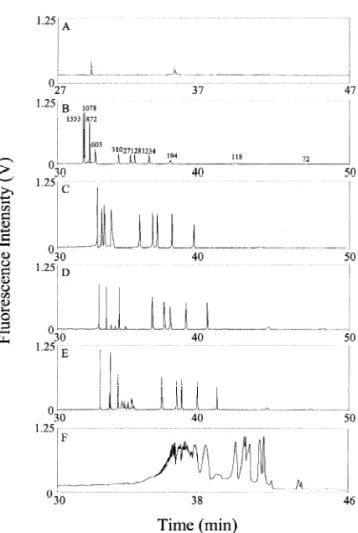
Although Table 1 shows that DNA stacked when Ag inside the capillary during the analysis. This injecting DNA up to 0.46 ml at pH 7.0, the maxi- was done by injecting a short plug (3.25 cm) of mum injection volumes for biological samples AgNO prepared in 25 mM TB, pH 10.0, after DNA3 should be different, depending on matrix. To explore injection. Fig. 2B and C show very impressive the impact of salts on concentration and separation of results, while 2D and E demonstrate less successful-DNA, 5 mM TB buffers, pH 7.4, containing different ly. It is interesting to note that the peak heights for salts, including sodium chloride, sodium phosphate, the 72–310 base pair (bp) fragments increased with and sodium acetate, were tested. Table 2 shows that increasing the concentration of AgNO up to 1 mM,3 the separation became faster with increasing the while some peaks split and declined at greater than concentrations of salts when injecting 0.62 ml DNA. 1 mM. We inferred that the short plug of AgNO3 With increasing the concentration of salts, PEO should play a significant role in affecting stacking adsorption decreased, leading to a greater EOF and resolution. The plug acted as a water plug that mobility. It should be pointed out that higher and has been shown in other studies to increase the sharper peak profiles were achieved at higher con- stacking efficiency [31,32], wherein the velocity of centrations of salts when adding the same species. the DNA fragments accelerated when migrating from This indicated that ITP occurred. In addition, greater the sample zone to the low-conductivity plug. How-quantum yields of intercalated DNA fragments at ever, we have to mention that applying a short plug high salts should be taken into account [29]. How- of water did not work by this method. In addition, ever, peak splitting was problematic when using TB pH changes and sample self stacking may be con-buffers containing 50.0 mM sodium phosphate or tributors [16,30]. It is also very possible that AgCl
1
sodium acetate. To this end, we should point out that particles formed once Ag from the plug interacted 2
the effect of pH changes on the stacking efficiency with Cl from the sample zone, with a support of the should not be ignored [30]. existence of a small, wide and noisy peak after the baseline shifted (not shown). As a result, the DNA 3
.2. Effect of metal ions fragments might interact with AgCl particles, leading to very sharp peaks and enhanced stacking ef-Next, we tested the analysis of 0.75 ml DNA ficiency. At high concentrations, greater amounts of prepared in PBS by this proposed method, with a particles might form and thus interact strongly with disappointing result as shown in Fig. 2A. Possible DNA, which caused peak splitting for the large DNA reasons include a significantly differential conduc- fragments. To support our reasoning, we injected a tivity between the sample zone and PEO as well as short plug of 0.5 mM NaNO3 at concentrations small electrophoretic mobilities of the DNA frag- ranging 0–2 mM instead of AgNO . In the range of3 Table 2
Effect of salts on peak height, bandwidth, resolution, and migration time using a 60-cm capillary
Peak height (mV) Bandwidth (min) Resolution Resolution
1353 271 72 1353 271 72 1353 / 1078 271 / 281 118 / 72 t0 t1353 t72 Sodium chloride (mM) 1.0 124.6 8.9 3.3 0.04 0.13 0.22 4.42 1.16 72.18 25.72 28.71 39.48 10.0 335.2 34.1 15.8 0.04 0.06 0.04 1.75 5.41 65.72 22.40 25.50 36.40 50.0 1180.8 386.7 12.7 0.02 0.01 0.05 2.71 11.21 40.54 17.10 22.59 32.35 Sodium phosphate (mM) 1.0 501.7 11.2 4.3 0.02 0.08 0.10 1.57 2.19 27.37 27.08 30.32 42.13 10.0 1229.0 552.5 22.2 0.02 0.02 0.04 4.33 13.73 58.52 24.84 29.52 42.49 Sodium acetate (mM) 1.0 136.2 3.5 1.3 0.04 0.12 0.23 2.51 2.97 68.53 26.99 30.04 41.28 10.0 865.6 226.4 15.0 0.03 0.03 0.04 4.25 6.64 61.88 24.98 28.60 41.17
Fig. 3. Effect of the length and composition of AgNO plug on3
DNA concentration and separation. (A) AgNO3 prepared in 25 mM TB, pH 10.0, was injected at 250 V/ cm for 90 s; (B) AgNO3
prepared in 1.5% PEO dissolved in 200 mM TB, pH 9.0, was injected at 250 V/ cm for 60 s. Other conditions were as in Fig. 2. AgNO prepared in 25 mM TB, pH 10.0. Compared3 to Fig. 1C, Fig. 3A shows that increases in the plug length did not provide better stacking, but caused a longer separation time (64 min). This is because PEO adsorption increased when the low-conductivity plug of AgNO was increased. On the other hand,3 Fig. 2. Effect of the plug composition on DNA stacking at 333
the separation time was shortened to 44 min shown V/ cm using 1.5% PEO solution prepared in 200 mM TB, pH 9.0,
in Fig. 3B when injecting 0.5 mM AgNO prepared3 containing 5 mg / ml EtBr. Capillary: 60 cm of total length, 50 cm
in 1.5% PEO dissolved in 200 mM TB, pH 9.0. The of effective length, 75 mm of inner-diameter, and filled with 400
mM TB, pH 10.0. One mg / ml fX174 RF DNA-Hae III digest result indicates that our first reasoning about the role prepared in PBS was injected at 250 V/ cm for 120 s (0.75 ml). of AgNO plug in increasing injection volumes
3
Plugs of AgNO prepared in 25 mM TB, pH 10.0, were injected at3 addressed above is not the main reason. In
com-250 V/ cm for 60 s after sample injection, with [AgNO ]50 mM3
parison to broad and unresolved peaks obtained in A, 0.1 mM in B, 0.5 mM in C, 1 mM in D, and 2 mM in E. A
without applying such a plug (not shown), the result plug of 0.5 mM NaNO prepared in 25 mM TB, pH 10.0, was3
injected at 250 V/ cm for 60 s after sample injection in F. also shows the important role that AgNO played in3 determining stacking. It is important to emphasize 0–0.5 mM, the sensitivity for small DNA fragments that the peak corresponding to the small DNA increased, while the loss of resolution was proble- fragments were sharper and greater (about 10 times matic. Fig. 2F represents one of the best results using higher for the 72-bp fragments) when compared to NaNO plugs, with broad and unresolved peaks for3 that applying a plug of 0.5 mM AgNO prepared in3 the large DNA fragments that indicate poor stacking. 25 mM TB buffer, pH 10.0. With a faster separation When the concentrations of NaNO3 were further result, this again supports that PEO adsorption is increased from 0.5 to 1.0 mM, the resolution de- more pronounced at low ionic strengths.
creased and only a very broad peak was found at 1.0
mM, again indicating poor stacking. 3 .3. Linearity To further evaluate the effect of AgNO on DNA3
Table 3
Linearity, reproducibility, and efficiency for the analysis of DNA prepared in 50 mM TB, pH 10.0 using an 80-cm capillary DNA (bp) 1353 271 72 a Linear regression y 5 679.85x 1 3.23 y 5 574.26x 1 2.44 y 5 99.34x 1 1.39 2 R 0.997 0.998 0.997 b % RSD (peak height, n 55) 3.6 3.8 2.9 b % RSD (migration time, n 55) 3.4 3.9 3.2 b 6 6 6 Theoretical plates 5.7310 3.1310 1.7310 a
y, peak height (mV); x, injection volume (ml). b
2.58 ml of 1.0 mg / ml fX174 RF DNA-Hae III digest injected.
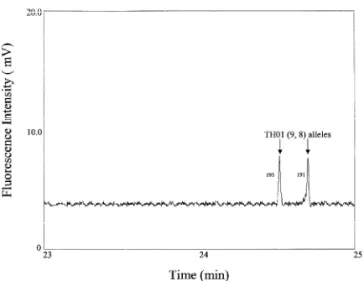
10.0, were electrokinetically injected, the peak height products that were amplified after 18 cycles. Fig. 5 is proportional to the injection volume up to 2.58 ml clearly shows that there are two peaks between 24 as shown in Table 3. For example, linear relation- and 25 min. The RSD values (n 53) for the peak ships between the injection volume and the peak height and migration time for the first one were 3.1 heights corresponding to 1353-, 271-, and 72-bp and 2.2%, respectively. It is important to note that
2
fragments were obtained, with R .0.997. The repro- the PCR cycle performed in this study was much less ducibility of this method was reasonable in terms of than the one (32 cycles) suggested by the manufac-migration time and peak height (RSD,4.0%). The turer. Advantages over greater amplification cycles fact that the theoretical plates for all the DNA include a shorter analysis time (PCR, concentration fragments were greater than 1 million while injecting and separation), shortening from 122.7 min to 92.5 2.58 ml DNA further suggests that all DNA stacked min, less costs (less consumption of primer, tem-without significant loss of the separation efficiency. plate, and other reagents), and a low risk of con-On the basis of the peak height corresponding to the taminants [33,34]. To identify the two peaks shown 72-bp fragment, the limit of detection (LOD) at a in Fig. 5, we spiked fX174 RF DNA-Hae III digest signal-to-noise ratio (S /N ) 5 3 for the DNA sample into the PCR product and performed the analysis was 0.171 ng / ml. This was about an 860-fold (result not shown). Comparing the migration times sensitivity improvement compared to that by a for these two peaks to that for 234- and 194-bp conventional injection (10-s injection). However the fragments from the standard, we assigned these two analysis was slow (about 140 min). Fig. 4 depicts
linearity between the peak height and the injection volume when injecting 0.5 mM AgNO at 250 V/ cm3 for 60 s after injection of DNA prepared in PBS.
2
Linearity with R . 0.97 was obtained for the 1353-, 271-, and 72-bp fragments, over the volume range of 0–0.75 ml. As 0.75 ml DNA was injected, the LOD was 6.86 ng / ml on the basis of the peak height corresponding to the 72-bp fragment. This was about a 155-fold sensitivity improvement compared to that by a conventional injection.
3
.4. Stacking of PCR products
To show the feasibility of this method with a short
plug of AgNO3 for the analysis of real biological Fig. 4. Linearity between peak height and injection volume. samples, we injected and separated 0.75-ml PCR Conditions were as in Fig. 3B.
A
cknowledgements
This work was supported by the National Science Council of Taiwan under contract number NSC 90-2113-M002-058.
R
eferences
[1] D. Liang, L. Song, Z. Chen, B. Chu, Electrophoresis 22 (2001) 1997.
[2] C. Gelfi, A. Orsi, F. Leoncini, P.G. Righetti, J. Chromatogr. A 689 (1995) 97.
[3] M. Chiari, S. Riva, A. Gelain, A. Vitale, E. Turati, J. Chromatogr. A 781 (1997) 347.
Fig. 5. Separation of 0.75-ml PCR products amplified after 18
[4] Y. Liu, W.G. Kuhr, Anal. Chem. 71 (1999) 1668. cycles at 333 V/ cm using 1.5% PEO prepared in 200 mM TB
[5] S.E. Moring, R.T. Reel, R.E.J. van Soest, Anal. Chem. 65 solution, pH 9.0. Other conditions were as in Fig. 3B.
(1993) 3454.
[6] R.O. Cole, D.L. Hiller, C.A. Chwojdak, M.J. Sepaniak, J. Chromatogr. A 736 (1996) 239.
peaks to TH01 (9, 8) allele, with 195- and 191-bp [7] X.-C. Li-Sucholeiki, W.G. Thilly, Nucl. Acids Res. 28 (2000)
fragments, respectively. 44.
´
[8] V. Dolnık, J. Biochem. Biophys. Methods 41 (1999) 103. [9] E. Carrilho, Electrophoresis 21 (2000) 55.
[10] A. Hanning, P. Lindberg, J. Westberg, J. Roeraade, Anal. Chem. 72 (2000) 3423.
4
. Conclusions [11] A. Zimran, C. Glass, V.S. Thorpe, E. Beutler, Nucl. Acids Res. 17 (1989) 7538.
¨ ¨ ¨
[12] S. Auriola, I. Jaaskelainen, M. Regina, A. Urtti, Anal. Chem. We have found that matrices containing suitable
68 (1996) 3907. amounts of salts like NaCl are essential for
large-[13] I. Barme, G.J.M. Bruin, A. Paulus, M. Ehrat, Electrophoresis volume injection and rapid analysis, due in part to
19 (1998) 1445.
reduced PEO adsorption. Salts not only affect res- [14] R.-L. Chien, D.S. Burgi, Anal. Chem. 64 (1992) 1046. olution, peak asymmetry, migration time, and stack- [15] R.-L. Chien, D.S. Burgi, J. Chromatogr. 559 (1991) 141. ing efficiency, but also affect the interactions with [16] J.L. Beckers, P. Bocek, Electrophoresis 21 (2000) 2747.ˇ
[17] G. Hempel, Electrophoresis 21 (2000) 691. the capillary wall and the fluorescence characteristics
[18] D.M. Osbourn, D.J. Weiss, C.E. Lunte, Electrophoresis 21 of intercalated DNA fragments. However, large
(2000) 2768. amounts of salts would cause small electrophoretic
[19] Y. Xiong, S.-R. Park, H. Swerdlow, Anal. Chem. 70 (1998) mobilities of the DNA fragments migrating from the 3605.
sample zone to PEO solution and peak splitting, [20] M.-M. Hsieh, W.-L. Tseng, H.-T. Chang, Electrophoresis 21 (2000) 2904.
thereby limiting the injection volume. These
prob-[21] W.-L. Tseng, H.-T. Chang, Anal. Chem. 72 (2000) 4805. lems have been partially solved by injection of a
[22] W.-L. Tseng, M.-M. Hsieh, S.-J. Wang, C.-C. Huang, Y.-C. short plug of AgNO3 after sample injection. As a Lin, P.-L. Chang, H.-T. Chang, J. Chromatogr. A 927 (2001) result, it allows the analysis of up to 0.75-ml DNA 179.
samples prepared in PBS or PCR products without [23] W.-L. Tseng, M.-M. Hsieh, S.-J. Wang, H.-T. Chang, J. desalting. The results have proved this method Chromatogr. A 894 (2000) 219.
[24] C.-C. Huang, M.-M. Hsieh, T.-C. Chiu, Y.-C. Lin, H.-T. provides the advantages of simplicity, robustness,
Chang, Electrophoresis 22 (2001) 4328. reproducibility, and rapidity. Together with a
155-[25] R.-L. Chien, D.S. Burgi, J. Chromatogr. 559 (1991) 153. fold improvement in the sensitivity, this method is [26] M. Albert, L. Debusschere, C. Demesmay, J.L. Rocca, J. quite promising for analysis and / or recovery of gene Chromatogr. A 757 (1997) 281.
[28] M.-F. Huang, C.-E. Hsu, W.-L. Tseng, Y.-C. Lin, H.-T. [31] R.-L. Chien, D.S. Burgi, Anal. Chem. 64 (1992) 489A. Chang, Electrophoresis 22 (2001) 2281. [32] C.-X. Zhang, W. Thormann, Anal. Chem. 68 (1996) 2523.
¨
[29] M.O. Khan, S.M. Mel’nikov, B. Jonsson, Macromolecules [33] G. Lisby, in: S.J. Meltzer (Ed.), PCR in Bioanalysis,
32 (1999) 8836. Humana Press, New Jersey, 1998, p. 1.
[30] P. Britz-Mckibbin, G.M. Bebault, D.D.Y. Chen, Anal. Chem. [34] M.J. McPherson, S.G. Møller, in: PCR, Springer-Verlag,