Corporate Governance and Financial Distress:
Evidence from Taiwan
Tsun-Siou Lee
Department of Finance, National Taiwan University Tel.: +886-2-2363-0231 ext.2963
Fax: +886-2-2363-3269.
Email address: [email protected]
Yin-Hua Yeh
Corresponding author
Department of International Trade and Finance Fu-Jen Catholic University,
510, Chung Cheng Rd, Hsin-Chuang, Taipei, 242 Taiwan. Tel: +886-2-2903-1111 ext.2725
Fax: +886-2-2901-9779
Corporate Governance and Financial Distress:
Evidence from Taiwan
Abstract
Prior empirical evidence supports the wealth expropriation hypothesis that the controlling shareholder(s) tend to expropriate minority interests, which in turn reduces corporate value. However, it is still unclear whether corporate financial distress is related to this type of expropriative behavior. To answer this question, we adopt three variables to proxy for the risk of expropriation by the controlling shareholder, namely, the percentage of directors occupied by the controlling shareholder, the percentage the controlling shareholders shareholding pledged for bank loans(pledge ratio), and the deviation of control away from cash follow rights. Binary logistic regressions are then fitted to generate dichotomous prediction models. Taiwanese listed firms, characterized by a high degree of ownership concentration similar to that in most countries, are used as our empirical samples. The evidence suggests that the three variables mentioned above are positively related to the risk of financial distress, even after controlling for the possible influence of financial performance. It is also found that corporate governance deteriorates a year before the financial distress occurs. Generally speaking, firms with weak corporate governance are vulnerable to economic downturns and the probability of falling into financial distress increases when corporate governance deteriorates. An immediate implication follows that any early warning system cannot be complete without incorporating corporate governance variables.
I.
Introduction
Why do companies fall into financial distress or even go bankruptcy? Can we develop an early warning system that is powerful in predicting corporate financial distress? There are ample researches trying to develop early warning systems based on financial statements and other related information. However, financial reports are ex post in nature, and they also tend to be window dressed through earnings management1, we may need to turn to other sources of ex ante information for prediction purposes.
Corporate governance has been regarded as one of the key factors that caused the Asian financial crisis in 1997. Both Rajan and Zingales (1998) and Prowse (1998) concluded that ownership concentration and ineffective corporate governance were two important factors leading to the Crisis. Johnson, Boone, Breach and Fried an (2000) further documented that ? corporate governance variables provide better explanatory power for the Crisis than macroeconomic variables. They also pointed out that poor economic prospects made agency problems even worse, which in turn caused the stock market crashes and currency depreciation, especially in countries with weak corporate governance. However, using a whole country as an empirical sample may miss important information related to individual firms. For example, even in countries that suffered from the financial crisis, we may still see healthy firms running their business as usual. Thus analyzing individual firms becomes essential when investigating corporate governance and financial distress.
La Porta, Lopez-de-Silanes and Shleifer (1999), Claessens, Djankov and Lang (2000), and Faccio and Lang (2000) empirically determined that on average, more than 60% of public traded companies around the world have an ultimate owner except in the US, UK and Japan2.
1
Schipper (1989), Healy and Wahlen (1999) and Dechow and Skinner (2000) provide excellent discussions on the topic of earnings management.
2
Moreover, most of the companies with ultimate owners are family-controlled. Based on Yeh, Lee and Woidtke (2001), Taiwanese listed companies are characterized as mostly family controlled with a high degree of ownership concentration that is similar to the findings of the above studies. Hence, taking Taiwanese listed companies as empirical samples may generate interesting empirical findings about the relationship between corporate governance and financial distress.
Under concentrated ownership environment, it is important to provide enough financial incentives for the controlling shareholder in order to reduce expropriation. Cash flow ownership of the controlling shareholder is an important source of such incentives. “In general, expropriation is costly (Burkart et al. 1998), therefore higher cash flow ownership should lead to lower expropriation, other things equal.” (La Porta, Lopez-de-Silanes, Shleifer and Vishny, 2002). La Porta et al. (2002) also provided evidence supporting the positive incentive effect of cash flow ownership by a controlling shareholder on the valuation of firm3. Concentrated ownership has its costs as well. The most significant cost lies in the fundamental conflicts of interests between majority and minority shareholders. The derived agency problem is the expropriation of minority interests by the controlling shareholders. La Porta et al. (1999), Claessens, Djankov and Lang (2000) and Faccio and Lang (2000) found that the controlling shareholders of publicly traded companies in most countries typically have voting rights significantly in excess of their cash flow rights. The larger the deviation between voting and cash flow rights, the stronger the ultimate owners’ incentive to expropriate minority interests. More voting rights facilitate the owners with more power for
Please refer to the next section for further discussions. 3
The greater the concentration of cash flow rights in the hands of the largest block-holder, the greater, on one hand, is his incentive to have the firm run properly, as it would directly raise his own wealth, and the lower, on the other hand, is his motivate to reduce the value of the firm by extracting private benefits. Both effects should lead to a positive relationship between firm values and the largest shareholder's ownership rights.
wealth expropriation, while less cash flow rights reduce the owners’ share of losses from the expropriation of wealth (Claessens, Djankov, Fan and Lang, 2002; Fan and Wong, 2002). Although empirical results support that the threats of expropriation by the controlling shareholder tend to reduce corporate value4, whether it will lead to a higher probability of financial distress remains an open question. Financial distress may lead to bankruptcy, liquidation or significant changes in control that may truncate the stream of expected rents from expropriation.
Expropriation may be realized through various ways of embezzlement and resource transfers to the benefit of the controlling shareholder, as reported by La Porta, Lopez-de-Silanes, Shleifer and Vishny (2000) and Johnson et al. (2000). Misconduct on the controlling shareholder's part further worsens the firm's financial performance and hurt the firm's competitiveness. In the wake of an economic recession or severe competition, these firms tend to become the victims of financial distress. Moreover, the ultimate owner may use corporate funds for stock churning and fail to recover the funds if the stock market turns bearish. The firm in turn falls into liquidity difficulty followed by financial distress. However, a controlling insider may desire to go on expropriating wealth for a very long time. For example, Claessens, Djankov, and Klapper (1999) found that East Asian firms controlled by management/family groups were less likely to file for bankruptcy during the crisis. They argued that this insurance against bankruptcy may come at expense of minority shareholders. If so, expropriating insiders and weak governance should be associated with a smaller probability of financial distress. Therefore, we need to consider both the cost and benefit for the controlling shareholder to file bankruptcy in developing our empirical model.
4
Claessens et al. (2002), La Porta et al. (2002), and Lemmon and Lins (2001) examined the relationship between firm value, the ownership structure and the strength of legal institutions. Collectively, these studies found that firm value is positively related to investor protection measures and to the cash flow rights held by the
In order to measure the corporate governance mechanism, we adopt the deviations of control rights from cash flow rights as a measure of the possibility of wealth expropriation. In other words, the smaller the ratio of cash flow rights to control rights (voting rights), the higher the tendency of the controlling shareholder to expropriate minority wealth. In addition to the ownership structure, Yeh, Lee and Woidtke (2001) also pointed out a negative association between corporate financial performance and the percentage of board seats occupied by the controlling family. Thus, board composition also serves as a proxy for wealth expropriation. Finally, if stock churning were the reason for embezzlement5, then it is reasonable to suspect more serious wealth expropriation to be associated with a higher percentage of shares pledged for funds from financial institutions by the controlling shareholders. A higher percentage of shares pledged probably represents a difficult financial position for the controlling shareholders, and their tendency of illegally using corporate funds for stock price support scheme.
The purpose of this study is threefold: (1) to examine the possible connection between corporate governance and financial distress by incorporating both corporate governance
controlling shareholder, and negatively related to the deviation of control from cash flow rights. 5
We have seen more than thirty Taiwanese listed companies that experienced financial distress in 1998 and 1999. The controlling shareholders of these companies were accused of over-leveraging and over-investment in the stock market. It was not uncommon for these firms to set up wholly owned subsidiaries to buy back the shares of the parent companies to strengthen their controlling power (treasury shares buyback was not legalized until the end of June 2000). To amplify the effect of such operations, the controlling shareholders may further pledge the common stocks they control (including shares owned by the wholly-owned subsidiaries) to financial institutions and obtain extra funds to repeat similar buy back operations. If stock price goes up, the profits go into their own pockets. If the stock price turns down, they tend to embezzle more corporate funds to support the stock price for the fear of a stop-loss sale of the pledge shares by the financial institutions. The companies in turn suffer from additional loss through an extended bearish market. Financial distress seems to be an inevitable consequence for these companies.
variables and financial variables into the model; (2) to investigate the predictability of corporate governance models for financial distress; and (3) to compare the prediction power of the corporate governance models among various subsamples classified by financial performances. For the second purpose, our samples were classified into the estimated samples and the holdout samples. The prediction model was constructed with the estimated samples while the prediction power was calculated using the holdout samples.
The empirical evidence supports the prediction that corporate governance variables have significant impacts on the risk of financial distress and the impacts remain significant even after controlling for the corporate financial performances. The more directors occupied by the controlling shareholder, the higher their stock pledge ratio, and the higher degree of control-cashflow rights deviations, the higher probability of financial distress will be. In addition, we also found that corporate governance deteriorates significantly the year before financial distress occurs. For the holdout samples, the average predicted probability of falling into financial distress for firms that really fall into one is 63.09%, while the average predicted probability is only 23.68% for firms that do not experience financial distress. The implication and hence the contribution of our research lies in the inclusion of the corporate governance risk on top of the traditional operating risk and financial risk when evaluating the risk of financial distress.
We suggest two factors that lead to our empirical findings. Firstly, our sample covers the period of the Asian Financial Crisis and the following economic recession. Companies with weak corporate governance might have lost more competitiveness than otherwise would have been, and hence are more vulnerable to financial distress. The controlling shareholders might have even embezzled the residual value of firms before they filed bankruptcy. It would speed up the occurrence of the financial distress. Secondly, the Bankruptcy Law of Taiwan does not require the removal of the controlling shareholders. In contrast, we often see changes in
control after bankruptcy and reorganization in the United States. (Gilson, 1989; Gilson, 1990; Gilson, John, and Lang, 1990; Gilson and Vetsuypens, 1993). The particular legal environment in effect decreases the incentive for the controlling shareholders to prevent the financial distress.
II. Literature Review
A. Concentrated ownership and wealth expropriation
The concept of ultimate control was adopted by La Porta et al. (1999) in analyzing the
corporate ownership structure of 27 rich nations and by Claessens et al. (2000) and Faccio and Lang (2000) in an investigation into similar subjects from nine East Asian and five Western European nations, respectively. They determined the degree of ultimate control by tracing the chain of ownership and identifying the individuals or institutionals with the most voting rights.
Lo Porta et al. (1999) documented that 63.52% of their large sample firms and 76.30% of their medium-sized sample firms have an ultimate controller, when 20% of the voting rights is used as the cutoff point. Similarly, Claessens et al. (2000) found the existence of an ultimate controller in 57.11% of 2980 East Asian companies. When Japanese firms are excluded, the percentage of firms with an ultimate controller increases to 83.39%. Western European companies are not much different; an ultimate controller was found in 61.66% of these firms by Faccio and Lang (2000). The percentage could be as high as 83.64% if British firms are discarded. These researches point to one important phenomenon, i.e., the ownership structure of companies all over the world is highly concentrated except in the United States, the United Kingdom and Japan6.
6
La Porta et al. (1999) found that only 20% of large firms and 10% of medium-sized firms have ultimate controllers in USA. The percentage for Japanese firms and British firms are 20.2% and 31.99%, respectively, as
However, concentrated ownership can do harm to corporate value. Shleifer and Vishny (1997) argued that as ownership exceeds a certain point, the large owners tend to use firms to generate private benefits that are not shared by the minority shareholders, or even at the expense of the minority shareholders. La Porta et al. (2000) supported this argument. The conflicts of interest between large and small shareholders can be numerous. For example, the controlling shareholders may enrich themselves by not paying out dividends. They may also transfer profits to other business entities they control, steal corporate assets outright, or sell corporate assets to other firms they control at below market prices. In addition, expropriation may go further through (1) diverting business opportunities to other firms where the controlling shareholders can derive better private benefits, (2) installing unqualified family members in managerial positions, or (3) overpaying executives.
Johnson et al. (2000) also observed certain cases of expropriation during the Asian Financial Crisis. They concluded that in most of these cases, management was able to transfer cash and other assets out of a company with outside investors, perhaps to pay the management’s personal debts, to shore up another company with different shareholders, or to go straight into a foreign bank account. The fact that the controlling shareholders in most emerging markets also occupy top management positions paves an easy way to achieve these types of expropriation transfers.
Other literature documented that similar wealth expropriation exists in Sweden (Bergstron and Rydquist, 1990), the U.S. (Barclay and Holderness, 1989), Italy (Zingales, 1994) and Taiwan (Yeh, Chiu and Ho, 1997). Claessens et al. (2002) and Lemmon and Lins (2001) concluded that the risk of expropriation is a major principal-agent problem for large corporations both before and during the Asian financial crisis.
B. Financial distress
Most prior distress studies had used legal bankruptcy as the response variable for economic financial distress (e.g., Altman, 1968; Ohlson, 1980; Casey and Bartczak, 1984; Gentry et al., 1987; Aziz and Lawson, 1989). When testing the usefulness of accounting information, they, however, suffered from criticism of the validity of bankruptcy as a measure of financial distress (Delaney, 1991; Bahnson and Bartley, 1992). According to Delaney (1991), legal recognition of bankruptcy can occur even though a company is economically solvent. Consequently, using a legal event such as bankruptcy to develop statistical models to test the predicting power of competing accounting information may produce results not consistent with the economic reality and lead to improper conclusions. Ward and Foster (1997) suggested that a loan default/accommodation response measure may be a more valid response measure than bankruptcy for determining information useful to lenders in predicting future insolvency of a firm (inability) to pay its' obligations. They suggested a sampling of both loan default/accommodation and bankrupt firms to generate financial distress prediction models. Existing literatures have relied on financial accounting data in predicting financial distress. Chen and Church (1992) and Foster et al. (1998), on the other hand, incorporated auditor’s going-concern opinions. By far, only Johnson et al. (2000) and Claessens et al. (1999) emphasized corporate governance variables in explaining why financial distress occurred in Southeast Asian countries in 1997-1998. Johnson et al. (2000) presented evidence that the weakness of legal institutions for corporate governance had an important impact on the extent of the currency depreciation and stock market declines in the Asian financial crisis. The legal institutions for corporate governance are measured by the index of legal protection developed by La Porta (1998). They conclude that if expropriation by managers increases when the expected rate of return on investment falls, an adverse shock to investor confidence will lead to increased expropriation as well as lower capital inflow and greater attempted
capital outflow for a country. These, in turn, will translate into lower stock prices and a weaker exchange rate. In addition, Claessens et al. (1999) observed from East Asia tha t bank-relationships provide insurance against insolvency and bankruptcy during bad times, at the cost of increased cost of capital during good times. They also showed the importance of legal origins: Filings are more likely in countries with German-oriented systems, which have stronger contractability and creditors rights, and less likely in French-origin systems, which have weaker creditor rights.
III. Corporate Governance in Taiwan
A. The ultimate control of Taiwan listed firms
The ownership of publicly traded companies is largely concentrated in the hands of
families in most countries. For example, according to La Porta et al. (1999), 30% (45%) of large (medium size) companies are controlled by families. In addition, Claessens et al. (2000) found that 38.29% of the firms in nine East Asian countries are family controlled. The percentage is even higher (58.68%) if Japanese companies are excluded. Take Faccio and Lang (2000) for another example, they found that 43.88% of the firms in five west European countries are family controlled. If UK samples are excluded, then 61.06% of the firms may be characterized as family controlled. For Taiwanese listed companies, Yeh, Lee and Woidtke (2001) reported a percentage of 51.44% for family controlled firms under a 20% cutoff scheme. They also found that the largest shareholders, on average, hold 27.43% of the voting rights, higher than 19.77% reported by Claessens et al. (2000) for nine East Asian countries. Hence Taiwan is quite typical with high percentage of family-controlled companies. Empirical results based on the Taiwanese data may shed some light on the behavior of family-controlled firms.
B. Anti-director rights
The index of anti-director rights constructed by La Porta et al. (1998) basically aggregates the shareholders rights. Specifically, it is formed by adding one when (1) the country allows shareholders to mail their proxy vote to the firm, (2) shareholders are not required to deposit their shares prior to the general shareholders’ meeting, (3) cumulative voting or proportional representation of minorities in the board of directors is allowed, (4) an oppressed minority mechanism is in place, (5) the minimum percentage of share capital that entitles a shareholder to call for an extraordinary shareholders’ meeting is less than or equal to 1.0%, or (6) shareholders have preemptive rights that can be waived only by a shareholders’ vote. The anti-director rights index ranges from zero to six. Items (3), (4) and (5) pretty much describe the current situation in Taiwan, which gives an anti-director rights index of three to Taiwan, comparable to the average score of the 49 countries studied by La Porta et al. (1998).
C. The board of directors and supervisors
The Taiwanese corporate governance structure includes shareholders’ meetings, the board of directors and supervisors. The major function of the shareholders’ meeting is to elect directors and supervisors. The Taiwanese board of directors differs from an U.S. board. It is the Chinese version of the German managing board. All of the board members are, by design, involved in managing the company. Supervisors are the agents made designated to monitor the board of directors. They are responsible for scrutinizing the decisions made by the board of directors, reviewing and auditing the reports provided by the directors to the shareholders, and resolving any dispute between the shareholders and directors. The monitoring role of the supervisors was apparently adopted from the German system. However, unlike the German two-tier board, the Taiwanese system does not have an independent supervisory board that is
independent from and superior to the managing board. In contrast, the Taiwanese system stipulates that both supervisors and directors are to be elected by shareholders and only the current shareholders are qualified candidates. Note that the designated function of Taiwanese directors is similar to that of the U.S. inside directors, and the designated function of Taiwanese supervisors is like that of the U.S. outside directors. While the Corporation Law stipulates that no current employees or directors can serve as supervisors, it does not prohibit family members of current employees and directors from serving as supervisors (Her and Mahajan, 2000).
In addition, the Corporation Law of Taiwan allows institutional shareholders to send representatives to the board of directors and supervisors. This makes room for the controlling family to set up nominal investment companies as a vehicle of shareholding. In effect, their controlling powers are strengthened through sending family members or persons they trust to the board of directors and supervisors once the nominal investment companies or other legal entities are elected.
Recent researches found certain changes in the structure of the board of directors and supervisors in Taiwanese listed companies. For example, Hsu (1997) indicated that, for Taiwanese business firms, the power of familism (family members as board members and top managers) has been gradually decreasing, while professionalism (professional managers serving as board members and senior managers) has been on the rise. Semkow (1994) analyzed that non-family individuals with professional training are taking senior management positions and becoming board members because of their demonstration of traditional “structural family” characteristics, such as trust, loyalty, and predictability, which are assumed to be inherent in a family based on blood and marriage ties. Consequently, non-family members who exhibit these important “structural family” characteristics may become part of the inner circle even when they are not otherwise expected to be.
Yeh, Lee and Woidtke (2001) examined the monitoring and managerial effectiveness of the board of Taiwanese listed companies under family control. Aside from the controlling family, the board may include directors from the second largest family and/or institutional shareholders. In some cases, the controlling family may even appoint non-family members, such as professional managers, as directors to enhance the effectiveness of the board. Both alternatives are believed to be feasible in deterring the intention of the controlling family from expropriating minority interests. Their findings suggest that corporate performa nce is better when non-family members hold half of the board seats. This also indicates that the acceptance of professionalism and the inclusion of non-family members on the board provide a positive mechanism for corporate governance for Taiwanese listed companies.
IV. The Methodology
A. The sample
We collected data from Taiwan listed companies that encountered financial distress
between January 1996 and December 1999, together with a matching sample consisting of healthy companies. Financial distress includes two definitions. The first one is defaults on loan principal / interest payments, renegotiations of loan terms that extend cash payment schedules, and renegotiations of principal and interest payments for reduction. Second, when the networth of a company falls below half of its capital stock, it is required by the Taiwan Stock Exchange to reclassify its stock trading to the 100% margin. Article 211 of the Corporation Law also specifies a loss of more than half of the capital stock to be one of the conditions for bankruptcy. Thus companies that are traded at 100% margin were also included in the sample of financially distressed firms. Based on the monthly reports from the Taiwan Stock Exchange, 45 companies were listed in our financial distress sample.
The matching samples were chosen on a two-to-one basis7. They consist of firms that are in the same industry and of comparable size, but did not go into financial distress during the sampling period8. The sampling technique employed helps to control the influences of industry and size factors on financial distress. 88 firms were chosen as our matching sample9. During the sampling period, 421firms were traded on the Taiwan Stock Exchange on average. Our matching sample represents 23.4% of the population of healthy firms (88 out of 376). The average voting rights (control rights) of the largest shareholders and the average percentage of board seats held by the controlling shareholders were similar to those found by Yeh, Lee and Woidtke (2001). In our matching sample, the controlling shareholders, on average, owned 27.72% of the voting rights. Family members occupied 59.98% of the board seats. These numbers are comparable to those reported by Yeh, Lee and Woidtke (2001) in which 53.21% of the board members belonged to the controlling families who controlled 26.02% of the voting rights for Taiwanese listed firms in 1995 and 1996. The ownership structure and board composition of our matching sample represents the population well. For prediction purposes, the first two thirds of our sample (which include 30 distressed firms and 58 healthy matching firms) was designated as the estimated sample. The remaining third (which included 15 distressed firms and 30 healthy matching firms), or the holdout samples were reserved to validate the statistical results generated from the estimated sample. The parameter estimates for the models generated from the estimated sample were applied to
7
Most prior researchers took equal numbers of samples for both groups. Beaver (1966), Altman (1968), Blume (1974), Norton and Smith (1979) and Zavgren (1982) are a few typical examples.
8
Listed Firms in each of the 19 industries defined by the Taiwan Stock Exchange were ranked according to their total assets at the end of the year prior to the year of financial distress. Firms that belonged to the same industry and were closest in ranking in total assets were chosen as the matching samples.
9
The auto-making industry had only seven listed companies, of which three were classified in the financial distress sample. Only four matching samples were available, making the size of the matching sample only 88.
the holdout samples. The probabilities for financial distress were generated from each logistic regression models’ parameters to classify the firms.
B. Logistic regression
Binary logistical regression is applied to generate the dichotomous prediction models. Binary logic is appropriate because logistical regression provides significance tests on the parameter estimates and enables researchers to generate probabilities for financial distress for each firm to examine the classification accuracy. The probabilities for distress can be viewed as estimates of the financial distress risk for each firm. Hosmer and Lemeshow (1989) provided a thorough discussion of binary logistical regression. The financial distress researchers who used binary logistical regression for prediction purposes include Hopwood et al. (1994), Ward et al. (1997), Foster et al. (1998), etc. In our binary logistical regression, the dependent variable took a value of one if the company encountered financial distress, and zero otherwise.
C. The controlling shareholders
We traced the voting rights, cash flow rights and board seats occupied by the largest shareholder for each sample company according to the concept of ultimate control proposed by La Porta et al. (1999). For example, if a company belongs to family controlled, the definition of the largest shareholder included those with blood and marriage ties to the immediate family and all of the legal entities controlled by those family members10. Their individual voting rights were added up to arrive at the total family voting rights. In the majority of cases, the immediate shareholders of a corporation are themselves corporate
10
Immediate family of a person refers to his spouse, parents, children, siblings, mother-in-law, father-in-law, sons and daughters-in-law, brothers and sisters-in-law.
entities, or investment companies and other legal entities (ex: non-for-profit foundations). We then identify their owners, the owners of their owners, etc. We use the total ownership by each family group, defined as a group of people related through blood or marriage, as the unit of analysis. The number of board seats occupied by the family was computed in a similar fashion. If the controlling shareholder happens to be the government, then the delegates appointed by the government to the board of the directors are regarded as affiliates of the controlling shareholder.
To calculate the control (voting) rights and cash flow ownership owned by the largest shareholder of Taiwanese listed companies, company prospects are the source of more complete data. Company prospects not only disclose the names and immediate shareholding of the largest 10 or 20 shareholders, but also show the composition of directors and supervisors, major management team, and related parties transaction to help comprehending these shareholders' kin of family and business groupings. We supplement the above information with "Business Groups in Taiwan" published by China Credit Information Services LTD, a databank company that has been in business for more than three decades. "Business Groups in Taiwan" provides the group-affiliation information and family ties to assist us to trace ultimate ownership, pyramid structure and cross-shareholding in group-affiliated companies.
D. Operating variables related to ownership structure
1. Control rights and cash flow rights
We defined two types of control rights as La Porta et al. (1999), i.e., direct control versus indirect control. Direct control is defined as the voting rights embedded in the shares registered in the names of the largest shareholders. Indirect control on the other hand, refers
to the voting rights generated from the shares held by entities that are in turn controlled by the largest shareholder. We follow the mentioned of Claessens et al. (2002), “suppose that a family owns 11% of the stock of publicly traded Firm A, which in turn has 21% of the stock of Firm B. The same family owns 25% of Firm C, which in turn has 7% of the stock of Firm B. Look at the control rights, we would say that the family controls 18% of Firm B, or the sum of the weakest links in the chains of voting rights. In contrast, we would say that the family owns about 3.5% of the cash flow rights of Firm B, or the sum of the products of the ownership stakes along two chains.” We make the distinction between cash flow and voting rights by using for each firm information on pyramid structure and cross-shareholdings among firms.
When calculating the voting rights along with the control chains, the mini mum shareholding for each chain is selected and added up over all chains to arrive at the voting rights of the controlling shareholder. The cash flow right along each chain is simply the product of successive ownership. Finally, the total cash flow rights of the controlling shareholder is the sum of the cash flow rights of all chains11.
2. Stock pledge ratio
Directors, supervisors, managers and large shareholders (who owns 10% or more of a company’s outstanding shares) of public companies are obliged to report to the Securities and Futures Commission (SFC) the percentage of their shareholdings that are pledged for loans and credits. These data matter since pledging for loans effectively reduces the
11
It is very common to find nominal investment companies serving on the board of directors and supervisors (by sending representatives on their behalf) of listed companies. We trace back to see whether controlling theses nominal investment companies when computing the indirect voting rights control the shares of these nominal investment companies. However, because these nominal companies are not public companies, information about their ownership structure is not available. The cash flow rights of the controlling family of the listed companies are therefore calculated assuming that the controlling shareholders indirectly control the nominal investment companies and other entities. This means that the controlling shareholders do control those companies through a pyramid structure or cross shareholding without paying any capital.
personal funds required for shareholding. In other words, the degree of personal leverage expands and then the over-investments to the stock market of the largest shareholder also undertake the risk of the companies to a certain degree. Corporate governance may therefore be weakened, which in turn increases the probability for financial distress. 3. Adjusted control rights
Adjusted control rights, defined as the product of control rights and the one minus pledge ratio, measure the real control rights without leveraging at the personal level.
4. The shareholding of the second largest shareholder and institutional shareholders
The second largest shareholder may be another family member, government or other legal entity. Institutional shareholders include financial institutions, mutual funds, foreign institutions or other institutions not controlled by the largest and the second largest shareholder.
E. Operating variables related to board composition
1. The ratio of board seats held by the largest shareholders
This is defined as the number of seats on the board (directors and supervisors) that are held by the largest shareholder as a percentage of the total number of board seats. This variable is a measure of the degree of control over the board by the largest shareholder. 2. The ratio of board seats held by non-large shareholders
This is defined as the number of board seats (directors and supervisors) held by persons other than the largest and second largest shareholders. It is designed to measure the independence and managerial effectiveness of the board of directors and supervisors.
3. Management participation
This is a dummy variable that takes the value of one if the controlling shareholder (including its members) also serves as the chairman and CEO of the company, and takes the
value of zero, otherwise. When the members of the controlling shareholder takes both the positions of chairman of the board and CEO, the corporate governance mechanism is doomed to weaken if not vanish.
4. Founder participation
If the founder of the company or his descendants is still in control, we assign the value of one to this second dummy variable, and zero, otherwise.
F. Other operation variables
Both McCornell and Muscarella (1985) and Chan, Martin and Kensinger (1990) suggested that the higher the ratio of R&D and advertising expenses to total sales, the higher the value the company may enjoy, and hence the lower the likelihood of financial distress. The degree of financial risk is obviously related to the likelihood of financial distress and it is measured by the debt ratio. Company size, defined as the total market value of shares outstanding at the year-end prior to financial distress, is hypothesized to be negatively related to the likelihood of financial distress. All of these accounting and market data were collected from Taiwan Economic Journal.
V. Empirical Results
A. Basic statistic of the samples
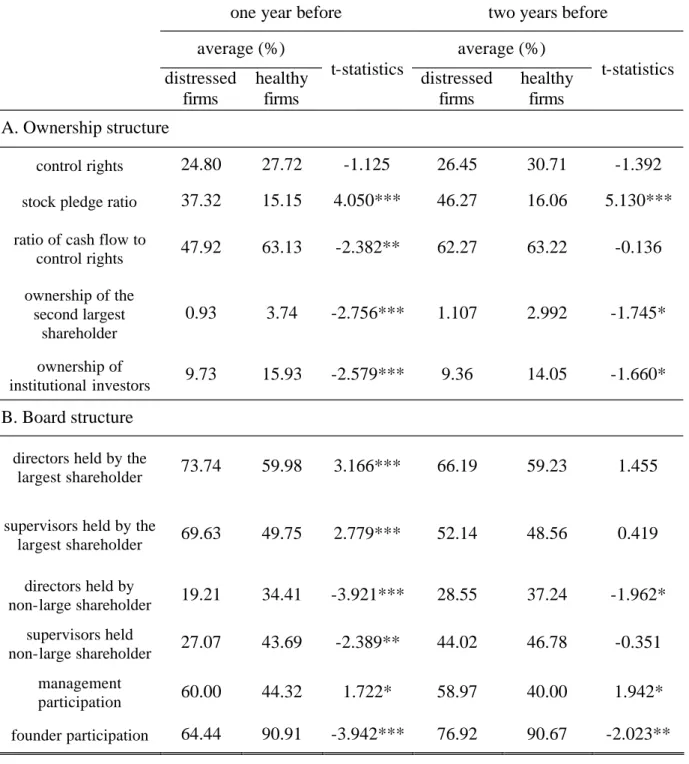
Before conducting detailed analysis, we provide in Table 1 the basic statistics from our samples. The voting rights of the largest shareholders from the financially distressed companies were not significantly different from that of the matching sample in both years prior to the year of the financial distress. However, the average stock pledge ratios of the financially distressed companies were significantly higher than the matching sample in the
two prior years before the financial distress event. This phenomenon provides a rationale for the introduction of a new variable - adjusted control rights, defined as the product of control rights and one minus pledge ratio, to deflate the expanded control rights through leveraging.
Insert Table 1 here
It is noticed that the controlling shareholder increased control rights through cross-shareholding and then sold the ownership under his name the year before the financial distress. It caused the discrepancies between control rights and cash flow rights increased. The ratio of cash flow to control rights dropped from 62.27% to 47.92%. For the two prior years before the financial distress event, both the shareholdings of the second largest shareholder and institutional investors were significantly less than the matching sample.
As to the composition of the board of directors and supervisors, the largest shareholder held a significantly higher percentage of board seats than that in the matching sample the year before the event. On average, the largest shareholder members held 73.74% of the seats of board of directors and 69.63% of the supervisors one-year before the financial distress occurred. These percentages were 7.55% and 17.49% greater than two years before the financial distress. We found that in some financial distressed companies the controlling shareholders re-elected the directors and supervisors at the year before the financial distress event. It increased the family members of controlling shareholder to serve as the directors or supervisors and decreased to support professional managers to serve as the directors correspondingly. On the contrary, we did not find any significant change in the percentage of directors and supervisors held by the controlling family of the companies in the matching sample.
60% of the chairmen and CEO’s of the financially distressed companies were members of the largest shareholder's family a year before the event. This was significantly higher than
that of the matching sample, which was 44.32%. Similar contrasts were found two years prior to the event.
Another interesting finding was that the percentage of firms still controlled by the founders or his descendants was significantly less for the financially distressed firms (64.44%) than for the matching sample (90.91%) in the prior year. Moving one year backwards, this percentage stayed at 76.92% for the financially distressed firms, meaning that 12.48% of the financially distressed firms changed hands less than two years before the disaster.
The percentage of directors held by non-large shareholders (who do not belong to the largest and the second largest shareholders) was only 19.21% the year before the crisis, compared with 34.41% for the healthy companies. For supervisors, the percentage of directors held by non-large shareholders was 27.07% for the crisis companies, again lower than that of healthy firms (43.69%). We also found that non-large shareholder representation among the board of directors and supervisors dropped 9.34% and 16.95%, respectively one year before the crisis for the crisis companies, another phenomenon not found in the matching sample. Summarized from Table 1, we found that in financial distressed companies corporate governance deteriorates a year before financial distress occurs. That is to say the deviation of control from cash flow rights becomes greater and the ratio of controlling shareholders’ members serving as directors or supervisors becomes higher.
B. The effects of ownership structure and board composition on financialdistress
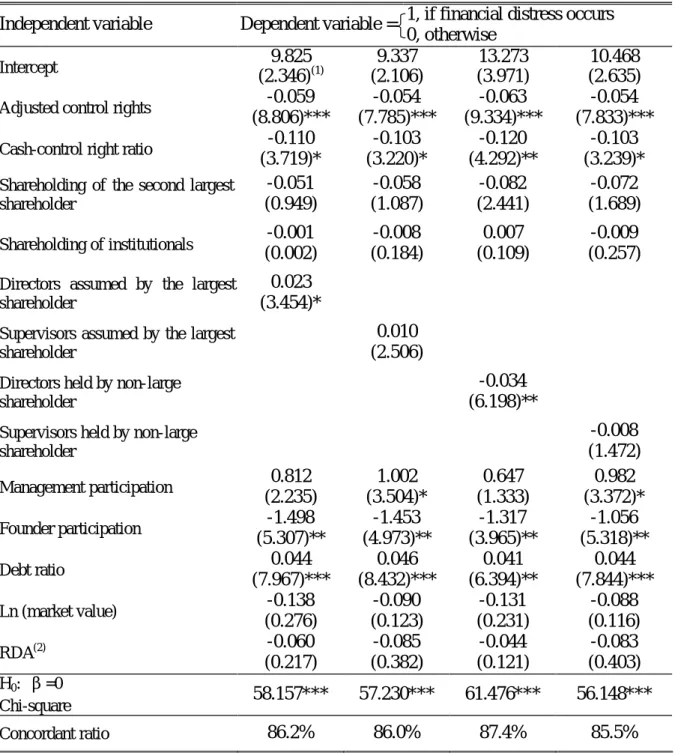
Binary logistical regression models were employed to investigate the relationship between ownership and board structure and the likelihood of financial distress. The dependent variable was binary with the value one indicating financially distressed firms, and zero indicating financially healthy firms. As can be seen from Table 2, the adjusted control rights had a significantly negative relationship with the probability of financial distress. The higher
the stock pledge ratio, the lower the adjusted control rights. When the stock market greatly declines, the controlling shareholders must buy more shares to maintain the stock price and hence the value of their collateral, lest they be requested to pledge more assets to backup the loan. Embezzlement is the easiest way to fund the stock investment as the above mentioned. However, when the stock price eventually falls, the companies are trapped with financial difficulties.
Insert Table 2 here
We also found that a higher ratio of cash flow to control rights mitigates the deficiency in
corporate governance because the regression coefficients for the cash-control rights ratio are significantly negative for all regressions. This is consistent with Claessens et al. (2002) in that the tendency for wealth expropriation is positively related to the discrepancy between control and cash flow rights. When the expropriation takes the form of embezzlement, the risk of financial distress increases accordingly.
With respect to the board structure, we found a positive relationship between the
percentage of board seats as well as supervisory seats occupied by the members of the largest shareholder and the likelihood of financial distress. On the contrary, a higher percentage of board seats held by non-large shareholders helped to reduce the possibility for financial crisis. Again we demonstrate that when the controlling shareholder also dominates the board of directors and supervisors, expropriation of the minority interests tends to be more serious, and hence a higher probability of getting into financial difficulties. Little has been discussed along this research frontier and the empirical findings speak for the contributions of this paper. Another interesting result from Table 2 is the higher tendency for financial distress for companies who change hands. Newcomers are more likely to get the company into financial turmoil than the original founders, meaning that the raiders for corporate control may not be
good for the company. It was also found that members of the controlling shareholder's family acting as both chairmen and CEOs of firms might be harmful, due to the potentially more serious agency problems.
Turning to the corporate characteristics, debt ratio is significantly positively related to the probability of financial distress. Thus the benefits of the leverage effect and tax shelters are outweighed by the risk of financial crisis. On average, the debt ratio of financially distressed companies reached 59% the year prior to the event, while that of healthy firms was only 42.39%.
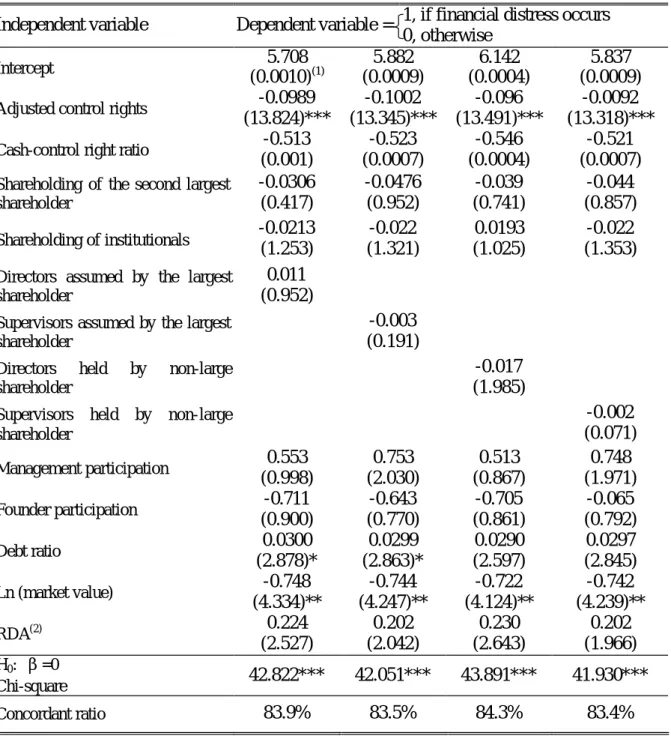
In Table 3, we see that the adjusted control rights display the most profound impact on the likelihood of financial distress in the logistic regression run on the data two years prior to the tragic event. Again, the high percentage of shares pledged for loans on the controlling shareholder’s part seems to be detrimental to the firm. Assuming both the chairman and CEO are controlled by the controlling shareholder weakens the effectiveness of corporate governance, which in turn worsens the firm’s financial condition.
Insert Table 3 here
Comparing Table 3 (using the data two years prior to the financial distress) with Table 2 (using the data one year prior to the financial distress), cash flow to control rights ratio, the percentage of directors assumed by controlling family members and the percentage of directors assumed by non-large shareholders which are significant in Table 2, becomes insignificant in Table 3. Table 1 helps to explain the situation. The three variables for financially distressed firms do not show any significant differences from those of healthy firms two years prior to the distress. Yet during the year prior to the incident, the percentage of board seats held by the controlling shareholder (non-large shareholders) increases (decreases) significantly. The danger of wealth expropriation has clearly enhanced and so has
the possibility of financial crisis.
Both Tables 2 and 3 reveal that adjusted control rights is the most significant variable in explaining the likelihood of financial crisis. We are therefore interested in knowing how it changes three months before the crisis occurs. Adjusted control rights is negatively related to the stock pledge ratio, and the stock pledge ratio one month (three months) prior to the incident averages 57.90% (55.05%), both higher than 37.32%, the prior-year-end average. It is clear that the controlling shareholders and all of the board members as a whole need credit badly prior to the distress.
C. The estimated samples and the holdout samples
For prediction purposes, the samples are reclassified into two subsamples, namely, the estimated sample and the holdout sample according to the time-series order of the occurrence of the financial distress. The first two thirds of our sample was grouped into an estimated sample. Similar logistic regressions were run on the estimated sample using the data one-year before the distress to generate parameter estimates. The data of the holdout sample one-year before the crisis were then plugged into the estimated model. A simple transformation of the following form gives us the estimated probability of financial distress,
i i ' ' 1 x x i e e P β β + =
where P = the estimated probability of financial distress of firm i i β = the vector of the estimated regression coefficients
Xi= the vector of the values of the independent variables for firm i
The results are tabulated in Table 4. Since the percentage of directors held by the largest shareholder, the percentage of supervisors held by the largest shareholder, the percentage of directors held by the non-large shareholders and the percentage of supervisors held by the
non-large shareholders display multi-collinearity, we estimated four different models with only one of the four variables mentioned above entering into each of the four models.
Table 4 shows that the model with the percentage of directors held by the largest shareholder gives the best prediction results. The average estimated probability of financial crisis for the distressed companies in the holdout sample is 0.7237 while that of the healthy companies is only 0.3198. For the four models as a whole, the average estimated probability for distressed (healthy) firms is 0.6309 (0.2368). The differences in probabilities for both groups are all significant at the 1% level.
Insert Table 4 here
We then followed the prior literature and applied a cutoff point of 0.5 (the probability of financial distress) to investigate the number of cases in the holdout sample that were misjudged. For the first model (using the percentage of directors held by the largest shareholder as explanatory variable), three of the 15 distressed companies were misclassified as healthy firms, and five of the other 30 healthy firms were misclassified as distressed firms. For the other three models, more misclassified cases were found for the distressed group, but less for the healthy group. If we focus on the accuracy of predicting whether a firm will get into financial distress, model one performs the best.
Insert Table 5 here
D. Do financial performances help in predicting financial distress?
ROA, ROE and EPS data for the distressed and healthy companies collected and compared with one another. We found that none of the three performance measures could distinguish one group from the other statistically two years before the crisis. However,
significant differences were found one year before the crisis. To look further into the relationship between the ownership and board structure variables and financial performance variable, we constructed an overall performance index. Each firm gets a rank in each of the three financial measures one year before financial distress. The sums of the three ranks were ranked again. The first half of the overall ranking was grouped into a good performance sample while the last half was called the bad performance sample.
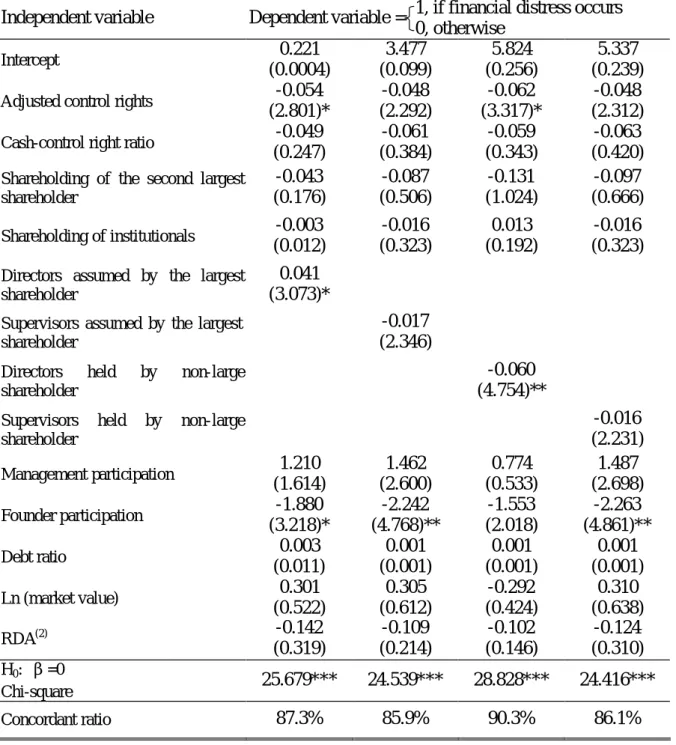
Logistical regressions were then run on both the good sample (consisting of 15 distressed companies and 52 healthy companies) and the bad sample (consisting of 30 distressed companies and 36 healthy companies). The results are shown in Tables 6 and 7, respectively. For the good sample, the board structure variables are more capable of explaining the financial distress. Specifically, when the controlling shareholder holds more seats on the board, even good performance companies receive a higher probability for distress next year. On the contrary, when more directors are held by the non-large shareholders, that probability for distress is reduced. Similar to Table 2, founder participation also signals a lower probability for financial distress. The implication is that even good performance companies are likely to get into financial trouble later on if corporate governance is weakened.
Insert Table 6 here
Insert Table 7 here
For the bad performance sample, Table 7 does not show any significant explanatory power for the board structure variables. Debt ratio, adjusted control rights and cash-to-control rights ratio represent more powerful explanatory variables. The implication is that when a bad performance company increases its' debt ratio, lowers its' adjusted control rights (through higher pledge ratio), and widens the discrepancies between its' control and cash flow rights,
the probability of financial distress in the following year will inevitably increase.
VI. Conclusions
Taiwanese listed companies are typically controlled by families. The ownership and board structures are similar to those in many other countries. The anti-director rights index for Taiwanese listed firms resembles the average index of 49 countries investigated by La Porta et al. (1998). Our empirical results, therefore, may shed some light on the effects of corporate governance and the likelihood of financial distress for other countries.
The corporate governance variables used include the deviation of control rights from cash flow rights, the percentage of board (supervisors) seats controlled by the largest shareholder, and the percentage of shares pledged for loans by board members and managers. Our results suggest that the greater the deviation of control rights from cash flow rights, the more directors and supervisors occupied by the largest shareholder and the higher the stock pledge ratio, the more likelihood the firm would get into financial distress in the following year. Similar results were obtained even after controlling for the effects that debt ratio and financial performance may have. A holdout sample prediction, based on the logistical models developed using estimated sample, gives an average probability for getting into financial distress of 63.09% for those companies that actually fell into crisis, and 23.68% for those that remained financially healthy.
The argument that the controlling shareholder may desire to prolong the expropriation honeymoon suggests that poor governance may not lead to higher probability of financial failure. However, since our sampling period essentially covers the Asian Financial Crisis which led to serious economic recession, poor macroeconomic factors might have speeded up the occurrence of financial distress even if the expropriative shareholders tried to prevent it
from happening. Furthermore, the Bankruptcy Law of Taiwan does not require the removal of the controlling shareholder from the managerial positions, which practically reduces the cost of financial distress. It follows that the controlling shareholder may not try too hard enough to fight for survival as the hypothesis of expropriation prolongation predicts.
Several researches have cited bad corporate governance as one of the key factors leading to the Asian Financial Crisis in 1997. However, no one has tried to develop an early warning system that incorporates corporate governance variables so far. Our research results indicate that an early warning system cannot be complete without incorporating the corporate governance characteristics. The reason is that poor corporate governance can increase the probability of financial distress even for firms with good financial performance. Therefore, financial data alone may not be good enough for the purpose of predicting financial failure. Rich policy implications may also be derived from our research. For example, strengthening the corporate governance mechanism would help to reduce the likelihood of financial failures, especially in a low cash-to-control rights ratio environment.
References
Altman, E. I., 1968, “Financial Ratios, Discriminate Analysis and the Prediction of Corporate Bankruptcy,” Journal of Finance 23,589-609.
Aziz, A., and G. H. Lawson, 1989, “Cash Flow Reporting and Financial Distress Models: Testing of Hypotheses,” Financial Management 18, 55-63.
Bahnson, P. R., and J. W. Bartley, 1992, “The Sensitivity of Failure Prediction Models to Alternative Definition of Failure,” Advance in Accounting 10, 255 -278.
Barcly, M. and C. Holderness, 1989, “Private Benefits from Control of Public Corporations,” Journal of Financial Economics 25, 371-395.
Bergstrom, C. and K. Rydqvist, 1990, “Ownership of Equity in Dual-Class Firms,” Journal of Banking and Finance 14, 255-269.
Beaver, W. H., 1966, “Financial Ratios as Predictors of Failure,” Journal of Accounting Research 4, 71-102.
Blum, M., 1974, “Failing Company Discriminant Analysis,” Journal of Accounting Research 12, 1-25.
Casey, C. J., and N. J. Bartczak, 1984, “Cash Flow- It’s Not the Bottom Line,” Harvard Business Review 62, 60-66.
Chan, S. H., Martin, J., and J. Kensinger, 1990, “Corporate Research and Development Expenditures and Share Value,” Journal of Financial Economics 26, 255-276.
Chen, C. W., and B. K. Church, 1992, “Default on Debt Obligations and the Issuance of Going-Concern Opinions,” Auditing: A Journal of Practice and Theory 11, 30-49.
Claessens, S., S. Djankov, and L. Klapper, 1999, “Resolution of Corporate Distress: Evidence from East Asia’s Financial Crisis,” The First Annual World Bank Group-Brookings Institution Conference, Palisades, New York.
Claessens, S., S. Djankov, and L. H. P. Lang, 2000, “The Separation of Ownership and Control in East Asian Corporation,” Journal of Financial Economics 58, 81-112.
Claessens, S., S. Djankov, J. Fan, and H. P. Lang, 2002, “Disentangling the Incentive and Entrenchment Effects of Large Shareholdings,” Journal of Finance, forthcoming.
Dechow, P. M., and D. J. Skinner, 2000, “Earnings Management: Reconciling the Views of Accounting Academics, Practitioners, and Regulators,” Accounting Horizons 14, 235-250. Delaney, K. J., 1991, Strategic Bankruptcy: How Corporate and Creditors Use Chapter 11 to
Their Advantage, University of California Press.
Faccio, M., and L. H. P. Lang, 2000, “The Separation of Ownership and Control: An Analysis of Ultimate Ownership in Western European Corporations,” 2000 European Financial Management Association Annual Meeting.
Fan, P. H., and T. J. Wong, 2002, “Corporate Ownership Structure and the Informativeness of Accounting Earnings in East Asia,” Journal of Accounting and Economics, forthcoming. Foster, B. P., T. J. Ward, and J. Woodroof, 1998, ”An Analysis of the Usefulness of Debt
Defaults and Going Concern Opinions in Bankruptcy Risk Assessment,” Journal of Accounting Auditing and Finance, Summer, 351-371.
Ratios, and Bankruptcy,” Journal of Business Finance and Accounting 14, 595-606. Gilson, S., 1989, “Financial Distress and Management Turnover,” Journal of Financial
Economics 25, 241-262.
Gilson, S., 1990, “Bankruptcy, Board, Banks, and Blockholders,” Journal of Financial Economics 26, 355-387.
Gilson, S., J. Kose, and L. Lang, 1990, “Troubled Debt Restructuring: An Empirical Study of Private Reorganization of Firms in Default,” Journal of Financial Economics 26, 315-353.
Gilson, S., and M. R. Vetsuypens, 1993, “CEO Compensation in Financially Distressed Firms: An Empirical Analysis,” Journal of Finance 48, 425-457.
Healy, P. M., and J. M. Wahlen, 1999, “A Review of the Earnings Management Literature and Its Implications for Standard Setting,” Accounting Horizons 13, 365-383.
Her, M. M., and A. Mahajan, 2000, “Corporate Governance and Family Control: The Case of Taiwanese Listed Firms,” Working paper, Texas A&M University.
Hopwood, W., J. C. Mckeown, and J. F. Mutchler, 1994,”A reexamination of Auditor versus Model Accuracy Within the context of the Going-Concern Opinion Decision,” Contemporary Accounting Research 10, 409-431.
Hosmer, D. W., and S. Lemeshow, 1989, Applied Logistic Regression, New York: John Wiley. Hsu, S. C., 1997, “Familism, Professionalism and Entrepreneurship - In the Perspective of
Chinese Business Firms,” Management Review 16, 1-9.
Johnson, S., P. Boone, A. Breach, and E. Friedman, 2000, “Corporate Governance in the Asian Financial Crisis,” Journal of Financial Economics 58, 141-186.
La Porta, R., F. Lopez-de-Silanes, A. Shleifer, and R. Vishny, 1998, ”Law and finance,“ Journal of Political Economy 106,1113-1155.
La Porta, R., F. Lopez-de-Silanes, and A. Shleifer, 1999, ”Corporate ownership around the world,” Journal of Finance 54, 471-517.
La Porta, R., F. Lopez-de-Silanes, A. Shleifer, and R. W. Vishny, 2000, “Investor Protection and Corporate Governance,” Journal of Financial Economics 58, 3-27.
La Porta, R., F. Lopez-de-Silanes, A. Shleifer, and R. W. Vishny, 2002, “Investor Protection and Corporate Valuation,” Journal of Finance, forthcoming.
Lemmon, M. L., and K. V. Lins, 2001, “Ownership Structure, Corporate Governance, and Firm Value: Evidence from the East Asian Financial Crisis,” The Third Annual Conference on Financial Market Development in Emerging and Transition Economies, Hong Kong University of Science and Technology.
McConnell, J., and C. Muscarella, 1985, “Corporate Capital Expenditure Decisions and the Market Value of the Firm,” Journal of Financial Economics 14, 399-422.
Norton, C. L., and R. E. Smith, 1979, “A Comparison of General Price Level and Historical Cost Financial Statements in the Prediction of Bankruptcy,” The Accounting Review 54, 72-87.
Ohlson, J. A., 1980, “Financial Ratios and the Probabilistic Prediction of Bankruptcy,” Journal of Accounting Research 18, 109-131.
Journal of Applied Corporate Finance, forthcoming.
Prowse, S., 1998, “Corporate Governance: Emerging Issues and Lessons from East Asia,” Responding to the Global Financial Crisis─World Bank mimeo.
Semkow, B. W., 1994, “ Chinese Corporate Governance and Fina nce in Taiwan,” Journal of International Banking and Financial Law, December, 528-540.
Schipper, K. 1989, “Commentary on Earnings Management”, Accounting Horizons 3,91-102. Shleifer, A., and R. Vishny, 1997, “A Survey of Corporate Governance,” Journal of Financial
Economics 52, 737-783.
Ward, T. J., 1994, “An Empirical Study of the Incremental Predictive Ability of Beaver’s Native Operating Flow Measure Using Four-State Ordinal Model of Financial Distress,” Journal of Business Finance and Accounting, 547-561.
Ward, T. J. and B. P. Foster, 1997, ”A Note on Selecting a Response Measure for Financial Distress,” Journal of Business Finance and Accounting 24, 869-879.
Yeh, Y. H., S. B. Chiu, and H. C. Ho, 1997, “Wealth Exploitation and Ownership Structure: A Study of Agency Theory on Taiwan Stock Market,” Journal of Financial Studies 4, 47-73. Yeh, Y. H., T. S. Lee and T. Woidtke, 2001, “Family Control and Corporate Governance:
Evidence for Taiwan,” International Review of Finance 2, 21-48.
Zavgren, C. V., 1982, “A Logistic Analysis of the Relationship between Vulnerability to Failure and Certain Financial Variables for American Industrial Firms,” Working paper no. 796, Krannert Graduate School of Management, Purdue University.
Zingales, L., 1994, “The Value of the Voting Right-A Study of the Milan Stock Exchange Experience,” Review of Financial Studies 7,125-148.
Table 1: Basic Statistics of Ownership structure and board compositions one and two years before the financial distress
We collected data from Taiwan listed companies that encountered financial distress between January 1996 and December 1999, together with a matching sample consisting of healthy companies. We have 45 companies in our financial distress sample. The matching samples were chosen on a two-to-one basis consisting of firms that were in the same industry and of comparable size, but not going into financial distress during the sampling period. The sampling technique employed helped to control the influences of industry and size factors on financial distress. 88 firms were chosen as our matching sample.
one year before two years before
average (%) average (%) distressed firms healthy firms t-statistics distressed firms healthy firms t-statistics A. Ownership structure control rights 24.80 27.72 -1.125 26.45 30.71 -1.392
stock pledge ratio 37.32 15.15 4.050*** 46.27 16.06 5.130***
ratio of cash flow to
control rights 47.92 63.13 -2.382** 62.27 63.22 -0.136 ownership of the second largest shareholder 0.93 3.74 -2.756*** 1.107 2.992 -1.745* ownership of institutional investors 9.73 15.93 -2.579*** 9.36 14.05 -1.660* B. Board structure
directors held by the
largest shareholder 73.74 59.98 3.166*** 66.19 59.23 1.455
supervisors held by the
largest shareholder 69.63 49.75 2.779*** 52.14 48.56 0.419 directors held by non-large shareholder 19.21 34.41 -3.921*** 28.55 37.24 -1.962* supervisors held non-large shareholder 27.07 43.69 -2.389** 44.02 46.78 -0.351 management participation 60.00 44.32 1.722* 58.97 40.00 1.942* founder participation 64.44 90.91 -3.942*** 76.92 90.67 -2.023**
Table 2: Regression coefficients of logistical models - the year prior to financial distress, all samples
Binary logistical regression models were employed to investigate the relationship between ownership and board structure and the likelihood of financial distress one-year before the financial distress. The dependent variable was binary with the value one indicating financially distressed firms, and zero indicating financially healthy firms.
Independent variable Dependent variable = 1, if financial distress occurs 0, otherwise Intercept 9.825 (2.346)(1) 9.337 (2.106) 13.273 (3.971) 10.468 (2.635)
Adjusted control rights -0.059
(8.806)*** -0.054 (7.785)*** -0.063 (9.334)*** -0.054 (7.833)***
Cash-control right ratio -0.110
(3.719)* -0.103 (3.220)* -0.120 (4.292)** -0.103 (3.239)*
Shareholding of the second largest shareholder -0.051 (0.949) -0.058 (1.087) -0.082 (2.441) -0.072 (1.689) Shareholding of institutionals -0.001 (0.002) -0.008 (0.184) 0.007 (0.109) -0.009 (0.257)
Directors assumed by the largest shareholder
0.023 (3.454)*
Supervisors assumed by the largest shareholder
0.010 (2.506)
Directors held by non-large shareholder
-0.034 (6.198)**
Supervisors held by non-large shareholder -0.008 (1.472) Management participation 0.812 (2.235) 1.002 (3.504)* 0.647 (1.333) 0.982 (3.372)* Founder participation -1.498 (5.307)** -1.453 (4.973)** -1.317 (3.965)** -1.056 (5.318)** Debt ratio 0.044 (7.967)*** 0.046 (8.432)*** 0.041 (6.394)** 0.044 (7.844)*** Ln (market value) -0.138 (0.276) -0.090 (0.123) -0.131 (0.231) -0.088 (0.116) RDA(2) -0.060 (0.217) -0.085 (0.382) -0.044 (0.121) -0.083 (0.403) H0: β=0 Chi-square 58.157*** 57.230*** 61.476*** 56.148*** Concordant ratio 86.2% 86.0% 87.4% 85.5%
(1) Number in parentheses are X2 values.
(2) The ratio of R&D expenses and advertisement expenses to sales.
Table 3: Logistical model regression coefficients - two years prior to financial distress, all samples
Binary logistical regression models were employed to investigate the relationship between ownership and board structure and the likelihood of financial distress two years before the financial distress. The dependent variable was binary with the value one indicating financially distressed firms, and zero indicating financially healthy firms.
Independent variable Dependent variable = 1, if financial distress occurs 0, otherwise Intercept 5.708 (0.0010)(1) 5.882 (0.0009) 6.142 (0.0004) 5.837 (0.0009)
Adjusted control rights -0.0989
(13.824)*** -0.1002 (13.345)*** -0.096 (13.491)*** -0.0092 (13.318)***
Cash-control right ratio -0.513
(0.001) -0.523 (0.0007) -0.546 (0.0004) -0.521 (0.0007)
Shareholding of the second largest shareholder -0.0306 (0.417) -0.0476 (0.952) -0.039 (0.741) -0.044 (0.857) Shareholding of institutionals -0.0213 (1.253) (1.321) -0.022 (1.025) 0.0193 (1.353) -0.022
Directors assumed by the largest shareholder
0.011 (0.952)
Supervisors assumed by the largest shareholder
-0.003 (0.191)
Directors held by non-large shareholder
-0.017 (1.985)
Supervisors held by non-large shareholder -0.002 (0.071) Management participation 0.553 (0.998) 0.753 (2.030) 0.513 (0.867) 0.748 (1.971) Founder participation -0.711 (0.900) -0.643 (0.770) -0.705 (0.861) -0.065 (0.792) Debt ratio 0.0300 (2.878)* 0.0299 (2.863)* 0.0290 (2.597) 0.0297 (2.845) Ln (market value) -0.748 (4.334)** -0.744 (4.247)** -0.722 (4.124)** -0.742 (4.239)** RDA(2) 0.224 (2.527) 0.202 (2.042) 0.230 (2.643) 0.202 (1.966) H0: β=0 Chi-square 42.822*** 42.051*** 43.891*** 41.930*** Concordant ratio 83.9% 83.5% 84.3% 83.4% (1)
Number in parentheses are X2 values.
(2) The ratio of R&D expenses and advertisement expenses to sales.
Table 4: Estimated probabilities of financial distress for the holdout sample - one year before the financial distress
For the purpose of prediction, the first two thirds of our sample (which included 30 distressed firms and 58 healthy matching firms) was designated as the estimated sample according to the time-series order of the occurrence of the financial distress. The remaining third (which included 15 distressed firms and 30 healthy matching firms), or the holdout sample was reserved to validate the statistical results generated from the estimated sample. Similar logistical regressions were run on the estimated sample using the data one-year before the distress to generate parameter estimates. The data for the holdout sample one-year before the crisis were then plugged into the estimated model.
Estimated probability of financial distress Independent variable in
the estimated model(1) financial distressed firms financially healthy firms t-statistics(3)
% of director occupied by the largest shareholder, and
other independent
variables(2)
0.7237 0.3198 5.487***
% of supervisors occupied by the largest shareholder,
and other independent variables
0.6171 0.2273 5.458***
% of director held by non-large shareholders and other independent variables
0.5899 0.1937 4.879***
% of supervisors held by non-large shareholders and other independent variables
0.5929 0.2063 5.441***
Average 0.6309 0.2368
(1)
Estimated models are logistical regression models that were estimated using the data one-year before the financial distress.
(2) Other independent variables refer to all the independent variables in Table 2 except the percentage
of directors (supervisors) held by the controlling shareholders and non-large shareholders, respectively.
(3)
T-statistics were computed under the hypothesis that there is no difference in the estimated probabilities of financial distress for both groups of companies.