行政院國家科學委員會專題研究計畫成果報告
銀行不動產投資行為研究
Study on Bank’s Real Estate Investment Behavior
計畫編號:NSC 89-2416-H-002-018
執行期限:88 年 8 月 1 日至 89 年 7 月 31 日
主持人:廖咸興 執行機構:國立台灣大學
一、中文摘要 過度曝露於不動產風險,而導致金融 危機的現象普遍發生在全世界各它地區。 1997 年的亞洲金融危機,即啟始於泰國銀 行之抵押放款呆帳問題。隨之而來的泰銖 狂貶,產生骨牌效應、波及鄰近各國,也 對世界金融產生重大而深遠的影響。事實 上,1980 年代以來,過度曝露於不動產風 險而導致金融危機的現象也發生在世界其 它地區,包括美國 1980 年代的儲貨危機、 日本的住宅金融危機,以及法國里昂信貸 的鉅額虧損等。而民國八十四年,臺灣發 生了一連串金融危機,究其原因,除了金 融制度未臻健全外,主要在於金融機構在 市場景氣時,過度曝露於不動產風險之 下。此種不動產風險的過度曝露,彰顯於 市場景氣時,過多的不動產放款及投資 上。此種基於過去已發生市場狀況決定投 資策略之方式,乃屬於一種追價的行為(亦 及即買高賣低)。本研究之目即在台灣地區 銀行之不動產投資行為是否有追價的現 象,而且此種行為是否導致較差的投資績 效。本研究發現,本國銀行之股價績效與 不動產放款佔總放款比率並未有顯著關 係,而且本國銀行之不動產放款佔總放款 比率與不動產景氣也未有顯著關係。因 此,本國銀行投資於不動產放款的行為以 及股價績效可能尚有其他重要的影響因 素。 關鍵詞:銀行、不動產投資行為 Abstr actOver exposure to real estate risk has
been one of the major causes for bank operating crisis. The over exposure phenomenon can be seen from the fact that banks put too much investment in real estate loan and other real estate investment when the market is booming. That is, because of the good performance of asset return performance, banks allocate more resources on real estate related assets. An investment strategy that increases investment after returns have gone up and reduces after returns have gone down represents a “trend-chasing” investment strategy (that is, buying high selling low). The purpose of this study is to examine whether Taiwan banks have trend-chasing behavior and whether this kind of behavior causes the their poor performance. This study finds that Taiwan banks’ investments in real estate loans are not significantly influenced by real estate market situation. That is, this study cannot prove that Taiwan banks have trend-chasing behavior in real estate investments. The results of this study also show that there might be other significant issues needed to be further investigated when study Taiwan banks’ stock returns performance.
Keywor ds:Bank, Real estate investment behavior
I. Intr oduction
Over exposure to real estate risk has been one of the major causes for bank operating crisis. The over exposure phenomenon can be seen from the fact that banks put too much investment in real estate loan and other real estate investment when the market is booming. That is, because of the good performance of asset return
performance, banks allocate more resources on real estate related assets. An investment strategy that increases investment after returns have gone up and reduces after returns have gone down represents a “trend-chasing” investment strategy (that is, buying high selling low). The purpose of this study is to examine whether Taiwan banks have trend-chasing behavior and whether this kind of behavior causes the their poor performance.
Real estate loan assets are the major real estate related assets of most Taiwan banks. This study, hence, investigates the real estate investment behaviors of Taiwan banks by examining the change of bank’s allocation in real estate loans.
Understanding the behaviors of bank’s real estate investment can help the banks to better improve their real estate loan allocation decision. It will also help the regulatory authorities to make appropriate policy for bank’s assets allocation.
The rest of the paper is arranged as follows. In Section II, we introduce the methodologies for examining relationship between bank’s real estate investment behavior and the real estate market situation. In Section III, we described the data we use in the empirical testing. Section IV shows the empirical results. Section V is the conclusion.
II. Methodologies.
To examine the relationship between bank’s real estate investment behavior and the real estate market situation, we do the following regression:
(1) Lt =αo +α1RBCt−n +εt
where Lt is the monthly (or quarterly) growth rate of the ratio of bank’s real estate loan assets to total loan assets at time t; RBCt is the monthly (or quarterly) rate of
return of building and construction industry at time t; n is 0, 3, 6, 9, or 12 for monthly data, and is 0, 1, 2, 3, or 4 for quarterly data. The RBC variable represents the real estate
market situation. It is quite obviously that there is a positive relationship between real estate market situation and the stock return performance of building and construction industry. This study, therefore, use the rate of return of building and construction industry to be the proxy of real estate market situation in equation (1). In order to examine whether Taiwan banks have trend-chasing behavior in real estate loan investment, we also examine the impact of previous real estate market situation on current bank’s real estate loan investment behavior.
To investigate whether the bank’s stock performance is influenced by its investment real estate loans, we run the equation shown in equation (2): (2) t n t o t L RBK =β +β1 − +ε
where Lt is the monthly (or quarterly) growth rate of the ratio of bank’s real estate loan assets to total loan assets at time t; RBK is the monthly (or quarterly) rate of return of bank industry at time t; n is 0, 3, 6, 9, or 12 for monthly data, and is 0, 1, 2, 3, or 4 for quarterly data. Since the influence of a bank’s real estate loan investment on bank’s stock performance may have time lag, we also use growth rate of bank’s real estate loan of previous period as explaining variable for bank’s stock returns.
III. The Data
This study uses the ratio of banks’ real estate loan assets to banks’ total loan assets to represent the allocation of bank’s investments in real estate related asset. We use both monthly and quarterly data to consider that the real estate market may take longer time to exert its effect on bank’s stock returns. Data series starts from February 1992 to August 2000. Data are obtained from Taiwan Central Bank. The monthly and quarterly stock rate of returns of bank industry and building and construction industry are from Datastream.
IV. Empir ical Results Summar y Statistics
Our empirical work first summarizes the data used. The summary statistics are presented Table 1. In Table 1 we find that both monthly and quarterly data show similar characteristics that in the sample period, the average growth rate of real estate loans of Taiwan banks are are declining and the mean stock rate of returns of both bank industry and building and construction industry are positive.
In addition, in Table, autocorrelation
coefficients of all three variables are small. We also plot the three variables in figure 1. Figure 1 shows that growth rate of real estate loan investment does not move together with the two return series.
[Table 1 Her e]
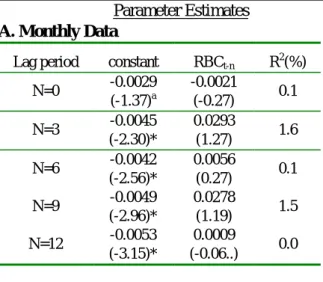
The empirical results of equation (1) are presented in Table 2. Table 2 shows that in our sample period, neither monthly nor quarterly data exhibits that Bank’s real estate loan investment are significantly influenced by the real estate market situations. Table shows even previous real estate market situations does not exert significant influence in Taiwan bank’s real estate loan investments. Therefore, we do not see any trend-chasing behavior in Taiwan banks’ real estate loan investments.
[Table 2 her e]
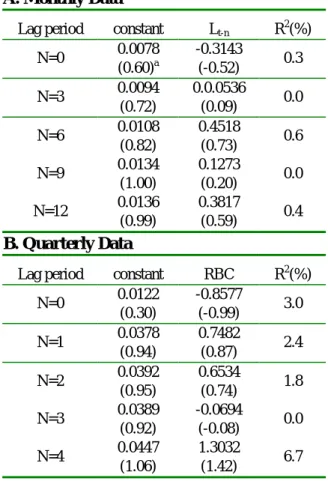
The empirical results of equation (2) are exhibited in Table 3. Table 3 shows that, in the sample period, the stock returns performance of Taiwan banks are not significantly influenced by their current or previous real estate loan investments. Both monthly and quarterly data shows the same results. The results indicate that there might be other important factors influencing Taiwan banks’ stock returns performance.
[Table 3 Her e] V. Conclusion
The study examines whether there exists trend0-chasing behaviors in Taiwan banks real estate loan investments. This study also investigates whether real estate loan investments are the major factors influencing Taiwan banks’
stock returns performance. The empirical results that, in our sample period, no trend-chasing behavior can be proved and real estate loan investments are not the major factor influencing Taiwan banks’ stock returns performance. These results tell us that there might be other important factors that influence Taiwan banks’ real estate loan investment decisions. The results of this study also show that there might be other significant issues needed to be further investigated when study Taiwan banks’ stock returns performance.
Refer ence
Berlin, M, A, Saunders, and G. Udell, “Deposit Insurance Reform: What Are the Issues and What Needs to be Fixed,” Journal of Banking and Finance 15 (1991), 735-752.
Campbell, John Y., Stock Return and the Term Structure, Journal of Financial Economics, 1987, 18,
373-399.
Fama, Eugene, and Kenneth R. French, Dividend Yields and Expected Stock Returns, Journal of Financial Economics, 1988, 22:
3-25.
Ferson, Wayne E., Changes in Expected Security Returns, Risk, and Level of Interest rates, Journal of Finance, 1989, v44, 1191-1217.
Ferson, Wayne E. and Harvey, C., The Variation of Economic Risk Premiums, Journal of Political Economy, 1990, v99, 2:385-415.
Gyourko, Joseph, and Donald Keim, “What Does the Stock Market Tell Us about Real Estate Returns?”
AREUEA Journal 20 (1992),
457-485..
Liu, Crocker H. and Jianping Mei, The Predictability of Returns on Equity REITs and Their Co-movement with Other Assets,
Journal of Real Estate Finance & Economics, 1992, No 5, pp401-418.
Mei, Jianping and Ahyee Lee, Is There a Real Estate Risk Premium?
Journal of Real Estate Finance & Economics, 1994, No 9, pp.113-126.
Mei, Jianping and Anthony Saunders, Bank Risk and Real Estate: An Asset Pricing Perspective, Journal
of Real Estate Finance &
Economics, 1995, No 10,
pp.199-224.
Mei, Jianping and Anthony Saunders, Have U.S. Financial Institutions’ Real Estate Investments Exhibited “Trend-Chasing” behavior? The Review of Economics and Statistics,
1997, pp.248-258.
Mei, Jianping and Hsien-hsing Liao, "Risk Attributes of Real Estate Related Securities---An Extension of Liu and Mei (1992)" , Journal of Real Estate Research, Vol. 16, No. 3, pp.279-290。
Table 1 Summary Statistics A. Monthly Data Variable (growth rate or returns) Mean Stdev 1
ρ
Growth Rate of bank’s Real estate Loan -0.0029 0.0211 0.307 Building & Construction Industry 0.0035 0.0842 0.087 Bank Industry 0.0087 0.1291 -0.046B. Quar ter ly Data
Variable (growth rate or returns) Mean Stdev 1
ρ
Growth Rate of bank’s Real estateLoan -0.0100 0.0463 0.093 Building & Construction Industry 0.0091 0.1599 -0.271 Bank Industry 0.0208 0.2299 -0.173 Table 2
Results of Estimating equation (1)
t n t o t RBC L =α +α − +ε
where Lt is the monthly (or quarterly) growth rate of the ratio of bank’s real estate loan assets to total loan assets; RBC is the monthly (or quarterly) rate of return of building and construction industry; n is 0, 3, 6, 9, or 12.
Parameter Estimates
A. Monthly Data
Lag period constant RBCt-n R2(%)
N=0 -0.0029 (-1.37)a -0.0021 (-0.27) 0.1 N=3 -0.0045 (-2.30)* 0.0293 (1.27) 1.6 N=6 -0.0042 (-2.56)* 0.0056 (0.27) 0.1 N=9 -0.0049 (-2.96)* 0.0278 (1.19) 1.5 N=12 -0.0053 (-3.15)* 0.0009 (-0.06..) 0.0
B. Quar ter ly Data
Lag period constant RBC R2(%) N=0 -0.0095 (-1.19) -0.0557 (-1.11) 3.7 N=1 -0.0151 (-2.30)* 0.0390 (0.95) 2.8 N=2 -0.0124 (-1.89) -0.0246 (-0.57) 1.1 N=3 -0.0148 (-2.28)* 0.0108 (0.20) 0.1 N=4 -0.0160 (-2.45)* -0.0365 (-0.69) 1.7 a. The figures in parenthesis are t statistics. *. means statistics are not significant at 5% level .
Table 3
Results of Estimating equation (2)
t n t o t L RBK =β +β1 − +ε
where Lt is the monthly (or quarterly) growth rate of the ratio of bank’s real estate loan assets to total loan assets; RBC is the monthly (or quarterly) rate of return of building and construction industry; n is 0, 3, 6, 9, or 12.
Parameter Estimates
A. Monthly Data
Lag period constant Lt-n R2(%)
N=0 0.0078 (0.60)a -0.3143 (-0.52) 0.3 N=3 0.0094 (0.72) 0.0.0536 (0.09) 0.0 N=6 0.0108 (0.82) 0.4518 (0.73) 0.6 N=9 0.0134 (1.00) 0.1273 (0.20) 0.0 N=12 0.0136 (0.99) 0.3817 (0.59) 0.4 B. Quar ter ly Data
Lag period constant RBC R2(%) N=0 0.0122 (0.30) -0.8577 (-0.99) 3.0 N=1 0.0378 (0.94) 0.7482 (0.87) 2.4 N=2 0.0392 (0.95) 0.6534 (0.74) 1.8 N=3 0.0389 (0.92) -0.0694 (-0.08) 0.0 N=4 0.0447 (1.06) 1.3032 (1.42) 6.7 a. The figures in parenthesis are t statistics. *. means statistics are not significant at 5% level .
-0.3 -0.2 -0.1 0 0.1 0.2 0.3 0.4 0.5 0.6 0.7 81年2月29日 82年3月1日 83年3月1日 84年3月1日 85年2月29日 86年3月1日 87年3月1日 88年3月1日 89年2月29日 Time
growth ra te of rea l e sta te loan B uilding and c onstruc tion industry B ank industry
Figure 1. Plot of monthly growth rate of Taiwan bank’s investment in real estate loans and the stock returns of Taiwan bank industry and building & construction industry.