Industrial & Engineering Chemistry Research is published by the American Chemical Society. 1155 Sixteenth Street N.W., Washington, DC 20036
Article
Design and Control of the Side Reactor
Configuration for Production of Ethyl Acetate
Reui-Chiang Tsai, Jian-Kai Cheng, Hsiao-Ping Huang,
Cheng-Ching Yu, Yi-Shan Shen, and Ying-Tien Chen
Ind. Eng. Chem. Res., 2008, 47 (23), 9472-9484 • Publication Date (Web): 30 October 2008 Downloaded from http://pubs.acs.org on November 28, 2008
More About This Article
Additional resources and features associated with this article are available within the HTML version: • Supporting Information
• Access to high resolution figures
• Links to articles and content related to this article
Design and Control of the Side Reactor Configuration for Production of Ethyl
Acetate
Reui-Chiang Tsai,†Jian-Kai Cheng,†Hsiao-Ping Huang,†Cheng-Ching Yu,*,† Yi-Shan Shen,‡and Ying-Tien Chen‡
Department of Chemical Engineering, National Taiwan UniVersity, Taipei 106, Taiwan and Engineering Center, China Petrochemical DeVelopment Corporation, Ta-Sheh, Kaohsiung 815 Taiwan
Despite some potential advantages of reactive distillation (RD), reactive distillation may suffer from maintenance/ design problems such as catalyst deactivation/replacement and equipment design. In this work, an alternative design, a side reactor configuration, is sought and the process of interest is production of ethyl acetate via esterification. The reactive distillation study by Tang et al. (2005) reveals that almost 90% conversion takes place in the column base of the RD. This naturally suggests a coupled reactor/distillation configuration where all of the catalyst is packed in the bottoms base, denoted as single-reactive tray reactive distillation (RD-SRT). This mitigates the maintenance problem associated with conventional RD. However, simulation results show that, with the same amount of catalyst loading, the SRT configuration cannot achieve the same performance as the RD (∼93% conversion). Another alternative is adding external reactors to the SRT, and this is termed the side reactor configuration (SRC). A systematic design procedure is devised for the SRC design, and the objective function to be minimized is the total annual cost (TAC). The results show that the TAC of the SRC only increases by 5% as compared to that of the RD. A plantwide control structure is developed followed by process identification and controller tuning. The results show that reasonable control performance can be achieved using simple temperature control for the feed flow rate and feed composition disturbances.
1. Introduction
Reactive distillation (RD), combining reaction and separation units in a single unit, is sometimes a favorable design alternative to a conventional reactor/separation configuration. Despite having advantages including a simplified separation section, reduced equipment cost, and energy savings, the RD technology requires specific equipment designs to facilitate chemical reaction in reactive trays. This is seldom encountered in conventional distillation. For example, large catalyst holdup in the RD column for maximizing conversion may not be consistent with the requirement of a high interfacial area for good separation.1In addition to catalyst holdup,
potential conflict between the reaction temperature and separation may make the RD less effective as shown by Kaymak and Luyben.2,3 Catalyst deactivation is another issue for the RD. Traditional methods to compensate for catalyst deactivation, i.e., adding excess catalyst or increasing the reaction temperature, are seldom feasible in the RD applications.4Thus, in practice, one has
to overcome design/maintenance problems associated with reactive distillation.
An alternative is to couple a distillation column with one or more external side reactors, in so-called side reactor configura-tions (SRC).2-7External reactors are used as a substitute for reactive trays. In such a manner, the SRC not only overcomes the design/maintenance problem of the RD but also achieves, to a degree, the benefits of a simultaneous reaction and separation feature. The side reactor configuration has been applied to systems such as productions of TAME, MTBE, diisobitene, etc. Most of the literature examples focus on the quantitative design to obtain equally good performance as compared to RD. However, at a conceptual level, evolution of the SRC, e.g., number of side reactors, side streams withdraw, and return trays, etc., is much less clear.
The objective of this work is to investigate the design of the side reactor configuration for the reactive distillation where the reactive zone is placed at the lower section of the RD with no product removal from the column base. This configuration is called type II proposed by Tang et al.8They explore steady-state design
for acetic acid esterification with different alcohols (ranging from C1 to C5), which are categorized into three types of flow sheets. On the basis of the optimal RD design, optimally designed SRC evolves gradually after going through a transitional step. Production of ethyl acetate8,9is used to illustrate the design procedure.
2. Process Description
The reaction for acetic acid (HAc) esterification with ethanol (EtOH) to produce ethyl acetate (EtAc) and water (H2O) can
be expressed as
HAc + EtOHS
k-1 k1
EtAc + H2O (1)
The reversible reaction is described using a pseudohomogeneous model based on the mole fraction of component i (xi) and
catalyst weight (mcat). Model parameters are taken from ref 10
for the esterification reaction catalyzed by Purolite CT179 ion-exchange resin. The rate expression can be written as
R ) mcat×(kFxHAc 1.5 x EtOH- kBxEtAcxH2O) kF) 4.24×10³exp
(
-48 300 RT)
kB) 4.55×10⁵exp(
-66 200 RT)
Keq) 3.50 (T ) 350K) (2)This corresponds to an exothermic reaction with an equilibrium constant slightly greater than 1. In process simulation, a catalyst density of 770 kg/m3is assumed to calculate the total volume occupied by the catalyst in a reactive tray.
* To whom correspondence should be addressed. Tel.: +886-2-3366-3037. Fax: +886-2-2362-3040. E-mail: [email protected].
†
National Taiwan University.
‡China Petrochemical Development Corporation.
10.1021/ie071648o CCC: $40.75 2008 American Chemical Society Published on Web 10/30/2008
To account for a nonideal vapor-liquid equilibrium (VLE) and possible vapor-liquid-liquid equilibrium (VLLE) for this quaternary system, the NRTL11model is used to calculate the
activity coefficient, and model parameters are taken from Tang et al.8Vapor-phase nonideality, dimerization of acetic acid, is
also taken into consideration using the Hayden-O’Connell (HOC) second virial coefficient12model, and Aspen Plus
built-in parameter values are used.
With the thermodynamic models available, the phase behavior can be predicted, and Table 1 shows the normal boiling point temperatures for pure components and azeotropic temperatures. The phase behavior exhibits a ternary minimum boiling azeo-trope: ethanol, methyl acetate, and water at 70.09 °C (Figure 1). From the normal boiling point ranking, conceptually, this complex system can be viewed as a ternary system where two reactants, acetic acid and ethanol, can be treated as heavy key (HK) and intermediate key (IK), respectively; the ternary minimum-boiling azeotrope is considered as the product which the light key (LK). Thus, the reactive zone should be placed in the lower section of the RD column, while the pseudoproduct, liquid with an almost azeotropic composition, is removed from the top of the column overhead. This pseudoproduct is decanted, the water product is withdrawn from the aqueous phase, while the organic phase is further purified to obtain the acetate product. This is exactly the type II configuration of Tang et al.8
3. Conceptual Design
Figure 2 shows the RD flow sheet for EtAc production. The reactive zone is placed in the lower section of the RD column.
The condensed overhead vapor from the RD column is decanted. The aqueous product is withdrawn from the decanter and the organic phase is split with a portion returned to the RD column and a portion fed to a stripping column which produces high-purity EtAc. In the RD column, because the column base has a much larger residence time than a tray, the catalyst holdup is the column base which is assumed to be 10 times of that on the reactive tray. The two fresh feeds into the RD are alcohol feed below azeotropic composition (87% EtOH and 13% H2O) and
industrial-grade acid feed (95 mol % HAc and 5% H2O).
Following the work of Lai et al.,9 the optimized flow sheet
consists of a RD column and a stripper as shown in Figure 2. The flow sheet is obtained by minimizing the total annual cost (TAC)
TAC ) operating cost + capital cost
payback time (3)
Here, a payback time of 3 years is used. The operating cost includes the cost of steam, cooling water, and catalyst. The capital cost comprises the costs of the column, trays, and heat exchangers. Cost models and corresponding values are given in Appendix A (section 6). A catalyst life of 3 months is assumed.
The RD column has 10 reactive trays plus a reactive column base, 9 rectifying trays, and a decanter. The stripper column has 9 trays. Figure 3 shows the composition profile of the RD.
Table 1. Normal Boiling Point Ranking for Pure Components and Azeotropes component/azeotrope T (°C) EtOH-EtAc-H2O 70.09 EtOH-EtAc 71.81 EtOH-H2O 78.18 EtAc 77.2 EtAc-H2O 70.37 EtOH 78.31 H2O 100 HAc 118.01
Figure 1. RCM diagram and two-liquid zone for the EtOH-EtAc-H2O system.
Figure 2. RD flow sheet of the EtAc production.
Figure 3. Composition profile in the RD column where the shaded area
indicates the fraction of total conversion in each tray and close to 90% of the total conversion occurring in the column base.
Figure 4. loading in the SRT configuration versus achievable acetic acid
conversion under different reflux ratio.
Figure 5. (a) Effect of catalyst loading in the column base (Wcat,bot) on
TAC for the RD-SRT configuration and (b) trade off of operation cost (excluding catalyst cost), capital cost, and catalyst cost.
Figure 6. Optimized single reactive tray configuration (RD-SRT) for the
EtAc production.
Figure 7. Comparison of TAC’s for EtAc production using reactive
distillation (RD), single reactive tray reactive distillation (RD-SRT), and side reactor configuration (SRC).
Figure 8. Side reactor configuration (SRC) with the design parameters
indicated in italics.
Figure 9. (a) Effect of side stream return tray (Nss,r) on TAC’s and (b) trade off of the separator cost (capital and operating costs) and reactor cost.
From now on, emphasis will be placed on the RD column and design alternatives will be sought while keeping the same design and product specifications for the stripper.
3.1. Single Reactive Tray (SRT). The composition profile
in the RD column (Figure 3) reveals that the concentration of the heavy reactant (HAc) remains fairly constant (∼90%) throughout the reactive zone, while the light reactant (EtOH) has a very low concentration in the column base (∼1%) and the composition decreases toward the end of the reactive zone. More importantly, close to 90% of the total conversion occurs
in the column base as shown in the shaded area in Figure 3. Thisnaturallysuggestsacoupledreactor/separatorconfiguration;13-15
that is, the single reactive tray (RD-SRT) configuration we can place all the catalyst in the column base and this becomes a single reactive tray column. The SRT configuration seems intuitively appealing and has the advantage of easy catalyst replacement. However, simulation results show that with the same catalyst weight as that of the RD column (Wcat,RD )
Wcat,bot+ Wcat,trays) the SRT configuration is unfeasible for the
given purity specification. In fact, the required catalyst loading
Figure 10. (a) Comparison of the HAc concentration at the side reactor
effluent (open marker) and in the return tray (solid marker, composition profile in the column up to the return tray) as side stream return tray varied and (b) effect of side stream return tray (Nss,r) on the total generation of EtAc.
Figure 11. (a) Effects of percentage of equilibrium conversion (%Xeq) of the side reactor on TAC’s and (b) trade off in the separator cost and reactor cost.
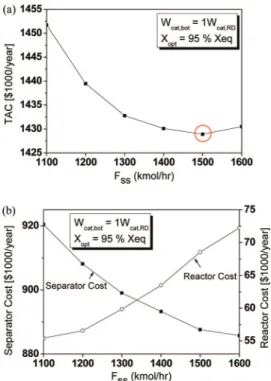
Figure 12. (a) Effect of side stream flow rate (Fss) on TAC’s and (b) trade off in the separator cost and reactor cost.
Figure 13. (a) Effect of catalyst loading in the column base (Wcat,bot) on TAC’s and (b) trade off of the separator cost (excluding catalyst cost), reactor cost, and bottoms catalyst cost.
is 5.2Wcat,RD. Figure 4 clearly shows that the acid concentration
at the column overhead cannot reach the specification unless a substantial increase in the catalyst loading is made. Thus, the performance of the SRT configuration is not as good as that of RD. The conversion is only 93% with the same catalyst loading (Wcat,RD) as opposed to 99% for RD. To obtain an improved
design for the SRT configuration, the TAC is computed as the amount of catalyst in the column base (Wcat,bot) is varied. As
expected, the catalyst holdup (Wcat,bot) increases, the capital and
energy costs decrease, and the catalyst cost increases. The optimized SRT design gives a catalyst loading of 8.5Wcat,RD,
and the energy cost increases by 24% as shown in Figure 5. The improved SRT design is shown in Figure 6with an organic
phase reflux ratio of 2.27 as opposed to 1.76 for the RD. The optimized SRT configuration has a TAC 30% greater than that of the RD configuration (Figure 7). The result reveals that despite having almost 90% conversion in the column base for the RD additional reaction stages are essential to achieve high-purity specification (i.e., high conversion) with acceptable capital and energy costs.
3.2. Side Reactor Configuration (SRC). If a second reaction
stage should be included, the questions then become (1) what type of reaction system and (2) where should the reactor be placed? The answer to the first question is relatively simple: from a maintenance perspective, an external side reactor is preferred (compared to an internal one). The second question actually addresses two issues: (1) where should the side stream be withdrawn (Nss,w) feed to the side reactor) and (2) which
is the side stream return tray (Nss,r ) effluent from the side
reactor)? The side stream is withdrawn from where the reactants are most abundant. For the EtAc production system this is from the column base. The selection of side stream return tray (Nss,r)
is less obvious, and it depends on other design parameters. In theory, finding the side stream return tray is analogous to finding the optimal feed tray location for a feed stream. However, in the SRC configuration this feed composition and column composition are interrelated. In other words, the side reactor effluent composition depends on the reactor size and reactor feed composition which are functions of side stream return tray. Thus, the design variables include catalyst holdup (Wcat,bot)
in the column base, side stream flow rate (Fss) side reactor
feed flow rate), percentage of equilibrium conversion (%Xeq)
in the side reactor, and side stream (reactor effluent) return tray (Nss,r) as shown in Figure 8. We assume that a reactor is an
adiabatic PFR with an aspect ratio (length/diameter) of 5. A systematic design procedure is proposed to find the optimal configuration. All simulations are carried out in Aspen Plus using the RadFrac and RPlug modules.
Given the production rate and product specifications, the design steps are follows: (1) set the same total number of trays equal to that of the RD (NT) 19); (2) withdraw side stream
from the bottoms of the distillation column (Nss,w) 0); (3) set
the number of the side reactor to one (NSR ) 1); (4) guess
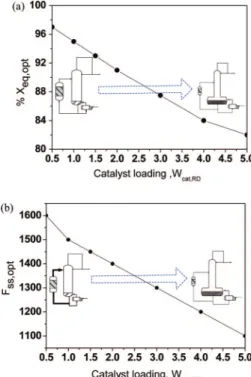
catalyst holdup in the column base (e.g., Wcat,bot ) rWWcat,RD, Figure 14. Relationships between design variables: (a) catalyst loading
versus optimized percentage of equilibrium conversion (to achieve minimum TAC’s) and (b) catalyst loading versus the optimized side stream flow rate (to achieve minimum TAC’s).
which is a multiple of the initial total catalyst weight in the reactive distillation column); (5) guess a side stream flow rate (e.g., Fss) rFRorg, which is a multiple of the organic reflux
flow rate); (6) guess the percent of the equilibrium conversion for the side reactor (e.g., %Xeq) 80%); (7) guess a side stream
return tray (Nss,r); (8) adjust the organic reflux ratio (Rorg/Dorg)
until the HAc specification at the overhead (<100 ppm) is reached, adjust the stripper heat duty until the EtAc specification at the stripper bottoms (>99 mol %) is achieved, and adjust reactor size until the %Xeq is achieved; it is much easier to
perform this in a sequential manner; (9) go back to 7 and change
Nss,runtil the TAC is minimized; (10) go back to 6 and change
%Xequntil the TAC is minimized; (11) go back to 5 and change
Fssuntil the TAC is minimized; (12) go back to 4 and change
Wcat,botuntil the TAC is minimized.
3.2.1. Effects of Side Stream Return Tray Nss,r. Figure 9a
shows that Nss,r) 9 corresponds to the minimum TAC. The
trade off comes from the reactor cost and separator cost, as shown in Figure 9b. The side stream is a large flow consisting of reactants and products (90 mol % HAc). From the separation cost point of view, it is optimal to feed the effluent from the side reactor onto a tray with a similar composition. On the other hand, moving the return tray location upward leads to a decrease in acetic acid concentration, as shown in Figure 10a, so the side reactor needs a larger reactor volume and more catalyst. In Figure 10 we observe that (1) the optimal return tray for the side reactor effluent is the tray with the liquid composition closest to that of the effluent and (2) the production rate of the
EtAc is at its maximum when Nss,r ) 9. Note that the tray
number is counted from the bottom up.
3.2.2. Effects of Achieving Percentage of Equilibrium Conversion, %Xeq. Figure 11a shows that %Xeq) 95 is the
optimal conversion. Again, we look at the reactor cost and separator cost, as shown in Figure 11b. As %Xeqincreases, the
reactor cost increases monotonically due to larger reactor volume and more catalyst needed for the additional reaction. At the same time, the separator cost decreases due to less reaction in the column base.
3.2.3. Effects of Side Stream Flow Rate, Fss. Figure 12a
shows that Fss) 1500 (kmol/h) is the optimal side stream flow
rate. A larger flow rate of the side stream requires a larger reactor volume and more catalyst to achieve the same conversion, so it leads to an increase in the reactor cost, as shown in Figure 12b. Because more reaction in the side reactor reduces the loading of the column, the separator cost decreases.
3.2.4. Effects of Catalyst Loading at Column Base,
Wcat,bot. Figure 13a shows that Wcat,bot) Wcat,RDis the optimal
catalyst amount. As the bottoms catalyst increases, more reaction will occur in the column base. Therefore, the separator and side reactor need a smaller vapor flow rate and lower reactor volume, respectively. The trade off is shown in Figure 13b. If there is no catalyst in the column base (Wcat,bot ) 0), i.e., only a side
reactor for the reaction, this configuration can still work. However, it requires a larger flow rate of the side stream and a considerable amount of catalyst to achieve the product specification.
In summary, all of the trade off comes from the competition between the reaction in the column base and the side reactor. If we increase the reaction in the column base, it will reduce the loading of the side reactor and consequently the side reactor will require a smaller side stream flow rate and a lower percentage of equilibrium conversion, as shown in Figure 14. For the case of one side reactor, the TAC only increases by a factor of 5% as compared to that of the RD design and we conclude that an additoinal external reactor will not be necessary for the SRC. Specifically, the energy cost of the SRC increases by a factor of 3% while using 1.67 times the amount of catalyst, as compared to the RD process. Figure 15 shows the optimized flow sheet where the side stream flow rate is 3.69 times the organic reflux flow rate and the catalyst loading in the column base and side reactor are Wcat,bot ) Wcat,RD and Wcat,SR )
0.67Wcat,RD. This corresponds to 95% of the equilibrium
conversion for the side reactor. Moreover, 89% of the total conversion occurs in the column base, while the remaining 11% happens in the side reactor. Composition profiles for the SRC process are given in Figure 16. Figure 16 shows that the composition profile of the SRC is almost the same as that of the RD (c.f. Figure 3). Parameter values of steady-state designs of all three configurations (RD, SRT, and SRC) are summarized in Table 2.
4. Process Dynamics and Control
The number of studies on the control of reactive distillation columns has grown steadily in the past decade. Luyben and co-workers propose eight control structures for the “neat” reactive distillation of the ideal system (A + B T C + D) (CS1-CS6 in Al-Arfaj and Luyben;16 CS6-CS7 in Al-Arfaj and Luyben;17CS7-CS8 in Kaymak and Luyben).18,19Hung et al.20
explore control structure design for acetic acid esterification with different alcohols (ranging from C1 to C5), which are catego-rized into three types of flow sheets. As for control of various coupled reactor/column systems, some papers have been
Figure 16. Composition profile in the SRC: (a) RD column where the shaded
area indicates the fraction of total conversion in each tray and (b) stripping column.
presented.13-15,21,22However, control of the side reactor
con-figuration has not been discussed in the literature. In this section, a systematic approach to design the control structure is suggested. The design steps are as follows: (1) determine manipulated variables; (2) use NRG (nonsquare RGA) to determine temperature control trays; (3) use decentralized PI controller; (4) use RGA (relative gain array) for variable pairing; (5) use relay feed back to find Ku and Pu; (6) use TL
(Tyreus-Luyben) tuning to find controller settings.
4.1. Determining Manipulated Variables. As compared to
reactive distillation, the side reactor configuration (SRC) has one extra manipulated variable, side stream flow rate (FSS), in
addition to two feed flows (FEtOHand FHAc), two reboiler duties
(QR,RD and QR,STR), two condenser duties and one subcooling
duty, aqueous and organic distillate flow rates, organic reflux flow rate (R), and stripper bottoms flow rate. Similar to the control of the reactive distillation system, the alcohol feed flow is selected as the throughput manipulator and we are left with 11 manipulated variables.
In this EtAc-SRC process there are six inventory control loops required, which include control of four levels (the RD column base level, the organic phase level in the decanter, the aqueous-phase holdup in the decanter, and the stripper base level) and
two column pressures of the RD and stripping columns. Basic inventory and related loops are arranged in the following ways. Top pressures of two columns are controlled by manipulating the condenser duties. The decanter temperature is controlled by changing the chilled water flow. As for liquid inventories, except for the RD column base the remaining liquid levels are controlled by their liquid outlet flow as shown in Figure 17. For the RD column base level control we have three candidates: side draw flow (FSS), organic reflux flow (R), and reboiler duty
(QR,RD). Because the side draw flow has zero-gain effect on the
base level and the organic reflux flow gives slow dynamics,22
we choose the heat input of the RD column (QR,RD) to control
the base level. In doing this, we have four manipulated variables left: FSS, FHAc, R, and QR,STR.
After selecting the inventory controls, the remaining manipu-lated variables (HAc feed, organic reflux flow, and stripper heat duty) are used for maintaining stoichiometric balance and quality control: purity of the ethyl acetate and water. In the stripper the acetate product purity is controlled by the stripper heat input (QR,STR) and temperature is used to infer the product
composi-tion. From the RCM (Figure 1) the water purity is determined by the tie line of the liquid-liquid equilibrium, so it is left uncontrolled. In order to maintain the stoichiometric balance,
Table 2. Parameter Values of Steady-State Designs (RD, RD-SRT, and SRC)
flow sheet RD RD-SRT SRC
column configuration RD stripper column stripper column stripper
total no. of trays including reboiler 20 10 20 10 20 10
no. of trays in stripping section (NS) 9 9 9
no. of trays in reactive section (NRX) 11 1 1
no. of trays in rectifying section (NR) 9 19 19
reactive tray 0-10 0 0
acetic acid feed tray 0 0 0
alcohol feed tray 0 0 0
feed flow rate of acid (kmol/h) 50.80 50.80 50.80
feed flow rate of alcohol (kmol/h) 57.47 57.47 57.47
top product flow rate (kmol/h) 60.45 60.44 60.443
bottom product flow rate (kmol/h) 47.82 47.83 47.83
XD,aq m.f. acid 0.00001 0.00001 0.00001 m.f. alcohol 0.02182 0.0218 0.0217 m.f. acetate 0.01498 0.015 0.0149 m.f. water 0.96391 0.9631 0.9619 XB acid in ppm 100 100 100 m.f. alcohol 0.0091 0.0091 0.0091 m.f. acetate 0.9900 0.99 0.99 m.f. water 0.0008 0.0008 0.0008 condenser duty (kW) -4789.92 -1668.7 -5845.6 -1669 -4941.3 -1653.9 subcooling duty (kW) -881.45 -1030.0 -901.2 reboiler duty (kW) 5113.4 1979.1 6316.9 1979.4 5282.5 1962.4 column diameter (m) 2.043 1.37 2.35 1.37 2.27 1.36 Weir height (m) 0.1016 0.0508 0.1016 0.0508 0.1016 0.0508 decanter temperature (°C) 40 40 40
side reactor diameter (m) 0.8
side reactor length (m) 4
condenser heat transfer area (m2) 177.1 61.9 215.6 61.9 182.6 61.3
subcooling heat transfer area (m2) 179.96 210.3 183.99
reboiler heat transfer area (m2) 190.7 83.7 235.6 83.7 196.9 82.9
total capital cost ($1000) 2103.0 2325.0 2269.3
column 521.4 583.7 566.1
reactor 0 0 90.1
column trays 91.42 109.3 104.2
heat exchangers 1490.2 1632.1 1508.3
total operating cost ($1000/year) 656.10 993.2 672.5
catalyst cost 71.30 302.8 73.9
energy cost 584.90 690.3 598.6
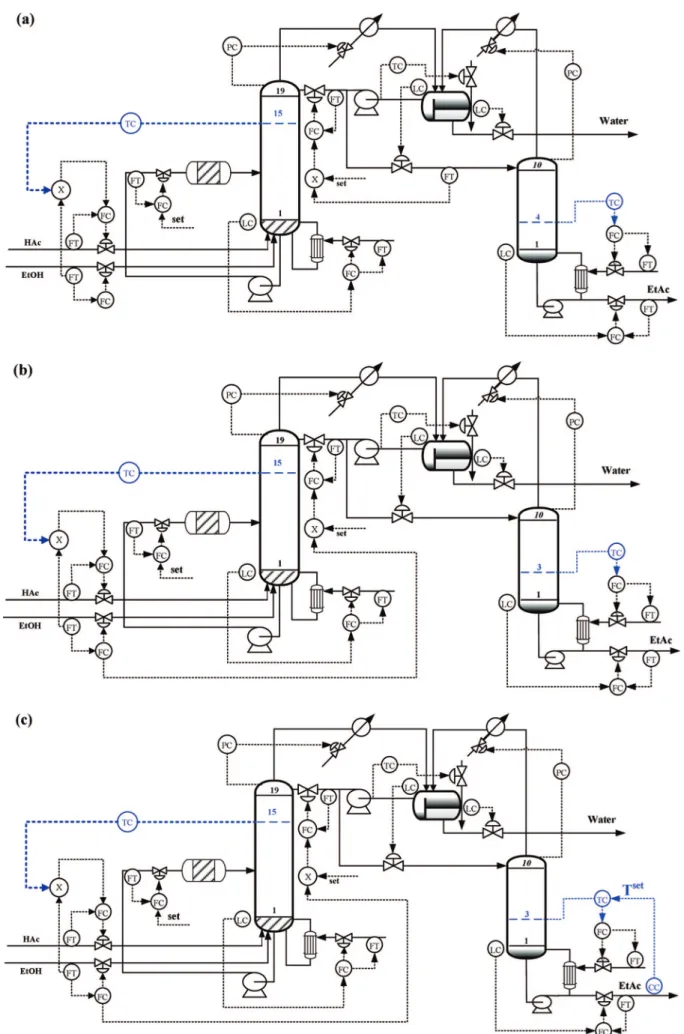
Figure 17. Control of the side reactor configuration (SRC) process: (a) CS1 (fixing RR), (b) CS2 (fixing R/F ratio), and (c) CS3 (CS2 with parallel cascade
we use a temperature control to adjust the feed ratio (FHAc/
FEtOH, FR). Thus, we have a 2× 2 multivariable system and,
from a unit-wise perspective, the pairing for the manipulated variables and the controlled variables are FR-TRD and
QR,STR-TSTR. Before getting into controller design, we have one
manipulated variable left, organic reflux flow rate (R). Two possible approaches can be taken: one is fixing the reflux ratio (RR), and the other is the ratio of the reflux to feed (R/FEtOH).
Therefore, we have two possible control structures: CS1 for keeping RR constant and CS2 for fixing reflux to feed ratio as shown in Figure 17.
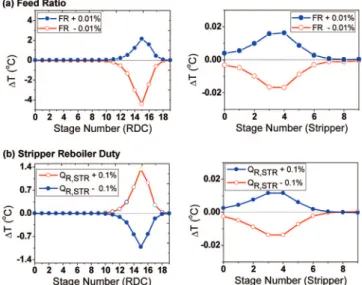
4.2. Selection of Temperature Control Trays. Sensitivity
analyses are performed for (0.01% variations in the corre-sponding manipulated variables (FR and QR,STR), and the results
are shown in Figure 18 for CS1 and Figure 19 for CS2. In both control structures an increase in QR,STRleads to a decrease in
the tray temperatures of the reactive distillation column due to a larger recycle flow rate for the reactive distillation column. As for the acid feed (FR) changes an increase in the heavy reactant results in the main column (RD column) tray temper-ature increase while the stripper tempertemper-atures show little
variation. At the completion of sensitivity analyses, the non-square relative gain (NRG23) is used to find the temperature
control trays in each column. The largest row sum of the NRG in each column is selected as the temperature control trays as shown in Figure 20. Note that the temperature control trays selected by the NRG are consistent with the most sensitive trays in Figures 18 and 19. The analyses select the temperature control trays: TRD,15and TSTR,4for CS1 and TRD,15and TSTR,3for CS2.
Next, the relative gain arrays are computed for variable pairing (Table 3). They give the following controller pairing: CS1,
FR-TRD,15, QRSTR-TSTR,4; CS2, FR-TRD,15, QRSTR-TSTR,3. 4.3. Controller Design. Once the decentralized control
structure is in place, dynamic simulations are performed using Aspen Dynamics. A third-order 0.5 min time lag is assumed for temperature measurement,24and a dead time of 5 min is
assumed for the composition analyzer. Liquid level is controlled using a proportional-only controller. Proportional-integral con-trollers are used for flow, pressure, composition, and temperature controls. Relay feedback tests25are performed on the
temper-ature loops to find the ultimate gains (Ku) and ultimate period
(Pu) of each temperature control loop, and initial controller
parameters are calculated according to Kc) Ku/3 andτI) 2Pu.
In order to obtain an acceptable damping, further detuning from the initial settings are required for some of the loops. Controller settings for all loops in CS1 and CS2 are summarized in Table 3.
4.4. Performance. The control performance is tested for feed
flow and feed composition disturbances (ethanol and acetic acid). Figure 21 shows the dynamic responses of CS1 and CS2 for (20% feed flow changes. The results show that the CS2 has fast (less than 5 h settling time) and symmetric responses, while the CS1 exhibits much slower (∼10 h) and oscillatory responses. The reason for that is that we have severe interaction between the two process units (RD and stripper) for CS1 as compared to that of the CS2. This can be seen in Figures 18 and 19 when one compares the RD temperature sensitivity for the stripper reboiler duty changes or in the RGA values in Table 3. It can also be seen that with temperature control (CS1 and CS2) steady-state errors exist for both product compositions by 0.05%
Figure 18. Sensitivities of tray temperatures for (0.1% manipulated
variables changes in CS1: (A) feed ratio changes and (B) stripper reboiler duty changes.
Figure 19. Sensitivities of tray temperatures for (0.1% manipulated
variables changes in CS2: (A) feed ratio changes and (B) stripper reboiler duty changes.
Figure 20. Row sums of NRG for RD column and the stripper for (a) CS1
error for 20% production rate changes. For HAc feed composi-tion disturbances ((5 mol %) and EtOH feed composicomposi-tion disturbances (-5 and -10 mol %) the CS2 still works very
well with fast responses (Figure 22). The results clearly indicate that instead of fixing the reflux ratio it is preferable to fix the reflux to feed ratio, CS2, for this dual-temperature control for
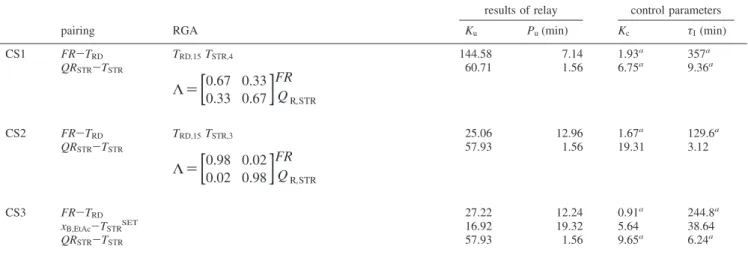
Table 3. Variable Pairing, Results from Relay Feedback Tests, and Final Controller Settings
results of relay control parameters
pairing RGA Ku Pu(min) Kc τI(min)
CS1 FR-TRD TRD,15TSTR,4 144.58 7.14 1.93a 357a QRSTR-TSTR Λ )
[
0.67 0.33 0.33 0.67]
FR QR,STR 60.71 1.56 6.75a 9.36a CS2 FR-TRD TRD,15TSTR,3 25.06 12.96 1.67a 129.6a QRSTR-TSTR Λ )[
0.98 0.02 0.02 0.98]
FR QR,STR 57.93 1.56 19.31 3.12 CS3 FR-TRD 27.22 12.24 0.91a 244.8a xB,EtAc-TSTRSET 16.92 19.32 5.64 38.64 QRSTR-TSTR 57.93 1.56 9.65a 6.24aaFurther detuning from the Tyreus-Luyben settings.
Figure 21. Load responses for (20% production rate changes using (a)
CS1 and (b) CS2.
Figure 22. Load responses for feed composition disturbances using CS2:
(a) (5 mol % HAc feed composition changes and (b) -5 and -10 mol % EtOH feed composition changes.
the side reactor configuration. More importantly, reasonable control performance can be obtained using simple temperature control to handle production rate and composition variations.
4.5. Extension to Composition Control. To eliminate the
steady-state offset in acetate purity, we also consider the composition control and use parallel cascade control; that is, the set point of the stripper temperature is reset by the output of the composition controller. Thus, we have one composition control, xB,EtAc-TSTRSET, and two temperature control,
QR,STR-TSTR and QR,RD-TRD, at constant R/FEtOH (named as
CS3, as shown in Figure 17). Again, relay feed back tests are performed to find the ultimate gains (Ku) and ultimate period
(Pu) of each control loop, and initial controller parameters are
calculated according to Kc ) Ku/3 andτI ) 2Pu. Controller
settings for all loops are summarized in Table 3. The control performance is tested for feed flow disturbance. Figure 23 shows the dynamic responses of 3 for (20% feed flow changes. The control performance of CS3 is quite similar to that of the temperature control (CS2) except that steady-state error in product purity is eliminated.
4.6. Compared to RD Temperature Control. The
steady-state economics of the side reactor configuration (SRC) is comparable to that of the reactive distillation (RD) while giving advantages in catalyst replacement and ease of maintenance. It will be interesting to see how the SRC dynamic behavior compared to that of the RD. Using the same control structure for both process configurations we compare the dynamic performance of SRC with that of RD. The CS2 have two temperature loops (QR,STR-TSTRand QR,RD-TRD) with a constant
reflux to feed ratio (R/FEtOH). The results, Figure 24, show that
the speeds of responses for the compositions are about the same for both configurations. Unitwise, the RD shows a little smaller settling time in the main column, while the stripper exhibits a similar settling time.
5. Conclusion
In this work, acetic acid esterification using ethanol is used to illustrate design of the side reactor configuration (SRC). The SRC offers a maintenance advantage as compared to conven-tional reactive distillation. Instead of simultaneous design for the SRC, a gradual transition from the reactive distillation (RD) to a single reactive tray column (RD-SRT) and then to the side reactor configuration is demonstrated. The results show that the SRC is economically competitive with only a 5% increase in TAC and has a simple flow sheet structure with one external side reactor plus a reactive column base. Finally, the operability of the SRC process is tested for feed flow and feed composition disturbances. The results show that reasonable control perfor-mance can be obtained using simple temperature control schemes and the dynamic behavior is comparable to that of the RD.
6. Appendix A: TAC Calculation
Evaluation of equipment cost follows the procedure of Douglas26 and the specific equations from earlier work.8 A
payback period of 3 years is assumed and a M&S index of 1108.1 is applied in the calculation. Materials of construction are stainless steel. The equipment is sized as follows.
(1) Reboiler heat transfer area (AR)
AR[ft2] ) QR
UR· ∆TR (A1)
where QR[Btuh] is the reboiler duty, the overall heat-transfer
coefficient UR is assumed to be 250 Btu/(h·ft2), and the
temperature driving force∆TR[°F] in the reboiler depends on
the steam temperature.
(2) Condenser heat-transfer area (AC)
AC[ft2] ) QC
UC· ∆TC (A2)
where QC[Btuh] is the condenser duty, the overall heat-transfer
coefficient UCis assumed to be 150 Btu/(h·ft2), and the
log-mean temperature driving force∆TC[°F] depends on the dew
points and bubble points for a total condenser. (3) Column length (LC)
LC[ft] ) 2.4NT (A3)
where NTis the total number of trays.The capital and operating
costs are calculated according to (1) Column cost and reactor cost column cost[$] )M & S
280 (101.9DC 1.066L
C
0.802(2.18 + F
C)) (A4) Figure 23. Load responses for (20% production rate changes using
temperature/composition cascade control (CS3) in the product purity loop.
Figure 24. Load responses for 20% production rate increase using CS2 for
where FC) FmFp) 3.67.
(2) Tray cost
tray cost[$] )M & S 280 (4.7DC
1.55
LCFC) (A5)
where FC) Fs+ Ft+ Fm) 1 + 1.8 + 1.7.
(3) Heat exchanger cost
heat exchanger cost[$] )M & S 280 (A
0.65
(2.29 + FC)) (A6) where FC) (Fd+ Fp)Fm) (1.35 + 0)3.75 for the reboiler and
FC) (Fd+ Fp)Fm) (1 + 0)3.75 for the condenser.
(4) Steam cost
steam cost[$ ⁄ year] ) $2.8 1000 lb×
(
QH
924)
(
8150 hyear
)
for RD column (A7) steam cost[$ ⁄ year] ) $2.281000 lb×
(
QH
969
)
(
8150 hyear
)
for stripping column (A8) (5) Cooling water costcooling water cost
[
$year
]
) $0.031000 gal(
1 gal 8.34 lb)
(
QC 30)
(
8150 h year)
(A9) (6) Catalyst costcatalyst cost[$] ) catalyst loading[lb] · 3.5$
lb (A10)
Acknowledgment
This work was supported by the China Petrochemical Development Corp., the Ministry of Economic Affairs, and National Taiwan University.
Abbreviations
EtOH ) ethanol EtAc ) ethyl acetate HAc ) acetic acid
FHAc) acid feed flow rate, kmol/h
FEtOH) alcohol feed flow rate, kmol/h
Fd) factor for design type
Fm) factor for radiant tube material
Fp) factor for design pressure
FR ) feed ratio (FHAc/FEtOH)
Fss) flow rate of sidestream, kmol/h
Keq) equilibrium constant for the hydrolysis reaction
Ku) ultimate gain
NRX) number of trays in the reactive section
NR) number of trays in the rectifying section
NS) number of trays in the stripping section
NSR) number of side reactors
Nss,r) location of sidestream return tray
NT3) total number of trays in the third column
NRG ) nonsquare relative gain array Pu) ultimate period
QR) reboiler duty, kW
R ) organic reflux flow rate, kmol/h R ) reaction rate, kmol/s
T ) reaction temperature, K
TRD) selected temperature control tray in RD column
TSTR) selected temperature control tray in stripper
TSTRSET) set point of TSTR
TAC ) total annual cost, $1000/year Wcat,bot) catalyst loading at column base
Wcat,RD ) all catalyst loading for the original RD column design
%Xeq) achieving percentage of equilibrium conversion
kF) forward rate constant, kmol/(s*kgcat)
kB) backward rate constant, kmol/(s*kgcat)
mcat) catalyst weight, kg
xi) mole fraction for each component i
Greek Symbols τI) integral time, min
Literature Cited
(1) Baur, R.; Krishna, R. “Distillation Column with Reactive Pump Arounds: An Alternative to Reactive Distillation”. Chem. Eng. Process.
2004, 43 (3), 435.
(2) Kaymak, D. B.; Luyben, W. L. Design of Distillation Columns with External Side Reactors. Ind. Eng. Chem. Res. 2004, 43 (25), 8049.
(3) Kaymak, D. B.; Luyben, W. L. Optimum Design of A Column/ Side Reactor Process. Ind. Eng. Chem. Res. 2007, 46 (15), 5175.
(4) Jakobsson, K.; Pyhalahti, A.; Pakkanen, S.; Keskinen, K.; Aittamaa, J. Modelling of a Side Reactor Configuration Combining Reaction and Distillation. Chem. Eng. Sci. 2002, 57 (9), 1521.
(5) Schoenmakers, H.; Buhler, W. Distillation Column with External Reactors - an Alternative to the Reaction Column. Chem. Ing. Tech. 1982,
54 (2), 163.
(6) Gadewar, S. B.; Tao, L.; Malone, M. F.; Doherty, M. F. Process Alternatives for Coupling Reaction and Distillation. Chem. Eng. Res. Des.
2004, 82 (A2), 140–147.
(7) Gangadwala, J.; Kienle, A. Minlp Optimization of Butyl Acetate Synthesis. Chem. Eng. Process. 2007, 46 (2), 107.
(8) Tang, Y. T.; Chen, Y. W.; Huang, H. P.; Yu, C. C.; Hung, S. B.; Lee, M. J. Design of Reactive Distillations for Acetic Acid Esterification.
AlChE J. 2005, 51 (6), 1683.
(9) Lai, I. K.; Hung, S.-B.; Hung, W.-J.; Yu, C.-C.; Lee, M.-J.; Huang, H.-P. Design and Control of Reactive Distillation for Ethyl and Isopropyl Acetates Production with Azeotropic Feeds. Chem. Eng. Sci. 2007, 62 (3), 878.
(10) Hangx, G.; Kwant, G.; Maessen, H.; Markusse, P.; Urseanu, I. Reaction Kinetics of the Esterification of Ethanol and Acetic Acid Towards Ethyl Acetate, Deliverable 22, Intelligent Column Internals for Reactive Separations (INTINT), Technical Report to the European Commission: 2001. (11) Renon, H.; Prausnitz, J. M. Local Compositions in Thermodynamics Excess Functions for Liquid Mixtures. AlChE J. 1968, 14, 135.
(12) Hayden, J. G.; O’Connell, J. P. A Generalized Method for Predicting Second Virial Coefficients. Ind. Eng. Chem. Process Des. DeV. 1975, 14 (3), 209.
(13) Yi, C. K.; Luyben, W. L. Design and Control of Coupled Reactor/ Column Systems 0.1. A binary coupled reactor/rectifier. Comput. Chem.
Eng. 1997, 21 (1), 25.
(14) Yi, C. K.; Luyben, W. L. Design and Control of Coupled Reactor/ Column Systems 0.2. More Complex Coupled Reactor/Column Systems.
Comput. Chem. Eng. 1997, 21 (1), 47.
(15) Yi, C. K.; Luyben, W. L. Design and Control of Coupled Reactor/ Column Systems 0.3. A Reactor/Stripper with Two Columns and Recycle.
Comput. Chem. Eng. 1997, 21 (1), 69.
(16) Al-Arfaj, M. A.; Luyben, W. L. Comparison of alternative control structures for an ideal two-product reactive distillation column. Ind. Eng.
Chem. Res. 2000, 39 (9), 3928.
(17) Al-Arfaj, M. A.; Luyben, W. L. Comparative control study of ideal and methyl acetate reactive distillation. Chem. Eng. Sci. 2002, 57 (24), 5039. (18) Kaymak, D. B.; Luyben, W. L. Quantitative Comparison of Reactive Distillation with Conventional Multiunit Reactor/Column/Recycle Systems for Different Chemical Equilibrium Constants. Ind. Eng. Chem. Res. 2004,
43 (10), 2493.
(19) Kaymak, D. B.; Luyben, W. L. Comparison of two types of two-temperature control structures for reactive distillation columns. Ind. Eng.
Chem. Res. 2005, 44 (13), 4625.
(20) Hung, S. B.; Lee, M. J.; Tang, Y. T.; Chen, Y. W.; Lai, I. K.; Hung, W. J.; Huang, H. P.; Yu, C. C. Control of different reactive distillation configurations. AlChEJ. 2006, 52 (46), 1423.
(21) Chiang, S. F.; Kuo, C. L.; Yu, C. C.; Wong, D. S. H. Design Alternatives for the Amyl Acetate Process: Coupled Reactor/Column and Reactive Distillation. Ind. Eng. Chem. Res. 2002, 41 (13), 3233.
(22) Chien, I. L.; Teng, Y. P.; Huang, H. P.; Tang Yeong, T. Design and control of an ethyl acetate process: coupled reactor/column configu-ration. J. Process Control 2005, 15 (4), 435.
(23) Chang, J. W.; Yu, C. C. The relative gain for non-square multivariable system. Chem. Eng. Sci. 1990, 45 (5), 1309.
(24) Luyben, W. L.; Tyreus, B. D.; Luyben, M. L. Plantwide Process
Control; McGraw-Hill, New York, 1998.
(25) Shen, S. H.; Yu, C. C. Use of Relay-Feedback Test for Automatic Tuning of Multivariable Systems. AIChE J. 1994, 40, 627.
(26) Douglas, J. M. Conceptual Design of Chemical Process; McGraw-Hill: New York, 1988.
ReceiVed for reView December 03, 2007 Accepted September 19, 2008