Statistical Methods for Targeted Clinical
Trials under Enrichment Design
Jen-Pei Liu,1,2* Jr-Rung Lin1
Background/Purpose: After completion of the Human Genome Project, disease targets at the molecular level can be identified. Treatment for these specific targets can be developed with the individualized treatment of patients becoming a reality. However, the accuracy of diagnostic devices for molecular targets is not perfect and statistical inference for treatment effects of the targeted therapy is biased. We developed statistical methods for an unbiased inference for the targeted therapy in patients who truly have the molecular targets. Methods: Under the enrichment design, for binary data, we propose using the expectation maximization (EM) algorithm with the bootstrap method, to incorporate the inaccuracy of the diagnostic device for detection of the molecular targets for inference of the treatment effects. A simulation study was conducted to empirically investigate the performance of the proposed estimation and testing procedures. A numerical example illustrates the application of the proposed method.
Results: Simulation results demonstrated that the proposed estimation method was unbiased, with adequate precision, and the confidence interval provided satisfactory coverage probability. The proposed testing proce-dure adequately controlled the size with sufficient power. The numerical example showed that a statistically significant treatment effect could be obtained when the inaccuracy of the diagnostic device was taken into account.
Conclusion: Our proposed estimation and testing procedures are adequate statistical methods for the inference of the treatment effect for patients who truly have the molecular targets. [J Formos Med Assoc 2008;107(12 Suppl):S35–S42]
Key Words: diagnostic accuracy, enrichment design, targeted treatment
As a result of recent insights into genomics and pharmacogenomics, molecular disease targets can be identified and utilized for treatment.1–5At the same time, diagnostic devices for detection of dis-ease using state of the art biotechnology such as microarray, polymerase chain reaction (PCR), mRNA transcript profiling, and single nucleotide polymorphisms, have also become possible. As a result, treatments specific for the patients with the identified molecular targets can be developed, and
patients benefit from the treatment without suf-fering serious or even fatal toxicity. Consequently, personalized medicine may finally become a reality.
Targeted therapy is a type of treatment that uses drugs or other means, such as monoclonal anti-bodies, against the identified molecular targets that are involved in disease pathogenesis. Targeted clinical trials are those that evaluate the efficacy and safety of targeted therapies.6 The current
©2008 Elsevier & Formosan Medical Association
. . . .
1Division of Biometry, Graduate Institute of Agronomy, National Taiwan University, Taipei, and 2Division of Biostatistics and Bioinformatics, National Health Research Institutes, Zhunan, Taiwan.
Received: July 30, 2008 Revised: September 17, 2008 Accepted: September 26, 2008
*Correspondence to: Dr Jen-Pei Liu, Division of Biometry, Graduate Institute of
Agronomy, National Taiwan University, 1, Section 4, Roosevelt Road, Taipei, Taiwan. E-mail: [email protected]
paradigm involves developing and evaluating a drug or a treatment using a shot-gun approach that may not be beneficial for most patients. On the other hand, targeted therapy employs a guided-missile approach to reach the molecular targets. For targeted therapy, therefore, one must have: (1) knowledge of the molecular targets involved in pathogenesis; (2) a device for detection of the molecular targets; and (3) a treatment aimed at the molecular targets. Thus, development of tar-geted therapies involves translation from the accuracy of diagnostic devices for the molecular targets to the efficacy and safety of the treatment modality for the patient population with the gets. Therefore, clinical trials for evaluation of tar-geted therapies are much more complicated than the current paradigm of clinical development. To address the issues of development of targeted therapies, the United States Food and Drug Admin-istration (FDA) issued the Draft Drug-Diagnostic Co-development Concept Paper7and In Vitro Diag-nostic Multivariate Index Assays,8in April 2005 and July 2007, respectively.
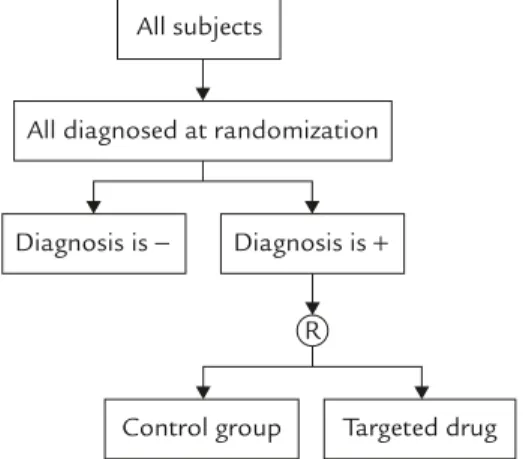
For targeted clinical trials, in addition to the usual inclusion criteria based on clinical signs, symptoms, and clinical laboratory results, the pres-ence of the molecular targets is one of the most important inclusion criteria. The enrichment de-sign9is one of the designs suggested in the FDA draft concept paper for targeted clinical trials. Figure 1 provides a diagram for enrichment design. Under the enrichment design, patients are screened
using the diagnostic device for identification of the molecular targets and only those with a posi-tive diagnosis for the molecular target are ran-domized to receive either the targeted treatment or the untargeted concurrent control. However, no diagnostic test is perfect with a 100% positive predictive value (PPV). In addition, measures for diagnostic accuracy such as sensitivity, speci-ficity, PPV, or negative predictive value (NPV) are in fact estimators with variability. Thus, the treat-ment effect of the targeted drug might be under-estimated in the patient population that truly has the molecular target.10 On the other hand, binary data such as response rate is one of the most frequently employed clinical endpoints for evaluation of treatment effect.
Therefore, under the enrichment design, we propose to apply the expectation maximization (EM) algorithm11,12with bootstrap method13to incorporate the uncertainty of the PPV of the diagnostic device for statistical inference of the treatment effect of the targeted drugs, with re-spect to the binary data. A simulation study was conducted to empirically investigate the perfor-mance of the proposed procedures in terms of the bias and coverage probability of confidence intervals (CI) for estimation, and size and power for hypothesis testing. A hypothetical numerical example constructed from real experience was used to illustrate the application of the proposed statistical method for the inference of the treat-ment effect of the targeted drug in the patient population that truly had the molecular target. Discussion and final remarks on the statistical inference of the targeted clinical trials are also provided.
Materials and Methods
First, we assume that specific molecular targets involved in pathogenesis have been identified. A diagnostic device available for detection of the identified molecular target has been developed. In addition, the diagnostic accuracy of the device has been evaluated and has met the regulatory
All subjects
All diagnosed at randomization
Diagnosis is − Diagnosis is +
Control group Targeted drug R
requirements. Furthermore, this device is used only for detection of the molecular target and not for prognosis. We then assume that a test drug is currently being developed for the specific molecular targets. Following the enrichment de-sign in Figure 1, a two-group parallel dede-sign is considered in which the patients with a positive result by the diagnostic device are randomized in a 1:1 ratio to receive either the molecular targeted test treatment (T) or a untargeted concurrent con-trol treatment (C). We further assume that the pri-mary efficacy endpoint is a binary variable such as response. A binary variable has two possible outcomes: responding or not responding to the treatment, with some response criteria prespeci-fied in the trial protocol. We further assume that the sample size is sufficiently large that normal approximation can be adequately applied.
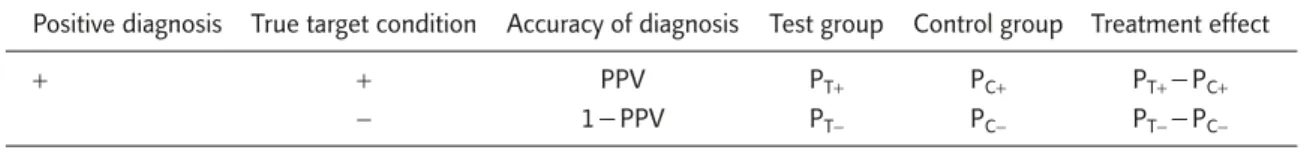
It should be noted that the PPV of a diagnos-tic test is an increasing function of the prevalence of the disease.14For a disease with a prevalence rate > 10%, even when sensitivity and specificity of the diagnostic device are 95%, its PPV can be as low as 68%. As a result, under the enrichment design, all randomized patients have a positive diagnosis, and the proportion of patients that are truly without the molecular targets can be quite high. Table 1 gives the true response rate by treat-ment and diagnostic result of the molecular tar-get. PT+, PC+(PT−, PC−) denotes the true unknown response rate of test and control groups for the patient population with (and without) the mo-lecular target. The treatment effect in the patient population truly with and without the molecular targets is represented respectively as: θ+=PT+− PC+, and θ−= PT−− PC−.
The target drug is developed specifically for the treatment of the patients that truly have the molecular target, therefore, the targeted drug is
only effective in the patient population that truly has the molecular targets, and is not effective or is less efficacious in those without the targets. Therefore, we assume that the treatment effect of the targeted drug in the patient population that truly has the molecular targets is greater than that without the targets, i.e. PT+− PC+> PT−− PC−.
As demonstrated above, under the enrichment design, some patients with a positive diagnostic result may in fact not have the molecular targets. The treatment effect obtained from the enrich-ment design consists of two components. The first component is the treatment effect of the tar-get drug in the patient population that truly has the molecular target. The second component is the treatment effect of the targeted drug in the patient population with a positive diagnosis, but who do not have the target. In other words: treat-ment effect obtained under enrichtreat-ment design = PPV(PT+− PC+) + (1 − PPV)(PT−− PC−) < PT+− PC+. It follows that the difference in sample pro-portions obtained under the enrichment design for targeted clinical trials in fact underestimates the true treatment effect of the target drug in the patient population that truly has the molec-ular target. However, the bias decreases as PPV increases.
There are two issues with the enrichment de-sign. The first is that although all randomized patients under the enrichment design have a positive diagnosis, because the diagnostic device is not perfect, some randomized patients do not have the molecular targets. Therefore, the responses of the patients to the targeted drug obtained in the enrichment design are a mixture of two dis-tributions: the responses of the patients who truly have the targets and the responses of those with-out the targets. Another issue is that the true sta-tus for the molecular target is in fact unknown
Table 1. Response rates by treatment and diagnosis
Positive diagnosis True target condition Accuracy of diagnosis Test group Control group Treatment effect
+ + PPV PT+ PC+ PT+−PC+
and missing. To resolve these two issues and to obtain an unbiased statistical inference for the patients who truly have the molecular targets, we apply the EM algorithm.11,12This is done to ob-tain the maximum likelihood estimator (MLE) for the treatment effect of the targeted drug in the patient population that truly has the targets. In addition, we employ the bootstrap method to estimate the standard error of the MLE obtained from the EM algorithm.13The PPV estimated for the diagnostic effectiveness trials for evaluation of the accuracy of the diagnostic device for detec-tion of the molecular target can be used as the initial value of the PPV for the EM algorithm. It follows that an unbiased inference, including point and interval estimation and hypothesis testing for the treatment effect of the targeted drug, can be made for the patient population that truly has the molecular targets. Technical details and an executive file of the Fortran program of our pro-posed methods can be obtained from the authors upon request.
To investigate the performance of our proposed statistical methods, we conducted a simulation study to empirically examine the relative bias and coverage probability for point and interval esti-mation, and size (type I error rate) and power for hypothesis testing. In addition, the proposed meth-ods are illustrated using hypothesized data con-structed from real experience.
Results
Simulation results
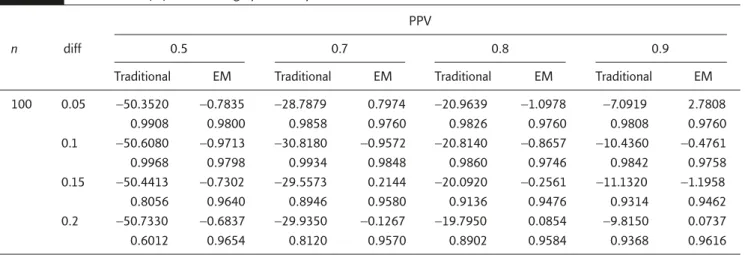
Table 2 presents the simulation results for com-parison between our proposed method and the traditional approach without consideration of the false-positive patients without the molecular targets on relative bias of the point estimator and the coverage probability of the 95% CI. As can be seen in Table 2, the traditional approach under-estimated the treatment effect. The relative bias of the traditional approach ranged from −50% when PPV was 0.5 to around −10% when PPV was 0.9. On the other hand, except for three cases for which the absolute relative bias was between 1% and 3%, all absolute relative bias of our proposed estimation procedure was within 1%. The cover-age probability of the 95% CI constructed by the traditional approach could be as low as 60%. The coverage probability of the 95% CI constructed by our proposed method was always above 95%. Therefore, with respect to estimation, our pro-posed method outperformed the traditional ap-proach. However, it should also be noted that the relative bias of the traditional method decreased and its coverage probability increased when the PPV increased.
Table 3 provides the empirical size of the tra-ditional method and our proposed method when PT+=PC+. When PT+− PC+=0, the statistical inference Table 2. Relative bias (%) and coverage probability
PPV
0.5 0.7 0.8 0.9
n diff
Traditional EM Traditional EM Traditional EM Traditional EM
100 0.05 −50.3520 −0.7835 −28.7879 0.7974 −20.9639 −1.0978 −7.0919 2.7808 0.9908 0.9800 0.9858 0.9760 0.9826 0.9760 0.9808 0.9760 0.1 −50.6080 −0.9713 −30.8180 −0.9572 −20.8140 −0.8657 −10.4360 −0.4761 0.9968 0.9798 0.9934 0.9848 0.9860 0.9746 0.9842 0.9758 0.15 −50.4413 −0.7302 −29.5573 0.2144 −20.0920 −0.2561 −11.1320 −1.1958 0.8056 0.9640 0.8946 0.9580 0.9136 0.9476 0.9314 0.9462 0.2 −50.7330 −0.6837 −29.9350 −0.1267 −19.7950 0.0854 −9.8150 0.0737 0.6012 0.9654 0.8120 0.9570 0.8902 0.9584 0.9368 0.9616
for the treatment effect of the targeted drug by the traditional and our proposed method was unbiased. The simulation results on empirical size given in Table 3 confirm this. The empirical sizes of both methods were very close to the nom-inal level of 0.05. In addition, the magnitudes of the empirical size were independent of the PPV. It follows that the traditional approach and our proposed method adequately controlled the type I error rate at the nominal level.
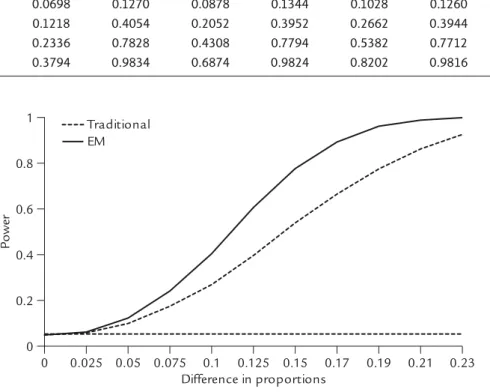
Table 4 gives the results for the empirical power of the traditional approach and our proposed method for the one-sided hypothesis of PT+> PC+ at different values of PT+− PC+. As demonstrated in Table 4, the empirical power of our proposed method was always larger than that of the tradi-tional approach at all values of PT+− PC+, irrespec-tive of the magnitude of PPV. Figure 2 provides a comparison of power curves between the two methods when PPV was 0.8. Table 4 and Figure 2 Table 3. Comparison of empirical sizes
PPV
n 0.5 0.7 0.8 0.9
Traditional EM Traditional EM Traditional EM Traditional EM
100 0.0518 0.0494 0.0506 0.0504 0.0492 0.0490 0.0508 0.0508 200 0.0554 0.0522 0.0502 0.0496 0.0532 0.0526 0.0514 0.0514 300 0.0492 0.0478 0.0518 0.0506 0.0494 0.0476 0.0482 0.0478 0 0.025 0.05 0.075 0.1 0.125 0.15 0.17 0.19 0.21 0.23 Difference in proportions 0 0.2 0.4 0.6 0.8 1 Traditional EM P ower
Figure 2. Empirical power curve when PPV was 0.8. Table 4. Comparison of empirical powers
e PPV
0.5 0.7 0.8 0.9
n diff
Traditional EM Traditional EM Traditional EM Traditional EM
100 0.05 0.0698 0.1270 0.0878 0.1344 0.1028 0.1260 0.1180 0.1346
0.1 0.1218 0.4054 0.2052 0.3952 0.2662 0.3944 0.3270 0.3944
0.15 0.2336 0.7828 0.4308 0.7794 0.5382 0.7712 0.6480 0.7634
show that our proposed method was uniformly more powerful than the traditional approach in assessment of the treatment effect of the targeted drug in the patient population that truly had the molecular targets.
Numerical examples
Herceptin® is a recombinant-DNA-derived human-ized monoclonal antibody for the treatment of metastatic breast cancer in patients whose human epidermal growth factor (HER2) receptor is over-expressed. One of the indications approved by the US FDA is the first-line treatment of metastatic breast cancer. The approval of this indication is based on the evidence provided by Study 3, which was a multicenter, randomized, open-label clinical trial in patients with metastatic breast cancer not previously treated with chemotherapy. The en-richment design was employed for Study 3, in which only patients with a staining score of 2+ or 3+ by immunohistochemistry were random-ized to receive chemotherapy plus Herceptin® (235 patients) or chemotherapy alone (234 pa-tients).15 The response rates for chemotherapy plus Herceptin® and chemotherapy alone were 45% and 29%, respectively (p< 0.001 for the difference between the response rates).
Based on the information provided by the US FDA package insert for Herceptin®, we assumed that the response rates for chemotherapy plus Herceptin® and chemotherapy alone are 45% and 30%, respectively, in patients with metastatic breast cancer with a staining score of 2+ or above. Based on this assumption, we generated a hypothetic
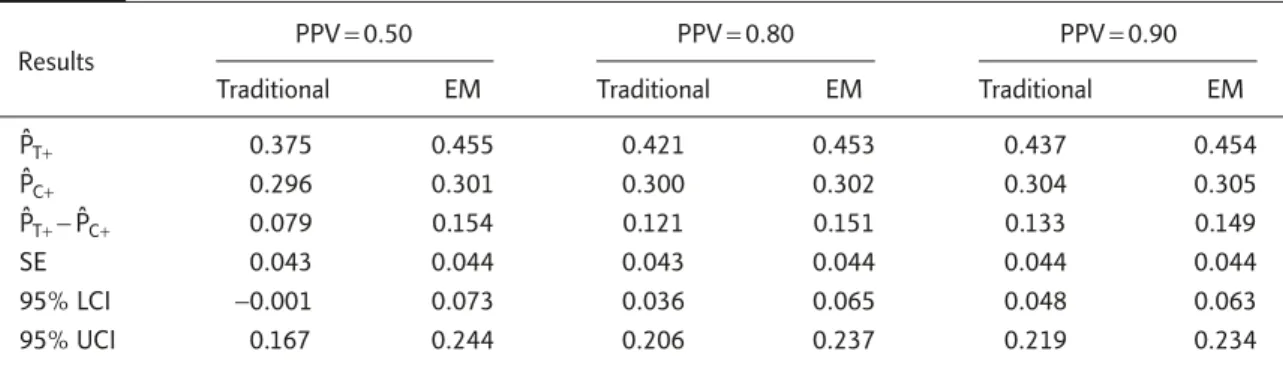
data set of responses for 480 patients: 240 for targeted drug and 240 for the concurrent control. Table 5 provides the point estimates of response rate, difference of response rates between the two groups, and standard error and 95% CI for the difference at various PPVs.
When PPV was 0.5, the traditional approach— when inaccuracy of diagnostic device was not considered—yielded estimated responses rates of 0.375 and 0.296 for the targeted drug and control, respectively. This gave an estimate of 0.0792 for the difference between the two groups with a 95% CI from −0.001 to 0.167. Since the 95% CI contained 0, the observed difference in response rates was not statistically significant and the targeted drug failed to prove its superior efficacy over chemotherapy alone at the 5% level. The reason for the failure of the targeted drug was that 50% of positive patients randomized did not have the molecular targets. This resulted in a −47.2% underestimation of the treatment effect and statistical nonsignificance. On the other hand, our proposed method provided the estimated response rates of 0.455 and 0.301, respectively, for the targeted drug and the control group. The estimated difference in response rates was 0.154, with a relative bias of 2.7%. The 95% CI for the difference in response rates was 0.073 and 0.244, which did not contain 0. As a result, it can be concluded that the efficacy of the targeted drug was superior to that of the control group, based on the response rate.
If PPV increased to 0.8, the traditional approach gave the estimated response rates of 0.421 and Table 5. Point and interval estimator of response rates
Results
PPV= 0.50 PPV= 0.80 PPV= 0.90
Traditional EM Traditional EM Traditional EM
PˆT+ 0.375 0.455 0.421 0.453 0.437 0.454 PˆC+ 0.296 0.301 0.300 0.302 0.304 0.305 PˆT+− PˆC+ 0.079 0.154 0.121 0.151 0.133 0.149 SE 0.043 0.044 0.043 0.044 0.044 0.044 95% LCI −0.001 0.073 0.036 0.065 0.048 0.063 95% UCI 0.167 0.244 0.206 0.237 0.219 0.234
0.300 for the targeted drug and control, respec-tively. This gave an estimate of 0.121, which is an underestimation of about −19.3%. The 95% CI for the difference in response rate was 0.036–0.206. Therefore, the targeted drug can be claimed effi-cacious by the traditional approach. It should be noted that the relative bias of the traditional ap-proach became less severe as PPV increased. On the other hand, the point estimates for individ-ual response rates and difference in response rates and 95% CI for the difference in response rates provided by our proposed methods were not in-fluenced by PPV.
Discussion
For a targeted clinical trial using the enrichment design, all randomized patients must have a pos-itive diagnosis for the molecular targets by the diag-nostic device. However, no device has a perfect diagnostic accuracy with 100% PPV. Therefore, a targeted clinical trial may randomize some false-positive patients who do not in fact have the molec-ular target. As a result, the traditional approach without consideration of inaccuracy of the diag-nostic device may produce a biased inference for the treatment effects of the targeted drug for the patient population that truly has the molecular target. Therefore, for the binary data, we apply the EM algorithm with the bootstrap method to incorporate information on the PPV for inference of the treatment effect in the patient population that truly has the molecular target. Simulation re-sults and numerical examples demonstrated that the proposed statistical method was not only un-biased in point and interval estimation, but also controlled the type I error rate at the nominal level and was uniformly more powerful than the tradi-tional method.
On the other hand, the inferential procedures for the treatment effects of the targeted drug based on the censored endpoints such as overall or progression-free survival in the patients who truly have the molecular target require further re-search. The Bayesian method is another approach
for incorporating the uncertainty in accuracy of the diagnostic device for the molecular target into the inference of the treatment effects of the targeted drug. For the Bayesian approach, one possible prior distribution for PPV is the beta distribution. How-ever, a study of the Bayesian approach to the in-ference of treatment effects in targeted clinical trials using the enrichment design is also urgently needed.
The discrimination power of a single individ-ual biomarker or allele is limited, therefore, a polygenic approach with the targeted treatment for multiple targets may be feasible for individu-alized treatment. However, diagnostic accuracy is one of the most important characteristics when it comes to determining the utility of the polygenic diagnostic device for identification of multiple targets in targeted clinical trials using the enrich-ment design. The reason for a negative result from the targeted clinical trial may not be the ineffec-tiveness of the targeted drug, but rather underes-timation of the treatment effect because of a low PPV, such that a large number of patients without the molecular targets were randomized into the targeted trial. For example, the PPV of the FDA-approved MammaPrint® is only 0.22 for metasta-tic disease at 5 years.16,17 Therefore, statistical methodology on the design and analysis of drug-device codevelopment of the polygenic approach for multiple targets requires urgent attention.
Disclaimer
The views expressed in this article are the per-sonal opinions of the authors and may not nec-essarily represent the position of the National Taiwan University and the National Health Research Institutes, Taiwan.
References
1. Simon R, Maitournam A. Evaluating the efficiency of targeted designs for randomized clinical trials. Clin Cancer Res 2004;10:6759–63.
2. Maitournam A, Simon R. On the efficiency of targeted clinical trials. Stat Med 2005;24:329–39.
3. Varmus H. The new era in cancer research. Science 2006;312:1162–5.
4. Dalton WS, Friend SH. Cancer biomarkers—an invitation to the table. Science 2006;312:1165–8.
5. Casciano DA, Woodcock J. Empowering microarrays in the regulatory setting. Nat Biotechnol 2006;24: 1103.
6. Liu JP. Targeted clinical trials. In: Chow SC, Cosmatos JT, eds. Translational Medicine: Strategies and Statistics
Methods. New York: Taylor & Francis, 2008:87–111.
7. The US Food and Drug Administration. Draft Concept
Paper on Drug-Diagnostic Co-Development. Rockville,
MD: US FDA, 2005.
8. The US Food and Drug Administration. Draft Guidance on
In Vitro Diagnostic Multivariate Index Assays. Rockville,
MD: US FDA, 2007.
9. Chow SC, Liu JP. Design and Analysis of Clinical Trials, 2ndedition. New York: Wiley & Sons, 2004:194–200.
10. Liu JP, Chow SC. Statistical issues on the diagnostic multi-variate index assay and targeted clinical trials, J Biopharm
Stat 2008;18:167–82.
11. Dempster AP, Laird NM, Rubin DB. Maximum likelihood estimation from incomplete data via the EM algorithm (with discussion). J Royal Statist Soc B 1977;39:1–38. 12. McLachlan GJ, Krishnan T. The EM Algorithm and
Extensions. New York: Wiley & Sons, 1997:40–80.
13. Efron B, Tibshirani RJ. An Introduction to the Bootstrap. New York: Chapman & Hall, 1993:39–82.
14. Fleiss JL, Levin B, Paik MC. Statistical Methods for Rates
and Proportions. New York: Wiley & Sons, 2003:7–8.
15. The US Food and Drug Administration. Annotated Redlined
Draft Package Insert for Herceptin®. Rockville, MD: US FDA,
2006.
16. Buyse M, Loi S, van’t Veer L, et al. Validation and clinical util-ity of a 70-gene prognostic signature for women with node-negative breast cancer. J Natl Cancer Inst 2006;98:1183–92. 17. The US Food and Drug Administration. FDA Decision