The Off-shoring Strategies Layout of Taiwan’s ICT/IT Industry in China
Ting Lin Lee
Department of Asia Pacific Industrial and Business Management, National University of Kaohsiung, Kaohsiung, Taiwan Abstract--Despite a lack of political understanding, the
economic relationship between Taiwan and mainland China is increasingly integrated and cooperative. Taiwan’s information and electronic industries have been investing in China since 1990; the range of investment began with early production activities, marketing activities after 1995 and then the fields of R&D. Taiwan has already become the largest source of trade deficit for Mainland China. Taiwanese enterprises have been distributed all along the economic corridor from Shanghai to Nanjing. Electronic information industry has gradually formed the cities’ pillar industries. By 2004, the cumulative contract value of Taiwan investments in Kunshan had reached 9 billion US dollars; while the actual investment exceeded 6 billion. The top 100 largest Taiwan enterprises have registered more than 150 companies in Kunshan, and 9 out of top 10 Taiwanese computer manufactures have established plants in Suzhou. First objective of this paper is to give a description of the industrial background, investment model and motivation factors which Taiwan’s IT/ICT manufacturers entered the Mainland market since 1990 with the viewpoint of evolution. The second objective of this study will expose how Taiwan raises its overall arrangement of off-shore strategies in China under the situation of co-opetition.
I. INTRODUCTION
This case study describes the commencement and transition of the off-shoring layout of Taiwan’s ICT/IT Industry in China with the viewpoint of co-evolution, and explains how Taiwanese government authorities proposed strategic policy to compete the rising of Mainland China, especially when facing the tendency toward internationalization and the rising production cost. This special study describes the general production situation whereby Taiwan IT manufacturers invest in Mainland China in recent years: It begins from the early production activity and has gradually extended to the both ends of the “smiling curve”. In other words, it refers to stretching over the front-end of R&D activity and the back-end of marketing activity. This case study aims to assess how Taiwan IT manufacturers launched investment patterns, the forms of division of labour, and the arrangements of production, R&D, and marketing, from the viewpoint of evolution.
II. THE PAST OF TAIWAN IT MANUFACTURERS ENTERING THE WEST MARKET
All the time the process of heading west (which here means the Mainland China market) for Taiwan IT manufacturers is “Deeds speak louder than words”, in consideration of politics and the intervention of policies. Taiwan’s information and electronic industries have been investing in China since 1990; the range of investment began
with early production activities, marketing activities after 1995 and then the fields of R&D. However, at present Taiwan has already become the largest source of trade deficit for Mainland China: 79.5% of the information hardware of Taiwan IT manufacturers was made in China and it involves more than 80% of the shipment value of Mainland China’s information hardware (FIND website, 2006[1]).
This study, following a research paper of the Institute for Information Industry (III) [2], will explore the background of the industry, the modes of investment and the driving factors, and then analyse the current situation of Taiwan IT manufacturers’ production, marketing and R&D arrangements in China, in this way predicting some trends of future development.
A. Industrial background
1990-1995: In Taiwan’s electronic information industry, the
manufacturers of desktop PCs components (case, power, mouse, keyboard, etc.) with lower price and higher manpower demand, aiming at lowering production costs, engage in the layout of the production base in Mainland China in the early 1990s, being attracted by plentiful and cheap production elements of Mainland China and relevant investment preferences.
1996-2000: As the low price tendency of PC becomes more
obvious day by day, manufacturers attempt to obtain economies of scale by large-scale factories in order to lower costs and compete with those who entered the market of South China beforehand; in this way making up for the inferiority of production costs as far as the latecomers are concerned. Meanwhile, under the political opposition of Taiwan and China, the Taiwanese government strongly recommends a “southwards policy”, encouraging Taiwan IT manufacturers to invest in Southeast Asia
2001-2005: 1) The excessively optimistic sales forecast for
the PC market in the first half of 2000 affects the large increase of stocks of mobile phone key components, the phenomenon of the dot.com bubble and the global IT market transforming from a growth period to a mature period. When facing the situation that the competition of prices of large international IT plants becomes progressively keener, in order to maintain space for profit-making, Taiwanese IT manufacturers who expanded production excessively in China launching price negotiations use the scale of order as chips on the one hand and on the other, retract the purchase right of components, discuss the scale and price of orders with the manufacturers of relevant components directly and then reduce the potential interests in ODM orders that Taiwan IT manufacturers accept, which greatly shrink
the profit-making of Taiwan IT manufacturers. 2) At the same time, because there is not much space left for price competition, IT manufacturers give up the strategies of contesting industrial ability and the competition via low prices, and then turn to focus on the R&D and marketing activities of market segmentation. Some components manufacturers strengthen progressively the recourse to inputs of their own brand in a situation where the profit-making space of ODM is limited. 3) In addition, after many international cases of merger and acquisition of local manufacturers in Mainland China, Taiwan’s IT manufacturer BenQ merges with the department of mobile telephone of Siemens in 2005; through this encouraging the global market share of Taiwan mobile phone industry to rise over 30% from 10%, and then obtaining the relevant intellectual property rights and international distribution. Therefore, BenQ begins to have its own brand.
B. Investment patterns
1990-1995: In the early stage, because the scale of the market
is not big in Mainland China and the management environment is strange, Taiwanese manufacturers of electronic information began production in ways like “the process of importing materials” according to the strategy of reducing production cost.
1996-2000: Though there are many investment limitations in
Mainland China, many Taiwanese IT manufacturers turned to building up factories there in the name of large shareholders through tax concessions. In addition, under the policy of foreign exchange controlled by Mainland China, in order to prevent too many funds from restrictive utilization, manufacturers engage in buying low and selling high for components and end products through trading firms in Hong Kong mostly, keeping a large number of profits to use overseas.
2001-2005: When facing the industrial policies in Mainland
China (e.g. setting up factories in local areas, limitations on domestic sales proportions, requirements for domestic purchase) and the foreign exchange control, etc., in order to raise market share in the Chinese market, large MNC plants strongly ask Taiwanese IT manufacturers to raise shipment volumes from the Mainland, as the foundation of the internal marketing quota. On account of “customer requests”, Taiwanese IT manufacturers increase the proportion of production in Mainland China by a wide margin. The thinking behind entering Mainland China for Taiwan’s IT manufacturers changes from “reducing production cost” to “the requirements of customers” under the pressure of the market.
C. The patterns of division of labour
1996-2000: After 1995, Taiwanese IT manufacturers shift the
base of production previously in Southeast Asia progressively to Mainland China. Therefore, the proportion of production in Mainland China rose from 14% in 1995 to 33% in 1999, but dropped to 31.3% in
2000. The products that Taiwan’s IT industry increase in the ratio of production in Mainland China mainly come from PC peripheral equipment such as monitors, CD-ROMs, cases, SPS, etc.
2001-2005: As international IT manufacturers require
Taiwanese manufacturers to increase shipment volumes from Mainland China after 2000, the proportion of production of Taiwan’s IT industry rises from 31.3% in 2000 to 47.5% in 2002 and to 79.5% in 2005; however, the proportion of production in Taiwan falls from 49.1% in 2000 to 35.7% in 2002 and to as low as 6.8% in 2005. Among the ways in which Taiwanese IT manufacturers divide the labour on both sides according to the mode of production, we find:
1) Since 2000, desktop PC related components and peripheral equipments of relatively low price shift to products that are relatively capital- and technology-intensive such as LCD displays, notebook computers, mobile phones, LCMs and so on.
2) The division of labour shifts from “high & low level products” before 2000 to “test-production and mass production”, which makes Taiwan’s IT manufacturers increase the production rate substantially in Mainland China.
3) Tracing its cause, the situation has something to do with the Mainland Chinese government being asked to improve operating efficiency by Taiwanese IT manufacturers and follow Taiwan’s experience to set up export processing zones and bonded factories, and by so doing improve import and export efficiency, and the inconvenient contact of R&D personnel on the two sides.
D. Geographical distribution
1990-1995: After Mainland China opens to reform, the
Government uses relevant industry policies, such as the huge “domestic- demand market” as a bait with foreign exchange control and the proportional limitation on domestic sales in order to attract manufacturers to set up their factory there. Because of the undeveloped infrastructure and high transportation charges in Mainland China, most international enterprises set up their factories in the coastal areas (such as Shenzhen in South China) and meanwhile utilize the cheap essential factor of production in Mainland China and the international freight transport and financial function in Hong Kong.
1996-2000: Because the scale of investment is very large, in
order to reduce operating risk and focus on the expansion of the local market in future, the PC peripheral manufacturers choose the East-China area where public security is good, China’s central government gives strong support, the government regulations are clearer and the geographical position is moderate.
2001-2005: The effect of early or late steps of economic
opening to the outside world in different regions and characteristics of the varied industries in North, East and
South part of the Mainland China.
1) North China area: Because the North China area is near the core of political power, it attracts international communications manufacturers which are closely related to national defence security and manufacturers of local desktop PCs which have to strive for government resources (including orders and funds). Except for Acer and DBTEL, there are few Taiwan manufacturers (like mobile-phone components) which cooperate with Motorola
2) East China area: In the East China area, the regulations and management environment are relatively clear. Besides, the geographical position benefits the logistics of each domestic region in the domestic-demand market, and the actions to attract business investment are positive, so those latecoming IT and wireless communication manufacturers which have a large scale of investment and focus on the local market are attracted to enter this area. The production bases of Taiwan’s LCD display, notebook computer, mobile phone, LCM and semiconductor manufacturers are mostly concentrated here.
3) South China area: Because the South China area is opened to the outside world early and the management environment is flexible, this area attracts numerous desktop PC manufacturers and consumer electronic manufacturers who regard lowering costs as necessary. Taiwan’s industries related to desktop computers are mainly concentrated here.
E. Cluster patterns
1990-1995: For Taiwanese IT manufacturers who set up
factories in the South China area, their ways of investment tend to be more conservative at the stage of testing the local management environment. In order to keep the present trading relationship and to exchange relevant industrial information, the industrial clusters are relatively concentrated and in addition, these manufacturers still maintain a cooperative relationship with Taiwanese manufacturers.
1996-2000: Taiwanese IT manufacturers who set up factories
in East China area have two different types of cluster. The first is setting up factories in the local industrial area alone by their own efforts; they aim to persuade relevant manufacturers to set up factories in the East China area for nearby supply in order to improve purchasing efficiency, but will not require a cooperation relationship with the suppliers. The second type is of assembly manufacturers choosing a large amount of land to establish the large-scale industrial areas and then ask the suppliers to be with them, maintaining the supply relationship under a long-term cooperative commitment.
2001-2005: The scale of investment of Taiwan IT
manufacturers becomes larger day by day and each local government in China solicits business positively under considerations of the development of the local economy and over-investment in industrial areas. They obtain a
large amount of industrial land through collective negotiation. The mode of ‘group-exclusive industrial area’ grows gradually.
F. Marketing arrangements
1990-1995: Because the scale of the Mainland IT market is
still small, the investments of Taiwan IT manufacturers prefer the mode of “the process of importing materials”; therefore, most products are for sale overseas.
1996-2000: Because a high growth rate of 20%~30% appears
in the Mainland PC market, some Taiwanese manufacturers already begin to accept ODM orders from the PC manufacturers in Mainland China. Though Taiwan’s manufacturers strive for a proportion of domestic sales, they still focus on the international market while selling.
2001-2005: With the growth of the Mainland IT market, the
proportion of products that Taiwan’s IT manufacturers sell to Mainland China also rises year by year, from 5.2% in 2000 to 11% in 2004. In 2005, because the American and European markets were enjoying booms, the amount of high-priced products, such as notebook computers and mobile phones exported to Europe, USA, Latin America and Southeast Asia becomes large, so that the proportion that Taiwan’s IT hardware manufacturers export to China falls to 7.4%.[2]
G. R&D arrangements
1990-1995: Taiwanese manufacturers focus on production
activities in the initial stage; and are rarely involved in the activities of marketing and R&D.
1996-2000: With the rising familiarity with the local
environment and talent, Taiwanese IT manufacturers begin to realize that if they move partial R&D activities to Mainland China, they can employ local project personnel who have basic science and engineering training with cheap wages, thus reducing manufacturing cost. In the early stage, Taiwan’s IT manufacturers adopted a division of labour mode for high/low product levels between Taiwan and Mainland China, in other words, the activities of R&D design were maintained in Taiwan, and the developing activities of process technology stayed in Mainland China.
2001-2005: In consideration of costs and management, most
Taiwanese IT manufacturers choose factory sites as the R&D centre; therefore most IT manufacturers distribute their factories across East and South China, only a few game and software manufacturers choose to set up factories in North China with fragmentary distribution. As the production rates of Taiwan’s IT manufacturers rise substantially in Mainland China, the patterns of division of labour of manufacture shift to the labour-division mode of test- and mass-production after 2000. In a situation where the two sides suppress ‘Three Direct Links’ across the Taiwan Straits for political reasons, the R&D activities of Taiwanese IT manufacturers in Mainland China shift quickly from the
stage of accessing mass production to the stage of product development. In this stage, Taiwanese engineers come and go on both sides of the Strait.
Among the largest-scale 500 foreign-capital enterprises for import and export in Mainland China in 2004, 249 were IT manufacturers, and 70 came from Taiwan; hence the proportion of Taiwan manufacturers was 28%. From the viewpoint of Taiwanese IT manufacturers’ contributions in Mainland China in 2004, the scale of imports and exports reached US$ 112.3 billion: The export value was US$62 billion and import value US$50.3 billion; the total favourable balance was up to US$11.7 billion, which represented 23.3% of the import value. If we compare this with the same sample group of 2002, we find there were 37 manufacturers which were on the list for the first time, and 23 of them were listed first in the group. All the information shows that the production scale of Taiwanese IT manufacturers in Mainland China has a tendency to expand gradually.
At the same time, if we analyse 33 Taiwanese IT manufacturers listed on board in 2002 and 2004, we find that though the import value rose to US$18.9 billion, since the export value was US$30.1 billion, a US$3.89 billion of unfavourable balance (24.6% of the import value) has already shifted to US$7.28 billion of favourable balance (20.9% of the import value), which shows that according to the trend
where large MNC plants ask Taiwan IT manufacturers to raise production proportions in Mainland China, the orders for export which originally created foreign exchange for Taiwan have already been quickly transferred to China.
III. THE EBB AND FLOW OF ELECTRONIC & ELECTRICAL INDIRECT INVESTMENT BETWEEN
TAIWAN AND MAINLAND CHINA
If we observe cases over the last five years, obvious changes appear in investment for Taiwan’s Electronic & Electric Application manufacturing in Mainland China and other countries: On the one hand, Taiwan’s investment cases and amounts reduced year by year except the outward investment in 2001; on the other, investment cases and amounts in Mainland China increased year by year (except cases of investment in 2004) and became twice as many as other areas (see Table 1).
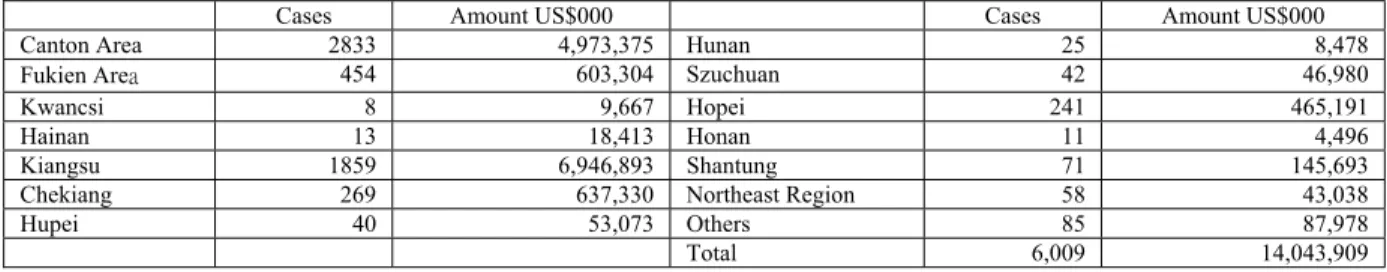
If we examine the distribution of the investment in Taiwan’s Electronic & Electric Appliances manufacturing in Mainland China, the Guangdong and Jiangsu areas are the strongholds where the manufacturing concentrates; the secondary areas are Fujian, Zhejiang and Hebei areas, etc. As for the distribution of other relevant electronic products in the Mainland China, see Table 2.
TABLE 1: ELECTRONIC & ELECTRICAL APPLICATIONS, APPROVED INDIRECT MAINLAND INVESTMENT AND OUTWARD INVESTMENT IN OTHER COUNTRIES, 1991-2004
Indirect Mainland Investment Outward Investment in other countries
Cases Amount, US$000 Cases Amount US$000
1991-1999 3,268 3,331,570 1,261 2,959,711 2000 343 1,464,775 376 640,414 2001 383 1,254,834 446 1,451,085 2002 789 2,618,684 305 534,998 2003 795 2,330,030 182 279,893 2004 431 3,044,016 187 1,146,752 Total 6,009 14,043,909 2,757 7,012,853 Source: [3] MOEA (2004: 54, 62)
TABLE 2: ELECTRONIC & ELECTRICAL APPLICATIONS, APPROVED INDIRECT MAINLAND INVESTMENT BY AREA, 1991-2004
Cases Amount US$000 Cases Amount US$000
Canton Area 2833 4,973,375 Hunan 25 8,478
Fukien Area 454 603,304 Szuchuan 42 46,980
Kwancsi 8 9,667 Hopei 241 465,191
Hainan 13 18,413 Honan 11 4,496
Kiangsu 1859 6,946,893 Shantung 71 145,693
Chekiang 269 637,330 Northeast Region 58 43,038
Hupei 40 53,073 Others 85 87,978
Total 6,009 14,043,909
Source: [3] MOEA (2004: 63-67)
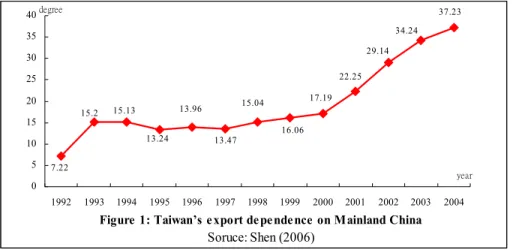
The degree of dependence on Taiwan’s exportation to China had reached 37.23% by 2004 (see Fig. 1), and the trade surplus exceeded $50 billion. The estimated amount of Taiwan’s investment in China is more than US$50 billion, which is more than 40% of Taiwan’s total foreign investments.
While the export dependence of Taiwan on China is
getting deeper than before on the one hand, the import dependence of China on Taiwan is decreasing on the other hand (Table3). For the Taiwanese electronic components industry in particular, the export dependence was 52.8% in 2004, representing a 2.09 point increase over the previous year.
Figure 1: Taiwan’s export dependence on Mainland China Soruce: Shen (2006) 37.23 34.24 29.14 22.25 17.19 16.06 15.04 13.47 13.96 13.24 15.13 15.2 7.22 0 5 10 15 20 25 30 35 40 1992 1993 1994 1995 1996 1997 1998 1999 2000 2001 2002 2003 2004 year degree
TABLE 3: DEGREE OF IMPORT/EXPORT DEPENDENCE BETWEEN TAIWAN AND MAINLAND CHINA Degree of import/export dependence Export dependence of
Taiwan on China
Import dependence of China on Taiwan
2003 2004 +/- 2003 2004 +/-
The Economic System 34.27 37.21 2.94 11.96 11.54 -0.42
Electronic Components 50.67 52.76 2.09 21.48 22.57 1.09
Manufacture 34.47 37.42 2.95 12.63 12.44 -0.19
Electronic Equipment (Radio, TV &
Communication) 13.06 13.88 0.82 8.56 7.31 -1.25
Source: [4],IDB/MOEA
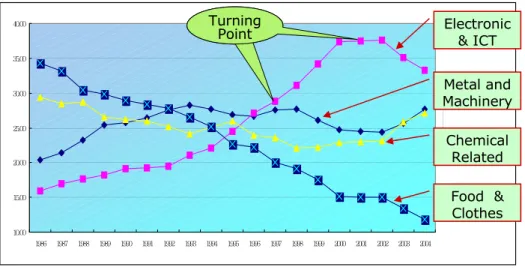
From Fig. 2a, the trend in electronic and IT investment in Mainland China is very clear. 1998 is the first turning point and 2001 is another one, with 1998 starting the expansion of IT and 2001 starting a contraction. At the same time, from Fig. 2b, the production value of electronics and IT has the
same trend. This implies that investing in Mainland China did not crowd out the production in Taiwan initially, at least in the electronics and IT area. However, it happened to crowd out the production in Taiwan from 2001.
0 20 40 60 80 100 120 1995 1996 1997 1998 1999 2000 2001 2002 2003 2004 Textile Apparel, Clothing & Accessories Paper & Printing Chemical Product Rubber Product Plastic Product Non-metallic Mineral Product Basic Metal Industry Machinery & Equipment Electronic & ICT Transport Equipment Precision & Optical Service
10.00 15.00 20.00 25.00 30.00 35.00 40.00 1986 1987 1988 1989 1990 1991 1992 1993 1994 1995 1996 1997 1998 1999 2000 2001 2002 2003 2004 金屬機械工業 資訊電子工業 化學工業 民生工業 Turning
Point Electronic& ICT
Metal and Machinery Chemical Related Food & Clothes Sources: MOEA Turning Point
Another set of statistics can show this big trend of Taiwan’s manufacturing stepping west into Mainland China. The proportion of “Accepting Orders in Taiwan and Manufacturing Abroad” rises to almost 40% in 2005 and even exceeds 70% in the ICT industry (see Table 4). The percentage of “Accepting Orders in Taiwan and Manufacturing Abroad” keeps creating new historically high records, which makes Taiwan’s trade surplus shrink gradually, and the trade deficit reduce gradually too. This is mainly because Taiwan’s ICT products such as mobile telephones,
WLAN equipment, DSL CPE and SOHO Routers, etc. are all regarded as mainly OEM/ODM production items. Taiwan’s manufacturers expand production scale in Mainland China and Southeast Asia in order to lower costs, get closer to markets or benefit from favourable tax policies. However, Taiwan’s authorities can encourage manufacturers to set up their headquarters in Taiwan and accept orders in Taiwan, in this way keeping added value in Taiwan; thus overseas production is only one of the global arrangement strategies.
TABLE 4: EXPORT ORDERS AND PERCENTAGES OF “ACCEPTING ORDERS IN TAIWAN AND MANUFACTURING ABROAD”
Year
Export Orders (US$ 100 million)
Percentage of manufacturing aboard
Total Electronics ICT
1999 1,274.7 12.24 % 9.18% 23.03% 2000 1,534.2 13.28% 8.03% 24.86% 2001 1,357.1 16.69% 13.34% 25.93% 2002 1,509.5 19.28% 15.09% 34.29% 2003 1,700.3 24.03% 20.11% 45.41% 2004 2,150.9 32.12% 29.55% 60.71% 2005 2,563.9 39.88% 37.05% 73.02% Source:[6] MOEA
Furthermore, when we divide products produced overseas by sector, we see from Fig. 3 that from 2001 the value has increased quickly. The turning point also matches the one found in Fig. 2b. In 1995, the percentage of production in Taiwan for information hardware manufacturing still remained 75%, the percentage of investment in overseas production in Mainland China was 14%, and in other foreign countries (mainly in Southeast Asia) was 11%. In 2000, the
percentage of production in Mainland China reached 31.3% and 19.6% in other foreign countries, and only 49.1% production was left in Taiwan. The percentage of Taiwan’s information hardware industry production going abroad (especially to Mainland China) increased year by year, and reached 79.5% in China and 13.7% in other countries by 2005, with only 6.8% remaining in Taiwan (see Figs. 4a and 4b).
Figure 3: Products produced overseas, 1997-2005 Source: TIER, 2005[7] 1.99 0.77 1.95 1.57 2 1.91 2.96 20.21 27.55 31.36 26.71 27.02 31.46 45.41 60.71 73.01 18.3 18.91 19.96 26.66 31.41 34.93 39.81 48.1 18.38 11.93 8.87 14.16 15.09 20.11 29.55 37 34.29 26.25 18.98 18 0 10 20 30 40 50 60 70 80 1997 1998 1999 2000 2001 2002 2003 2004 2005 year % chemical ICT products electrical machinery , supplies and equipment electronics turning point Source: MIC, 2006/3 China China China China China China Taiwan Taiwan Taiwan Taiwan Taiwan Taiwan 0% 10% 20% 30% 40% 50% 60% 70% 80% 90% 100% 1995 1996 1997 1998 1999 2000 year China Tailand Malaysia Others Taiwan
Source: MIC(ICT Country Report);2006/3
Note:Data are based on the shipment value and exclude the projectors
Ch in a Ch in a Ch ina China China Ch in a Others Others Others Others Others Others Taiwan Taiwan Taiwan Taiwan Taiwan Taiwan 0% 10% 20% 30% 40% 50% 60% 70% 80% 90% 100% 2000 2001 2002 2003 2004 2005 year China Others Taiwan
Fig. 4b: Overseas production by Taiwan's Information Hardware manufacturing, 2000-2005
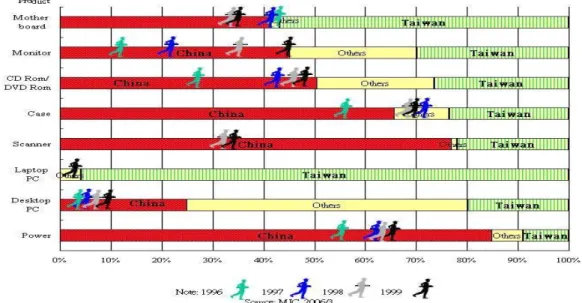
In 1999, the percentages of “power supply” and “casing” among the products of information hardware produced in Mainland China reached over 60%, “motherboard”, “monitor” and “CD Rom/DVD Rom” were around 35%-45%. It is worth noting that the laptop PCs were mainly produced in Taiwan in 2000 (95.8%), however after that, the production percentage of laptop PCs in Mainland China rose rapidly to reach 94% by 2005. The also happened with other information hardware products. For instance, the percentage of “CD Rom/DVD Rom”, and “Digital Camera” etc. produced in China was over 90%, and “motherboard” and “LCD monitor” also 80% (see Fig.s 5a and 5b). These two
Figures also show the transformation of information hardware products, with some products that show up in Fig. 5a for 1996-2000 not appearing again in Fig. 5b, such as LCD monitors, LCM, and digital cameras, etc.
To sum up, the impact of Mainland China on Taiwan’s ICT sectors can be divided into four stages over the past 10 years: 1) before 1997, mainly producing in Taiwan; 2) between 1997-2000, both Taiwan and Mainland China expanding; 3) between 2000-2002, expanding in Mainland China and keeping the same size in Taiwan; 4) after 2002, expanding in Mainland China and decreasing in Taiwan.
Fig.5b: Products produced overseas, 2000-2005
IV. POLICY SUGGESTIONS
In industrial policy, Mainland China has influenced demands in the local market for establishing infrastructure, drawing up technical standards (such as digital TV, TD-SCDMA, WAPI), installation fees and user fees for telecommunications (fixed line and mobile phones) and adjustments of household registration policy, etc., in order to support domestic manufacturers and negotiate with multinational plants. Meanwhile, on the one hand, the Government utilizes permissions to operate, the certification system, concessions for foreign investment, etc., in cooperation with policies of foreign exchange control, quotas on domestic sales and so on, to lead the local plants of MNCs to expand their local production scale continuously; on the other, it utilizes the cluster effect of local assembly industries to encourage the component industry to move in progressively by means of tax credits, proportions of domestic purchase, alternative tariffs, etc. Therefore, industrial policies play an important role in the development of ICT.
Freer and more open attitudes are necessary for Taiwan nowadays: First, the Government should cancel unnecessary restrictions on talent, funding and transportation in terms of the total planning of relevant preferential policies, actively introduce foreign technicians, and then open three direct cross-Strait links with moderate financial liberalization; these measures will encourage domestic and international enterprises to utilize Taiwan’s natural advantage of the Asian-Pacific Operation Centre to attract global resources and continuously improve the competitiveness of the
industrial environment.
In terms of active measures, as for the ICT industry which has entered Mainland markets extensively, an interview with III Adviser Chen Wen-Tang brought up the tactical thinking of “letting bulls into the wild, training calves and
entrapping cows”; that is to say, when facing ICT
downstream assembly manufacturers that consider factors of cost and market (“bulls industries” such as PC, Monitor, Notebook, cell phone, desktop, printer, scanner, keyboard, mouse, etc.), the Government should take an attitude of open freedom, letting them advance on the Mainland and seizing the market there. The ICT midstream industry, which refers to key components manufacturers for the needs of the “bull industries” (such as LCD, IC, battery, LED, RF, etc.), the key point for cultivating the “calves industry” depends on governmental policies. At present, except for fields/industries stipulated in the Statutes for Industrial Upgrading, there are no clear specific fields/industries setting foresight values. These midstream industries are just like growing calves; one should plant a lot of pasture, and foster it actively. Accordingly, Taiwan’s government should strategically encourage the development of core industries that suit Taiwan with preferential policies: such as encouraging and promoting R&D alliances and R&D service industries, providing high-quality information services, encouraging enterprises to develop toward R&D design, brand marketing and logistic services, etc., increasing its added-value, and keeping the “calves industry” in Taiwan. What the Taiwanese government recommends as “trapping” refers to the ICT upstream industry (“cows industry”) such as materials and equipment, which are much closer to encouraging foreign
manufacturers or large domestic plants to set up R&D centres; in this way strengthening high-level R&D design.
As for the communication industry, seeing that Mainland China discourages Taiwan manufacturers from setting up factories there out of considerations of national defence, the government should assist Taiwan manufacturers in developing new technological innovation and product integration ability, and grasping business opportunities of the telecommunication service industry by helping Taiwan manufacturers cooperate with indigenous manufacturers. As for the consumer electronic industry, with enormous assembly capability in Mainland China, Taiwan can make the best of a weak key component industry and grasp relevant market chances such as digital TV and DVD through supplying the raw materials.
Taiwan’s own information industry has developed rapidly in recent years, becoming one of the main motive forces in its economic development and making up, in a timely way, for the industrial gap left by the out-migration of labour-intensive industries. This has facilitated the smooth readjustment and transformation of Taiwan’s industrial structure and laid down a foundation for the development of the knowledge economy. Nevertheless, as said above, with the steady innovation of Internet technology and the deepening of applications of information, the ability to develop the knowledge economy can no longer be assessed on production value alone but must also take into consideration the influence of information application capability on overall national competitiveness.
When Taiwan’s ICT manufacturers invest on the Mainland, partial competition advantages will unavoidably flow
outward to the Mainland because of the diffusion effect in industrial value chain and the coattail effect among relevant industries. However, for Taiwan’s ICT manufacturers, investing on the mainland has become a current trend in consideration of globalization. Accordingly, Chinese on both sides must complement each other's efforts, strengthening the cooperation, integration and constructive competition of hi-tech industries, making good use of each’s advantages of talents, technology, capital and market and advancing the communication of hi-tech industries of two sides; by this bringing Taiwan and China into the global division of labor and regional co-operation system and this will help to fulfill the ideals of “co-sharing in resource and co-flourishing in economy” on both sides.
REFERENCES
[1] FIND (2006), March 8, 2006, FIND website, www.find.org.tw
[2] Kao, H-X (2006), Asia Market Opportunity, Taipei: MIC/Market Intelligence Center.
[3] MOEA (2004), Annual Report of Overseas Chinese and Foreign
Investment, Taipei: MOEA, pp. 54-67.
[4] Shen, R-J (2006), The Direction of Taiwan’s Industrial Development
under the Changing of Global Economy and trade, Speech Power point,
IDB/MOEA
[5] MOEA (2006), Economic Statistics, 2006/12/22 surfed on the website of MOEA:
http://2k3dmz2.moea.gov.tw/GNWEB/Indicator/indicator.aspx?menu=3 [6] MIC (2006), ICT Country Report, Taipei: MIC
[7] Lin, X-W (2005), The international competitive circumstance of
technology and industry, The conference of technology development and
policy, Taipei, 2005/8.
![Figure 3: Products produced overseas, 1997-2005 Source: TIER, 2005[7]1.990.771.951.5721.912.96 20.21 27.5531.3626.71 27.0231.4645.4160.7173.0118.318.91 19.9626.6631.4134.9339.8148.118.3811.938.8714.16 15.0920.1129.553734.2926.2518.9818010203040506070801997](https://thumb-ap.123doks.com/thumbv2/9libinfo/7415876.104565/7.918.139.782.147.509/figure-products-produced-overseas-source-tier.webp)