This article was downloaded by: [National Chiao Tung University 國立交通大學]
On: 30 April 2014, At: 18:58
Publisher: Taylor & Francis
Informa Ltd Registered in England and Wales Registered Number: 1072954 Registered office: Mortimer
House, 37-41 Mortimer Street, London W1T 3JH, UK
Journal of the Air & Waste Management
Association
Publication details, including instructions for authors and subscription information:
http://www.tandfonline.com/loi/uawm20
Direct Field Observation of the Relative Humidity
Effect on the
β-Gauge Readings
Chuen-Jinn Tsai
a, Chung-Tso Chang
a& Cheng-Hsiung Huang
b aInstitute of Environmental Engineering, National Chiao Tung University , Hsinchu ,
Taiwan , Republic of China
b
Department of Environmental Engineering and Health, Yuanpei University of
Science and Technology , Hsin Chu , Taiwan , Republic of China
Published online: 29 Feb 2012.
To cite this article: Chuen-Jinn Tsai , Chung-Tso Chang & Cheng-Hsiung Huang (2006) Direct Field Observation of the
Relative Humidity Effect on the β-Gauge Readings, Journal of the Air & Waste Management Association, 56:6, 834-840,
DOI:
10.1080/10473289.2006.10464498
To link to this article:
http://dx.doi.org/10.1080/10473289.2006.10464498
PLEASE SCROLL DOWN FOR ARTICLE
Taylor & Francis makes every effort to ensure the accuracy of all the information (the “Content”)
contained in the publications on our platform. However, Taylor & Francis, our agents, and our licensors
make no representations or warranties whatsoever as to the accuracy, completeness, or suitability for any
purpose of the Content. Any opinions and views expressed in this publication are the opinions and views
of the authors, and are not the views of or endorsed by Taylor & Francis. The accuracy of the Content
should not be relied upon and should be independently verified with primary sources of information.
Taylor and Francis shall not be liable for any losses, actions, claims, proceedings, demands, costs,
expenses, damages, and other liabilities whatsoever or howsoever caused arising directly or indirectly in
connection with, in relation to or arising out of the use of the Content.
This article may be used for research, teaching, and private study purposes. Any substantial or systematic
reproduction, redistribution, reselling, loan, sub-licensing, systematic supply, or distribution in any
form to anyone is expressly forbidden. Terms & Conditions of access and use can be found at
http://
www.tandfonline.com/page/terms-and-conditions
Direct Field Observation of the Relative Humidity Effect on
the
-Gauge Readings
Chuen-Jinn Tsai and Chung-Tso Chang
Institute of Environmental Engineering, National Chiao Tung University, Hsinchu, Taiwan, Republic
of China
Cheng-Hsiung Huang
Department of Environmental Engineering and Health, Yuanpei University of Science and
Technology, Hsin Chu, Taiwan, Republic of China
ABSTRACT
The effect of ambient relative humidity (RH) on hourly particulate matter (PM10) readings of -gauge monitors has been studied using two collocated monitors in the field. The inlet air of monitor 1 was conditioned with water vapor to increase its RH, whereas monitor 2 oper-ated normally in ambient conditions. Experimental data showed that PM10readings of monitor 1 were nearly the same as monitor 2, as long as the RH of its conditioned incoming air did not exceed⬃80–85%. However, when the RH exceeded⬃80–85%, PM10readings of monitor 1 became higher than monitor 2, and the difference in-creased with increasing RH. The measurement of pressure drop across the filter was also conducted, and the data revealed that the increase of pressure drop per unit of PM10concentration decreased when RH was higher than ⬃80–85%, as compared with the case when RH was lower than 80 – 85%. This is perhaps because of more porous structure of deposited particles in the -gauge monitor when RH is greater than⬃80–85%. The theoretical cal-culation using an evaporation model and a thermody-namic model has been conducted to simulate the-gauge readings. The results show that the theoretical PM10 con-centrations using the evaporation model are in better agreement with the actual -gauge readings than those using the thermodynamic equilibrium model.
INTRODUCTION
The automatic Wedding -gauge particulate matter (PM10) monitor is one of the most popular semi-real-time aerosol monitors to measure hourly PM10concentrations
in the ambient air. The Wedding -gauge PM10 system has a cyclone as the PM10inlet, and the flow rate is 18.9 L/min. It is an equivalent method for PM10monitoring as designated by the U.S. Environmental Protection Agen-cy.1The-gauge method is based on the attenuation of  particles as they pass through the filter tape and its col-lected particles. Before a sampling cycle begins, the car-bon-14 source of the monitor emits particles through a reference position of the blank filter tape. After detecting the initial or background count rate through the blank tape, the tape is moved to the sampling position under the inlet exhaust tube, and a sampling cycle begins.2After 54 min of the sampling cycle, the sampling manifold opens, and the filter tape with collected particles is re-turned under the carbon-14 source. When the sampling manifold closes, the source emits  particles again to measure the attenuation count rate because of the pres-ence of collected particles. By calculating the differpres-ence of the attenuation count rates before and after sampling, the PM10concentration in that hour can be obtained.
Because of the frequent occurrence of high relative humidity (RH) in the ambient air of Taiwan, Taiwan En-vironmental Protection Agency is concerned about the influence of RH on the PM10 readings of the automatic Wedding -gauge PM10 monitors. Chang et al.3 con-ducted a field study at four monitoring stations in Taiwan and found that the PM10concentrations of the Wedding  gauge were quite close to the measured values of the manual high-volume samplers when the ambient RH was lower than the deliquescence RH (DRH) of aerosols. How-ever, when the DRH was exceeded, the PM10 concentra-tions of the gauge were found to be higher than those of the manual high-volume sampler, and the differences increased with increasing ambient RH. The experimental PM10 concentration ratio of the  gauge to the high-volume sampler was further compared with the theoreti-cal ratio assuming that the water content theoreti-calculated by the ISORROPIA thermodynamic model4was entirely as-sociated with the collected particles of the-gauge mon-itor, and there was no water evaporation loss during sam-pling. The results show that the thermodynamic model overpredicts water content in particles of the -gauge monitor. Chang and Tsai5further developed an evapora-tion model to determine water evaporaevapora-tion loss from IMPLICATIONS
-Gauge monitors are widely used in ambient particle mea-surement. The effect of the ambient RH on the -gauge reading has to be investigated more carefully, especially in monitoring locations where the RH is high. This study pro-vides direct evidence of the influence of the RH on the readings and shows that the influence is small when the RH is less than⬃80–85%. However, when the RH is greater than⬃80–85%, then the -gauge monitor will overpredict the PM10concentrations.
collected particles on the filter tape of the gauge during the sampling process and in the monitoring room for monitors that are operated in an air-conditioned room. The results show that the evaporation model is more accurate than thermodynamic model, and the simulated -gauge PM10concentrations are close to the actual read-ings. Remaining water in particles explains the reason why the-gauge readings are higher than the concentra-tions of the high-volume sampler when the RH is higher than⬃85%, and the differences increase with increasing ambient RH.
In some cases, -gauge monitors are located in the field instead of inside fixed monitoring stations. Under ambient conditions, it is worthwhile to know whether RH still has an effect on the readings. In this study, we aim at providing direct evidence of the humidity effect on the hourly-gauge PM10 readings for the monitors exposed to the field conditions. We compared the hourly readings of two collocated Wedding-gauge monitors: the incom-ing air of monitor 1 was conditioned with water vapor so that its RH was higher than that of monitor 2. The PM10 readings and the pressure drop across the filter of both -gauge monitors were measured at different ambient RHs. The theoretical PM10readings using an evaporation model and a thermodynamic model were also calculated to compare with the PM10-gauge readings obtained in the present study.
In the filter sampling process, interparticle and gas-particle interactions and the dissociation of semivolatile species occur, which create sampling artifacts.6 –9 These sampling artifacts are assumed to cancel out between two identical-gauge monitors in this study. Therefore, any difference found in the study will result from different
amount of water absorption and evaporation between two-gauge monitors operating at different RHs.
EXPERIMENTAL WORK
Two Wedding-gauge monitors, monitor 1 and 2, were collocated on the fourth floor of the Institute of Environ-mental Engineering, National Chiao Tung University (NCTU), which is 8.5 m above the ground. The campus of NCTU is close to Hsinchu city, which is 104 km2in area with a population of⬃350,000. This typical urban city in Taiwan is loaded with cars on the streets and is renowned for its high-tech semiconductor and optoelectronic indus-tries. The city is located in the northern part of Taiwan and close to the western coast of the island.
Figure 1 shows the experimental setup. The incoming air of monitor 1 was conditioned with water vapor at the inlet by fine deionized water mist generated by an im-pinger or an ultrasonic atomizing generator (Ultrasonic nozzle, Model 8700, Sono-Tek Inc.) to increase its RH while monitor 2 was operated as usual. The flow rate of fine water mist was adjusted to be 0.5 L/min, which was much smaller than the-gauge flow rate. The generated water vapor was filtered before introducing it into the inlet to remove residual particles that might influence the readings of monitor 1. The hourly PM10 concentration and the pressure drop of the two monitors were recorded and compared. There are total of four test periods gener-ating 36 hourly PM10datasets. The first two test periods were run from 3:00 p.m. on May 24 to 7:00 a.m. on May 25 and from 4:00 p.m. on May 26 to 8:00 p.m. on May 27, 2002. During these two periods, the ambient RH (or the RH of monitor 2) ranged from 62.5% to 82.8%, and the Figure 1. Setup of the field experiment for the influence of RH on hourly PM10readings between two Wedding-gauge monitors.
Tsai, Chang, and Huang
RH of monitor 1 was raised 5.3– 8% higher than the am-bient RH. Most of the time the RH of monitor 1 was ⬍85%, and only occasionally it exceeded 85%. In the last two test periods, the RH of monitor 2 was intentionally increased to a value ⬎90% by generating more water vapor using the ultrasonic atomizing generator. The tests were run from 4:00 to 12:00 p.m., June 23, and from 4:00 to 12:00 p.m., June 24, 2002, at which time the ambient RH (or the RH of monitor 2) ranged from 71% to 79.2%, and the RH of monitor 1 was 16.1–22.9% higher than the ambient RH.
During the studies, the aerosol size distributions were measured by a Micro-Orifice Uniform Deposit Impactor (Model 100, MSP Corp.) using Teflon filters as substrates, and the distributions were found to be bimodal. The ion concentrations were determined by ion chromatography (Model 4500i, Dionex Corp.). For example, in the test period of May 24 –25, the mass median aerodynamic di-ameter and geometric standard deviation of fine and coarse particles were measured to be 0.47 and 3.10m and 1.19 and 1.54m, respectively. The ion concentra-tions of sodium, chloride, nitrate, sulfate, and ammo-nium were found to be 0.93, 1.64, 4.1, 7.91, and 2.87 g/m3, respectively. Results of the size distribution pa-rameters and ion concentrations of all sampling periods are shown in Table 1. The size distribution and ion con-centration data were used in the theoretical modeling of the hourly-gauge readings.
On June 26, 2002, a test was further conducted to see whether the differences in PM10readings of the two monitors were caused by different amounts of water vapor absorbed in the glass fiber filter tapes when the RHs of the two monitors were different. Ambient aero-sol particles were removed entirely by replacing the PM10inlets of both monitors with 47-mm filter holders while keeping the RHs of two monitors different. The ambient RH ranged from 73.7 to 96.5%, and the RH of monitor 1 ranged from 78.2 to 100%. As will be shown later, test results show that both monitors indicated zero PM10 concentrations, which pointed out that wa-ter absorption on the glass filwa-ter tapes did not affect -gauge readings in this study. All of the differences in the PM10 readings of the two monitors resulted from different amounts of water vapor absorbed on the col-lected particles.
Theoretical Methods
Two methods were used in this study to predict the -gauge readings: ISORROPIA thermodynamic model4 and evaporation model. ISORROPIA is a model that cal-culates the composition and phase state of an ammonia-sulfate-nitrate-chloride-sodium-water inorganic aerosol in thermodynamic equilibrium with gas-phase precur-sors. The ion concentrations determined in this study and shown in Table 1 were used to calculate the water con-tent, which is assumed to be associated with the collected particles of the -gauge monitor, and there is no water evaporation loss during sampling. The theoretical-gauge PM10 reading is the sum of the water content and the “dry” PM10 concentration, determined by the -gauge when the RH is low, typically⬍80%. In the evaporation model, the evaporated water mass during sampling was calculated based on the work of Cheng and Tsai8 and Chang and Tsai.5 The evaporated water mass was de-ducted from the PM10concentration determined by the thermodynamic model. According to the model,8the sat-uration ratio of water vapor concentration at the down-stream of the filter, Sout, can be calculated as:
Sout⫽ ⫹ 4␣ 䡠 exp共兲 ⫺ 共Sin⫺ x兲 关共1 ⫹ ␣兲2exp共␣兲 ⫺ 共1 ⫺ ␣兲2exp共⫺␣兲兴 (1) ␣ ⫽
冑
1⫹ 4␦ n䡠 Pe ⫹ 24共1 ⫺ε兲Sh Pe2 (2)  ⫽n䡠 Pe2 (3) ⫽ 1 1⫹ ␦ 䡠 Pe 6n共1 ⫺ε兲Sh (4)where n is the ratio of dust cake thickness to the diameter of the particle, L/Dp; Sin is the saturation ratio of water vapor at the upstream of dust cake; ␦ is the ratio of pressure drop across the particle bed to the pressure at the upstream of the sampler,⌬P/P0;εis the porosity of dust cake; Shis Sherwood number; and Peis Peclet number.
The evaporated mass of water, mev1, of the collected particles during the sampling period,⌬tA, can be found as: Table 1. Size distribution parameters and ion concentrations.
Concentration
(g/m3) Sodium Chloride Nitrate Sulfate Ammonium
MMAD (m) g May 24–25 0.93 1.64 4.10 7.91 2.87 Fine-0.47 1.19 Coarse-3.1 1.54 May 26–27 1.37 2.30 3.91 9.24 4.14 Fine-0.41 1.31 Coarse-3.6 1.64 June 23 0.36 0.83 2.73 3.85 1.34 Fine-0.25 1.45 Coarse-3.2 1.51 June 24 0.47 1.23 3.18 4.26 2.29 Fine-0.21 1.39 Coarse-2.9 1.47 MMAD⫽ mass median aerodynamic diameter; g⫽ geometric standard deviation.
mevl⫽ e 䡠 共Sout䡠 Qout⫺Sin䡠 Qin)䡠 ⌬tA (5) where Qout⫽ Qin/(1⫺ ␦) is the flow rate at the down-stream of dust cake; Qinis the flow rate at the upstream of dust cake; andeis the saturation concentration of water vapor.
During filter sampling, water evaporation is calcu-lated based on the pressure drop,⌬P, through the particle cake, which can be calculated as:
⌬P ⫽ K2 䡠 W 䡠 Vf (6)
K2⫽ K2,st 䡠 RR⫺ H (7) where K2 is the dust cake resistance constant; W is the mass area density of cake; and Vfis the face velocity. The flow resistance, K2, can be found by multiplying K2,st, corrected by a correction factor RR⫺ Hbased on the Hap-pel’s cell model.
For the monitor exposed to the ambient air at field, the evaporation loss of particle-bound water also occurs when the sampling manifold is opened before counting. The total evaporated water mass, mev2, of the collected particles during counting, ⌬tB, can be shown as5
mev2⫽
冉
e2n⫺ 1 e2n⫹ 1冊
共1 ⫺ SB兲 eD Dp A⌬tB (8) ⫽冑
6共1 ⫺ε兲Sh (9) where SB is the saturation ratio of water vapor; A is the filtration area; D is the diffusion coefficient of water va-por; and Dpis the particle diameter.In the evaporation model, the evaporated water mass is the sum of mev1and mev2, which is deducted from the PM10 concentration determined by the thermodynamic model to obtain the theoretical-gauge reading.
RESULTS AND DISCUSSION
Influence of RH on PM10Readings
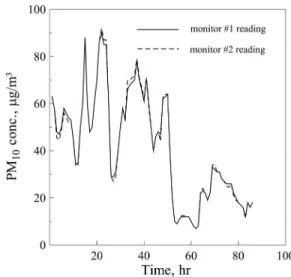
When both -gauge monitors were not conditioned by water vapor, the PM10readings of the two-gauge mon-itors from May 19 –22, 2002, were nearly the same, as shown in Figure 2. The difference in the PM10readings averaged only⫾6.9%. During the test, ambient tempera-ture ranged from 22.1 to 26.8 °C, and ambient RH ranged from 67.5 to 87.3%. However, when monitor 1 was con-ditioned with water vapor, its readings became different from those of monitor 2, as shown in Figure 3, for the data from May 24 –25, 2002. The inlet RH of conditioned mon-itor 1 is 5.3– 8.0% higher than that of monmon-itor 2, and the highest RH occurred at 5:00 – 6:00 a.m., May 25, which is 89.3% for monitor 1 and 82.8% for monitor 2. The inlet temperature from 22.5 to 26.8 °C is nearly the same for the two monitors. Experimental data show that PM10 readings of the two monitors are nearly identical when the RH of monitor 1 is less than ⬃82.1% (12:00–1:00 a.m.) but higher than that of monitor 2. The difference of the PM10readings of the monitors averages⫾1.5% during
the test period. Higher PM10 readings of 9.2% are ob-served in monitor 1 when its RH is⬎85.1% at 2:00–3:00 a.m., and the difference increases to 16.8g/m3(or 22.4% higher) at 5:00 – 6:00 a.m. when the RH of monitor 1 is peaked at 89.3%. The readings of both monitors become the same again as the RH of monitor 1 drops to 75.1%, although it is still 1.9% higher than the ambient RH (or RH of monitor 2). Similar results were obtained when the experiment was repeated from May 26 –27, that is, differ-ences in the PM10 readings only exist when the RH of monitor 1 is higher than ⬃80–85%. Below that, no sig-nificant differences in PM10concentrations between the two monitors are found.
When the RH of monitor 1 was raised to a value ⬎90% by the ultrasonic atomizing generator, its PM10 readings became much higher than those of monitor 2 as shown in Figure 4 for the data obtained on June 23, 2002. Similar data were obtained on June 24, 2002. In Figure 4, Figure 2. PM10readings, RH, and temperature vs. time for two
-gauge monitors, May 19–22, 2002.
Figure 3. PM10readings, RH, and temperature vs. time for the
-gauge monitors with or without water vapor conditioning, May 24 –25, 2002.
Tsai, Chang, and Huang
the RH of monitors 1 and 2 is from 92.5 to 96.5% and 71 to 79.2%, respectively. The temperature of the inlet air of these monitors is nearly the same at 28.5–31.5 °C. The PM10 readings of monitor 1 ranges from 57.1 to 70.2 g/m3, which is 40.4 to 46.5% higher than that of mon-itor 2. The data obtained indicate the RH has a significant effect on the-gauge readings only when it is greater than ⬃85%. The differences increase greatly with increasing RH when the RH is greater than⬃85%.
To examine that water vapor absorption on the glass fiber filters does not give rise to the differences in-gauge readings; the inlet of the two monitors were replaced by two 47-mm filter holders on June 26, 2002, and test re-sults are shown in Figure 5. Before the filter holders were
installed to remove all of the particles coming into the two monitors (or before 3:00 p.m.), the two monitors had the same readings. With the filter holders in place while keeping the monitor 1 RH at 3.5–13.3% higher than mon-itor 2, the PM10 readings of both monitors dropped to nearly zero. This indicates that the glass fiber filters do not affect the PM10readings, although they may absorb water vapor at high RH.
Influence of RH on Pressure Drop Across the Filter Deposit
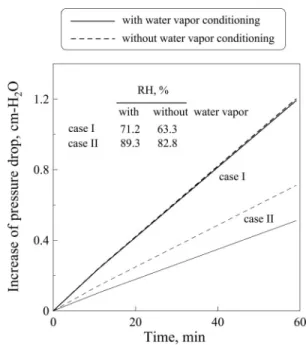
During the test periods, the pressure drop across the filter cake increases as particles are collected on the filters. The increase of pressure drop with increasing sampling time was measured, and the results are shown in Figure 6. The increase of pressure drop of conditioned monitor 1 is found to be very close to that of monitor 2 when the RH of both monitors is⬍80% (monitor 1: 71.2%; monitor 2: 63.3%; Case I in Figure 6). However, when the RH of monitor 1 is high at 89.3% (6.5% higher than monitor 2), the increase of the pressure drop is found to be lower than that of monitor 2 (Case II in Figure 6). This is perhaps because of the more porous structure of the deposited particles on the filter tape of monitor 1 at high RH, which reduces the pressure drop. Similar influence of the RH on the pressure drop across the filter cake was also found in Gupta et al.10Using all of the experimental data obtained in this study, the increase of pressure drop per unit of PM10concentration is plotted in Figure 7. It shows that the increase of pressure drop per unit of PM10 concentra-tion decreases slowly from 0.0147 to 0.012 cm-H2O/ (g/m3) when the RH is increased from 67 to 81%. How-ever, the decrease becomes sharper when the RH exceeds 80 – 85%, which is because of the more porous structure of the filter cake at higher RH. The smaller pressure drop across the filter deposits also results in less water vapor evaporation from the filter deposit and higher -gauge Figure 4. PM10readings, RH, and temperature vs. time for the
-gauge monitors with or without water vapor conditioning, June 23, 2002.
Figure 5. PM10readings, RH, and temperature vs. time for the
-gauge monitors, with or without aerosol filtering at the inlet, June 26, 2002.
Figure 6. Increase of pressure drop vs. time. Case I: from 3:00 to 4:00 p.m. on May 24, 2002; Case II: from 5:00 to 6:00 a.m. on May 25, 2002.
readings of monitor 1 when the RH is greater than⬃80– 85%, as is evident from the discussion in the previous section.
Comparison of-Gauge Readings and Theoretical Predictions
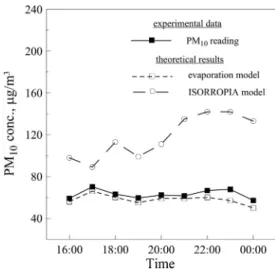
Figures 8 and 9 show the comparison of the hourly -gauge PM10 readings of monitor 1 and theoretical re-sults of the evaporation model and ISORROPIA thermo-dynamic model4from the period of May 24 –25 and June 23, respectively. The theoretical water content of col-lected particles is calculated by the ISORROPIA model in the predictions. The water content that remained in the collected particles is further calculated by the evaporation model. The theoretical PM10concentrations of the above two models are the sum of the PM10readings of monitor 1 and the water content of the collected particles pre-dicted by the two models. Both figures show that the evaporation model predicts the water content of collected particles more accurately than the thermodynamic
model. The PM10concentration of monitor 1 is also pre-dicted better by the evaporation model. When the aver-age RH of monitor 1 is ⬍85% (May 24–25, 2002), the thermodynamic model predicts a slightly higher PM10 concentration of monitor 1 as shown in Figure 8. Evapo-ration of water on the collected particles results in lower (but more accurate) PM10concentrations than those pre-dicted by the thermodynamic model. In comparison, Fig-ure 9 shows that when the RH of monitor 1 is⬎90% (June 23, 2002), water content predicted by the ISORROPIA thermodynamic model is high, leading to a high PM10 concentration of monitor 1. In comparison, the evapora-tion model predicts the PM10concentration more accu-rately. The remaining water on the filter explains why the concentrations of monitor 1 are still much higher than those of monitor 2, as shown in Figure 4. It is, therefore, very important to consider the water evaporation effect during-gauge sampling and -counting processes. The thermodynamic model can only predict water content on the airborne particles, not on particles that are collected on the filters.
CONCLUSIONS
In this study, two Wedding-gauges monitors were col-located in the field with the inlet of one monitor condi-tioned by water vapor to examine the effect of RH on the -gauge readings. The results show that PM10readings of the two monitors are very close when the RH of both monitors are below⬃80–85%, although the RH of one monitor is higher than the other. However, when the RH is⬎80–85%, the results show the water content associ-ated with particles collected on the filter tape cannot evaporate completely, resulting in higher -gauge read-ings. In this case, the increase in the readings will increase with increasing RH; as more water is absorbed by particles, less evaporation occurs because of lower pressure drop through the filter cake.
The test results indicate that the thermodynamic model (such as ISORROPIA) can only predict the water content of particles when they are airborne. When parti-cles are collected by the filters, pressure drop across the filter deposit occurs, which induces water vapor evapora-tion. At higher RH (⬎80–85%), the remaining water on Figure 7. Increase of pressure drop per unit PM10concentration vs.
ambient RH, data from all periods (⌬Pfand⌬Piare the pressure drop
after and before sampling).
Figure 8. Comparison of PM10readings and simulated
concentra-tions of monitor 1, May 24 –25, 2002 (ambient RH: 78.8⫾ 6.2%).
Figure 9. Comparison of PM10readings and simulated
concentra-tions of monitor 1, June 23, 2002 (ambient RH: 94.9⫾ 1.2%).
Tsai, Chang, and Huang
the particles explains why the -gauge readings are in-creased over those of the same PM10particles in the lower RH (⬍80–85%) environment. An evaporation model has been developed to predict the -gauge readings reason-ably well.
To overcome the RH effect on the-gauge readings, smart heaters were installed at the sampling inlet to re-move moisture on aerosols when the RH was high. Test results of the-gauge readings show good agreement with those of the Federal Reference Method samplers.11Results obtained in this study are helpful to the users of the -gauge monitors to decide on the RH level to activate the heater.
ACKNOWLEDGMENTS
The authors would like to thank the Taiwan NSC (Na-tional Science Council) under the contract number NSC 90-2211-E-009-027 and NSC 91-2211-E-264-002 for their support.
REFERENCES
1. U.S. Environmental Protection Agency. Revisions to the National Am-bient Air Quality Standards for Particulate Matter, 40 CFR Part 50. Fed.
Regist. 1987, 52, 24634.
2. Wedding, J.B.; Weigand, M.A. An Automatic Particle Sampler with Gauging; J. Air & Waste Manage. Assoc. 1993, 43, 475-479.
3. Chang, C.T.; Tsai, C.J.; Lee, C.T.; Chang, S.Y.; Cheng, M.T.; Chein, H.M. Differences in PM10Concentrations Measured by-Gauge
Mon-itor and Hi-Vol Sampler; Atmos. Environ. 2001, 35, 5741-5748. 4. Nenes, A.; Pandis, S.N.; Pilinis, C. ISORROPIA. A New Thermodynamic
Equilibrium Model for Multiphase Multicomponent Inorganic Aero-sols; Aquatic Geochem. 1998, 4, 123-152.
5. Chang, C.T.; Tsai, C.J.A. Model for the Relative Humidity Effect on the Readings of the PM10-Gauge Monitor; J. Aerosol Sci. 2003, 34,
1685-1697.
6. Zhang, X.Q.; McMurry, P.H. Evaporative Loss of Fine Particulate Ni-trates during Sampling; Atmos. Environ. 1992, 26A, 3305-3312. 7. Koutrakis, P.; Thompson, K.M.; Wolfson, J.M.; Spengler, J.D.; Keeler,
G.J.; Slater, J.L. Determination of Aerosol Strong Acidity Losses Due to Interactions of Collected Particles: Results From Laboratory and Field Studies; Atmos. Environ. 1992, 26A, 980-995.
8. Cheng, Y.H.; Tsai, C.J. Evaporation Loss of Ammonium Nitrate Parti-cles during Filter Sampling; J. Aerosol Sci. 1997, 28, 1553-1567. 9. Tsai, C.J.; Perng, S.N. Artifacts of Ionic Species for Hi-Vol PM10and
PM10Dichotomous Samplers; Atmos. Environ. 1998, 32, 1605-1613.
10. Gupta, A.; Novick, V.J.; Biswas, P.; Monson, P.R. Effect of Humidity and Particle Hygroscopicity on the Mass Loading Capacity of High Efficiency Particulate Air (HEPA) Filters; Aerosol Sci. Technol. 1993, 19, 94-107.
11. Hanley, T. Air Quality Monitoring Session: PM2.5 Continuous Moni-toring. Presented at the 2004 National Air Quality Conference, Balti-more, MD, February, 2004.
About the Authors
Chuen-Jinn Tsai is a professor at the Institute of Environ-mental Engineering, National Chiao Tung University. Cheng-Hsiung Huang is an assistant professor in the De-partment of Environmental Engineering and Health at the Yuanpei University of Science and Technology. Chung-Tso Chang is a graduate student at the Institute of Environmental Engineering, National Chiao Tung University. Address corre-spondence to: Chuen-Jinn Tsai, Institute of Environmental Engineering, National Chiao Tung University, No. 75 Poai St., Hsinchu, Taiwan, Republic of China; phone:⫹886-3-5731880; fax:⫹886-3-5727835; e-mail: [email protected].