Pergamon
I,,,. J. Hear Mass Trom/er. Vol. 40, No. 2, pp. 333 346, 1997 CopyrIght 0 1996 Elsev~er Scmm Ltd Prmted m Great Britam. All rights reserved 0017-9310197 $15 00+0.00
PI1 : soo17-931o(%)ooo99-3
Structures of moving transverse and mixed
rolls in mixed convection of air in a horizontal
plane channel
C. H. YU, M. Y. CHANG and T. F. LINTDepartment of Mechanical Engineering, National Chiao Tung University, Hsinchu, Taiwan, Republic of China
(Received 8 December 1995 and in finalform 6 March 1996)
Abstract-A combined experimental and numerical investigation was carried out to explore the structures of the moving transverse and mixed vortex rolls in a low Reynolds number air flow through a bottom heated horizontal plane channel for Re < 50. The appearance of the intermittent flow patterns characterized by the oscillatory thermal plumes in the upstream core region ahead of the longitudinal rolls at Gr/Re’ = 35 was experimentally found to be an early indication of the formation of the transverse rolls. At a high Gr/Re* there is a high possibility for the plumes to link with their spanwise neighbors to form transverse rolls. The severing of the returning flow, resulting from the blocking of the main flow by the existing transverse rolls, by the thermal plumes produces new transverse rolls. The flow visualization revealed that at decreasing Re the vortex flow transformed from the longitudinal to transverse rolls in the sequence of stable longitudinal rolls, unstable longitudinal rolls and a mixture of the longitudinal and transverse rolls. For Re > 7.5 the transverse rolls occupied the core region and the longitudinal rolls exist near the side walls. For Re < 5.0 the entire duct is filled with the moving transverse rolls before they become distorted at very high Ra. A correlation equation for the wave speed of the transverse rolls was also proposed. Additionally, a flow regime map delineating different vortex flow patterns was given. The results from the numerical prediction qualitatively supported the experimental observation. Copyright 0 1996 Elsevier
Science Ltd.
1. INTRODUCTION
The buoyancy induced secondary flow in a mixed convective flow through a bottom heated horizontal rectangular duct is normally in the form of longi- tudinal vortex rolls and has been extensively inves- tigated in the literature. However, at very low Rey- nolds numbers the secondary flow is in the form of moving transverse rolls, which is still poorly under- stood. The detailed understanding of the flow charac- teristics associated with the moving transverse rolls is important in growing single crystal film from the chemical vapor deposition. In the present study a com- bined experimental and numerical investigation was carried out to unravel the induced vortex flow patterns and the formation processes and characteristics of the transverse rolls in an air flow through a high aspect ratio (A = 12) horizontal rectangular duct.
Comprehensive review of the literature on the longi- tudinal vortex rolls in a horizontal rectangular duct was already given in our previous study [l]. Here only the literature relevant to the present study is briefly reviewed in the following.
In a horizontal plane channel the onset of the sec- ondary flow takes place around a critical Rayleigh number of Ra, = 1708 [2-lo]. Beyond Ra, steady
t Author to whom correspondence should be addressed.
longitudinal rolls prevail and the roll diameter is nearly equal to the channel height. Ostrach and Kam- otani [4, 51 experimentally noted that the vortex rolls become irregular as Re = 38 and
Ra
> 8000.
A flow regime map of Re vs Ra was proposed for nitrogen gas by Chiu, Rosenberger and Ouazzani [ll, 121 to locate the boundaries among the flow with no roll, steady and unsteady rolls. The existence of the trans- verse thermoconvective rolls was proved by Luijkx and Platten [13] with the silicone oil (Pr g 450) as the working fluid for 0.001 <Re
<
0.01. The critical Rayleigh number corresponding to the onset of the transverse rollsRat,
was found to be a function of the aspect ratio and Prandtl number. Ouazzani et al. [14, 151 provided a relation between the wave speed, mean velocity and Rayleigh number for air flow. They also refined the flow regime map to include the transverse rolls. Recently Ouazzani et al. [16] used Laser Doppler Anemometry to investigate the mixed convective flow of water in a horizontal rectangular duct. Their study revealed a particular flow regime in which only irregu- lar and intermittent flow structures were observed.A close examination of the above studies reveals that some important vortex flow characteristics such as how the transverse rolls are formed, the dependence of their wave speed on Re and Ra, and the possible existence of the other flow patterns are still not well understood. To complement these early studies, exper- 333
334 C. H. YU et al. A
6, d
Bi g Gr h k P Pr ql: RU Ra,+, Re t, 7t ,
T Tc, Th - NOMENCLATURE aspect ratio, b/dchannel width and height Biot number (side wall heat loss) gravitational acceleration
Grashof number, gBd3(T,, - T,)/v*
convection heat transfer coefficient thermal conductivity of air dimensionless dynamic pressure Prandtl number
wall heat flux
Rayleigh number, g/fd3( Th - T,)/va
Rayleigh number at the boundary between type i and type j vortex flows Reynolds number, vd/v
dimensional time and dimensionless time, t/(d/ @
oscillation period temperature [“Cl
temperatures of the cold top and hot bottom surfaces
imental flow visualization combined with the tem- perature measurement and numerical simulation for a mixed convection of air in a bottom heated horizontal plane channel were carried out here.
2. EXPERIMENTAL APPARATUS AND PROCEDURES
A sketch of the established test apparatus for the mixed convection of air in a bottom heated horizontal plane channel and the adopted coordinate system are shown in Fig. 1. The aspect ratio of the duct is 12. The lower plate of the test section is made of a high purity copper plate and is electrically heated by d.c. power supplies. The upper plate is cooled by distilled water flowing above it. The distilled water is main- tained at a constant temperature by a constant tem- perature circulator which consists of a heater, a cooler and a 90 000 gallon underground water reservoir. The side walls of the test section are made of 5 mm thick plexiglass.
The temperature of the lower plate is measured by 13 calibrated and electrically insulated T-type thermo- couples embedded in the plate. The temperature of the upper plate is measured by six T-type thermo- couples struck to the inside surface of the plates. The temperatures of both plates could be maintained at nearly uniform and constant value with the devi- ations ranging from * 0.05 to f 0.12”C.
The open loop mixed convection apparatus begins with the air regulated from a 600 psi and 50 000 cubic feet high pressure air tank which is passed through a settling chamber, a contraction nozzle and a develop- ing channel before entering the test section. The
u, l’, w dimensionless velocity components scaled with IV
IV dimensional average axial velocity W,,,, dimensional wave speed of transverse
rolls
x, _r, z dimensionless Cartesian coordinates scaled with d. Greek symbols ; thermal diffusivity thermal expansion coefficient 0 nondimensional temperature, (T- TJ/(Ti, - Tc) 1’ kinematic viscosity. Subscripts max maximum.
developing section is 1600 mm in length, approxi- mately 83 times of the channel height. This insures the flow being fully developed at the inlet of the test sec- tion for Re < 50.0. The whole test apparatus is placed in a quiescent house to eliminate any possible dis- turbance from the ambient surrounding the house. The entire loop is thermally insulated with the super- lon insulator of 20 mm thick. The volume flow rate of air is controlled and measured by a Hasting HFC flow controller with an accuracy better than 1%. The mean air speed in the test section is calculated from the total flow rate. The air velocity is measured by a hot-wire probe. For calibrating the hot-wire, the pipe flow method that the probe is placed in the center of a fully developed laminar pipe flow is used. The total flow rate is measured and the pipe center velocity is cal- culated from the parabolic distribution. The tem- perature of air is measured by a thermocouple probe. Detailed description of the experimental apparatus was given in our earlier study [ 171.
The data acquisition and control system and vari- ous instruments were calibrated and adjusted end to end on site by Instrument Calibration Section, Q.A. Center, Chung Shan Institute of Science and Tech- nology, Taiwan. The data reduction error is reduced further by using the best nonlinear least square cali- bration curve-fits. Samples higher than 32 are mea- sured at each test point during the data uncertainty test. Uncertainties were calculated according to the standard procedures established by Kline and McClintock [18] and Abernethy and Thompson [ 191. The uncertainties of the thermophysical properties of the air were also included in the analysis. The detailed uncertainty analysis indicated that the uncertainties of
Structures of moving transverse and mixed vortex rolls 335
SETTLING CHAMBER AND NOZZLE DEVELOPING CHANNEL
1660 Iy17161
J L
240 II-1 > OUTLET
\ SECTION
TOP VIEW TEST
SCREEN HONEYCOMB WINDOW SECTION
(a) TOP VIJ3W
TRAVERSING t
c
DEVICE 220 + 20 SMOKC: GENERATOR AND CLEANER PLOW METER(b) SIDE VIEW
UNIT: mm
COOLING WATER
HEATERS INSULATION
(c) TEST SECTION
Fig. 1. Schematic of test apparatus and the chosen coordinate.
temperature, volume flow rate, dimension, Reynolds number and Rayleigh number measurements are esti- mated to be less than fO.l5”C, k 5%, k 0.05 mm,
k 6% and k 6%, respectively.
At first, the main forced flow was measured and the data clearly indicated that the velocity profile is fully developed and is in good agreement with the analytical results given by Shah and London [20]. Additionally, the turbulence intensity is found to be less than 0.7%. Flow visualizations are conducted to observe the sec- ondary flow patterns from the top, side and end view by injecting smoke at some distance ahead of the settling chamber.
In all the experiments to be reported below, we first imposed a fully developed flow in the entire test section and then turned on the power supply to the bottom plate and in the mean time circulated the chil- led water over the top plate. It took about 3 h for the Rayleigh number Ra to raise to the test point and required another 2 h for Ra to stabilize. After this we began various measurements and flow visualization.
3. MATHEMATICAL MODELLING AND SOLUTION METHOD
In this section the mathematical model adopted to numerically calculate the flow is described. Initially at
336 C. H. YU et al.
time t < 0, the air flow in the duct is hydrodynamically fully developed and at the uniform temperature T,
which is the same as the ambient temperature. At time
t = 0 the bottom plate temperature is suddenly raised to a higher uniform value T, and the top plate is kept at the initial temperature T,. Heat loss from the duct
flow through the side walls is also considered to simu- late the experimental situation. Basic equations descri- bing the temporal and spatial evolution of the buoy- ancy induced vortex flow of a Boussinesq fluid in the horizontal plane channel studied here are
;“+~+‘?“=o ax aJJ az (1)
(2)
au
alI
alI
au
T$+w&+vy+wzaw
aw awj awJc_ir+u~+vay+waz
(4)ae
ae
ae
ae
i
a28
a20a28
~+uY&+v~+waz=-
Y
(5)
The local Nusselt number which signifies the heat transfer from the bottom heated plate to the channel flow is defined and evaluated from the calculated tem- perature field as(6)
where 41: is local convective heat flux.
The above flow equations were integrated numeri- cally by an explicit higher order finite-difference method as that used in our early study [ 11. The method was shown to be suitable for the solution of mixed convection flow in a horizontal duct.
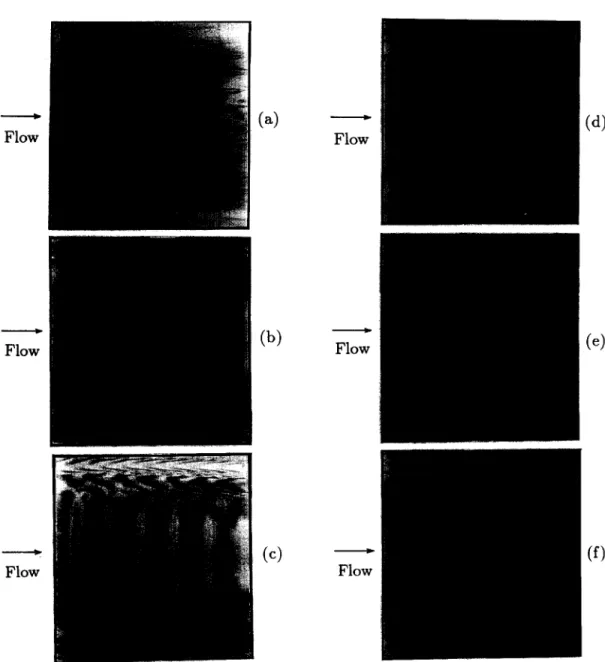
4. DISCUSSION OF EXPERIMENTAL RESULTS In the following selected results from the exper- iment will be presented to illustrate the induced vortex flow patterns and various aspects of the moving trans- verse rolls.
4.1. Initiation of transverse rolls
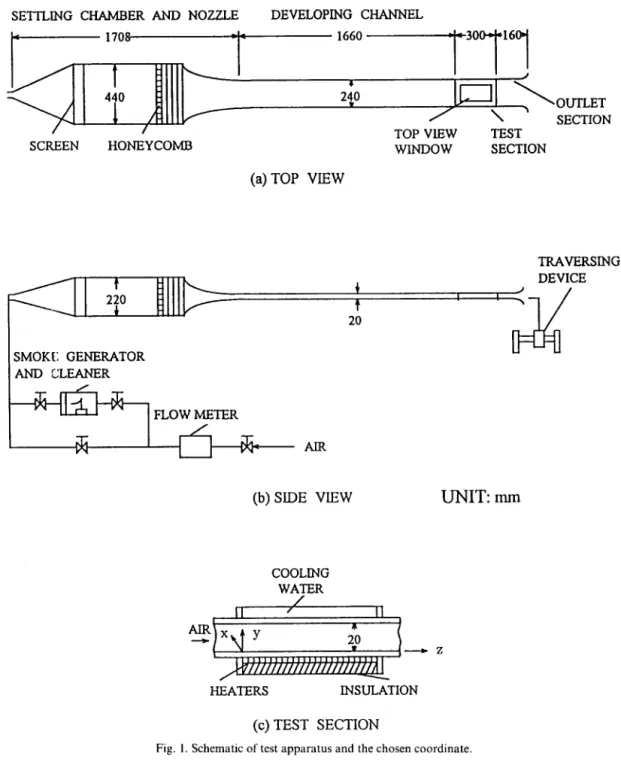
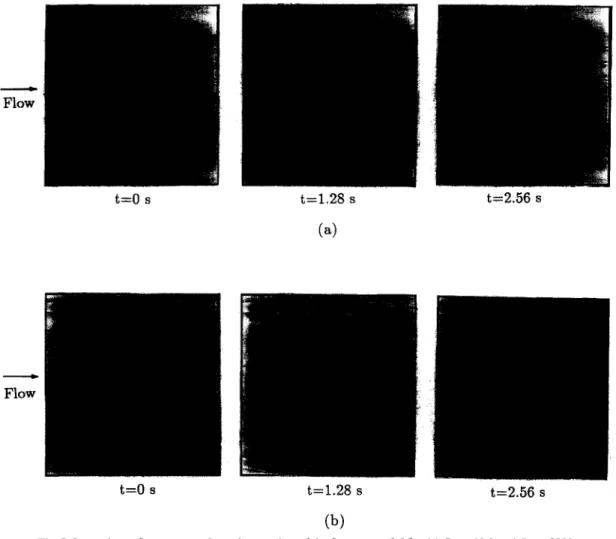
The problem on how the transverse rolls are initiated in the flow is addressed first. Our previous study on the vortex flow formation [ 171 indicated that at low Gr/Re’ for 20 d Re < 50 a longitudinal roll pair with spanwise symmetry is first induced near the duct sides and more rolls are subsequently induced adjacent to the existing rolls as the flow moves down- stream. Here in studying the flow at lower Re we noted that at Gr/Re2 E 35 an intermittent flow pattern characterized as the accidental presence of short trans- verse rolls in the upstream core region along with the longitudinal rolls in the downstream appears, as evident from the top view of the flow shown in Fig. 2(a). This is an early indication of the transition from the longitudinal to transverse rolls. At a higher Gr/Re’ the transverse rolls always exist in the core region [Fig. 2(b)]. The appearance of the intermittent flow pattern is considered to result from the competition between the longitudinal and transverse rolls near the onset point of the transverse rolls. More specifically, the high buoyancy-to-inertia ratio causes the induced thermal plumes in the upstream core region to be stronger and to oscillate periodically up and down. These oscillating plumes tend to merge with their spanwise neighbors to form weaks transverse rolls. Upstream of this oscillation plume region the flow is steady and is dominated by the longitudinal rolls near the duct sides. Downstream the vortex flow is nearly steady and 16 rolls are induced in the duct. Further downstream the flow is unsteady and the roll number is reduced to 12.-14. Near the duct exit only IO-12 rolls are seen and the flow is nonperiodic in time. The intermittent flow pattern for this case suggests that the increase of the roll number to a value greater than that of the aspect ratio is a characteristic of the unsteady longitudinal vortex flow [17], whereas the periodic up and down oscillation of the plumes in the upstream core region and the reduction of the roll number in the downstream to a value less than the aspect ratio are some flow characteristics peculiar to the transition from the unsteady longitudinal rolls to the transverse rolls. The weak transverse rolls formed from the merging of the oscillating plumes for several cases at lower Reynolds numbers are displayed in Fig. 3. These results suggest that at a higher Re and/or Ra the adjacent plumes are more difficult to merge to form the transverse rolls [Figs. 3(c) and (d)] and their structures are somewhat looser.
Regular transverse roll structures are normally for- med at very low Re and high Gr/Re2. Note that the transverse rolls when long enough can significantly block the main forced flow. However, the forced flow tends to push the transverse rolls downstream result- ing in the moving transverse waves and a new trans- verse roll is subsequently formed in the upstream near the channel inlet. The generation processes of new transverse rolls are illustrated in Fig. 4 by showing the instantaneous side view of the vortex flow at selected time instants at the mid-vertical plane x = 6.0 for a
Structures of moving transverse and mixed vortex rolls 337
t=1.28 s
(b)
Fig. 2. Intermittent flow patterns from the top view of the flow at y = 0.5 for (a) Re = 10.0 and Ra = 3000
(Gr/Re’ = 40.5, t, = 3.85 s) and (b) Re = 10.0 and Ra = 4000 (Gr/Re* = 54.1, t, = 3.85 s).
typical case with Re = 5.0 and Ra = 4000. The for- mation processes proceed as follows :
(1) At a certain instant of time designated as t = 0,
the forced Aow is reversed near the duct inlet due to the presence of the transverse rolls in the duct and a returning flow is seen [Fig. 4(a)].
(2) Slightly later at t = 1.23 s the existing rolls are pushed by the main flow and move downstream. Meanwhile a strong thermal plume is generated at the axial station slightly upstream of the flow being returned, as indicated in Figs. 4(a)-(c).
(3) During ascending the plume gradually pro- trudes into the returning flow and severs the turning portion of the flow into a new transverse roll. Note that upon hitting the top plate the plume itself becomes another new transverse roll. The newly for- med transverse roll pair rotates in opposite directions. This interesting phenomenon is clearly shown in Figs. 4(d)-(f). Downstream moving of the rolls along with the adjustment of their strength is also clearly noted.
(4) The above processes of new roll initiation begin
another cycle at t = 7.41 s [Fig. 4(g)] and the vortex flow is periodic in time.
4.2. Effects of Reynolds and Rayleigh numbers
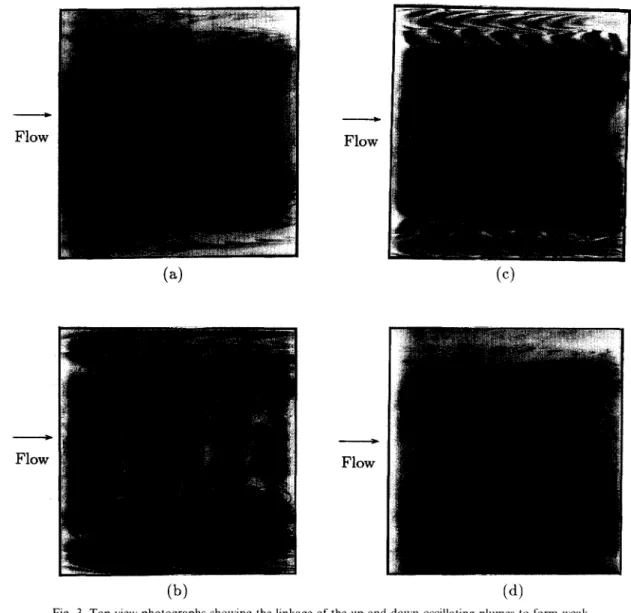
Substantial change in the vortex flow structure was observed when the Reynolds number was reduced. Figure 5 presents this change by showing the instan- taneous flow photos from the top view for various Re
but at the same Ra of 4000. These results clearly indi- cate that at Re = 30.0 the vortex flow is in the form of the stable laminar longitudinal rolls. At a lower Re
of 20.0 the flow is dominated by the stronger longi- tudinal rolls with the rolls being initiated earlier in time and space. Besides, more rolls are present in the duct. A reduction of Re to 12.1 results in a small unstable core region consisting of combined longi- tudinal and transverse rolls. The weak transverse rolls are generated in the upstream near the duct inlet, move downstream and mix with the longitudinal rolls. Elsewhere the longitudinal rolls still prevail [Fig. 5(c)]. When Re is reduced slightly to 11 .O more transverse rolls are seen and they are generated in the more
338 C. H. YU et al. -
Flc
-Flc
- 3WFlow
- FlowFig. 3. Top view photographs showing the linkage of the up and down oscillating plumes to form weak transverse rolls for (a) Re = 6.5 and Ra = 3000, (b) Re = 10.0 and Ra = 4000 (c) Re = 15.0 and Ra = 8000
and (d) Re = 17.5 and Ra = 10000 Returning flow
(4
(b)
_
(4
Flow (d) (e)( f
)
(g) t=o s k1.23 s t=2.47 s t=3.70 s ts4.94 s t=6.17 s tG7.41 sFig. 4 Mid-span (x = A/2) side view of the vortex flow showing the formation processes of transverse rolls at selected time instants (a) t = 0 s, (b) f = 1.23 s, (c) I = 2.47 S, (d) t = 3.70 S, (e) t = 4.94 s, (0 t = 6.17 s
Fla
Flc
Flc
Flc
-_) IW - 3W - 3WStructures of moving transverse and mixed vortex rolls 339
(4
-
Flow(b)
-
Flow
(4
-
Flow
(4
-
Flow
(4
( f 1
(?3>
(h)
Fig. 5. Vortex flow patterns at 4’ = 0.5 at different Reynolds numbers for Ra = 4000 and (a) Re = 30.0,
(b) Re = 20.0. (c) Re = 12.1, (d) Re = 11.0, (e) Re = 10.0, (f, Re = 7.5, (g) Re = 5.1 and(h) Re = 2.0
upstream region [Fig. 5(d)]. At a still lower Re of the duct except in the regions near the duct sides when 10.0 a few regular transverse rolls, although short in Re is further lowered to 7.5 [Fig. 5(f)]. At an even spanwise extent, are dominant in the core region [Fig. lower Re of 5.1 and 2.0 the entire duct is filled with 5(e)]. The transverse rolls occupy the main portion of the moving transverse rolls [Figs. 5(g) and (h)]. It was
C. H. YU et nl.
Flow
-
Flow
Flow
-Flow
-
Flow
-
Flow
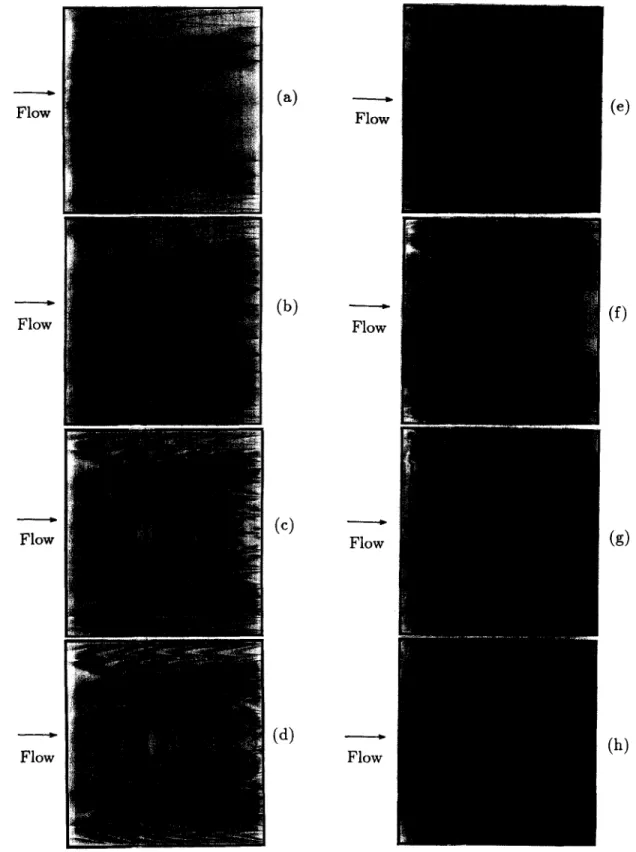
Fig, 6. Top view of the vortex flow at y = 0.5 showing the effect of the Rayleigh number on the flow pattern at Re = 10.0 and (a) Ra = 3000, (b) Ra = 4000, (c) Ra = 5000, (d) Ra = 6000, (e) Ra = 8000 and (f)
Ra = 10000.
noted from the flow visualization that the strength of the transverse rolls increases with the decrease in the Reynolds number.
To illustrate the effects of the Rayleigh number on the vortex flow structure, the results for selected Ra were examined for Re = 30.0, 20.0, 10.0 and 5.0. At
Re = 30.0 raising the Rayleigh number changes the vortex flow pattern from stable symmetric longi- tudinal rolls at a low Ra to symmetric unstable longi- tudinal rolls at an intermediate Ra, then to non-
symmetric unstable longitudinal rolls at a high Ru and finally to chaotic cellular flow at a very high Ra of 30 000. Similar transition is experienced for Re = 20.0 except that for Ra > 8000 there are weak transverse rolls mixed with the strong unstable longitudinal rolls.
At Ra = 20000 the rolls are rather unstable and do not have clear orientation.
Now at a much lower Reynolds number of
Rr = 10.0 the formation of transverse rolls at increas- ing Rayleigh number was noted. Figure 6 illustrates the vortex flow structures from the observation for
Re = 10.0. In Fig. 6(a) for Ru = 3000 very small and
weak transverse rolls are seen in the core region along with a number of longitudinal rolls in the main portion of the duct. Raising Ra from 3000 to 4000 causes the transverse rolls to grow in spanwise dimension and in strength [Fig. 6(b)] with the accompanied shrinkage in the side wall regions occupied by the longitudinal rolls. Note that the transverse rolls become shorter and somewhat bent as they move downstream [Fig.
Structures of moving transverse and mixed vortex rolls 341
30000
20000
Ra
1oooa
’ (a) ;a,_2
=‘llO(Re + 13) A
A A
Flow
pattern type 1A Flow pattern type 2 (b) Raz-3 = 0.9Re3 + 2,000
-
Flow
pattern type 3 Cc) Ra3--4,,5 = 8Re2.4 + 2,0000 Flow pattern type 4
(d) Ra4,5--6 =
760(Re +3.3)
??
Flow
pattern type 5A 0 Flow pattern type 6
0 10 20 30 40 50
Re
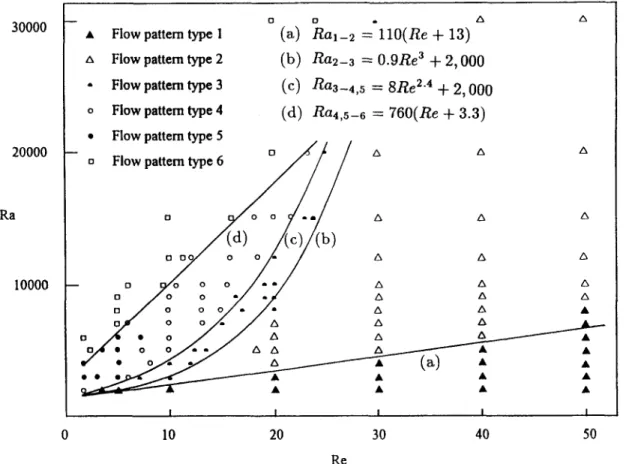
Fig. 7. Flow regime map for different flow patterns (114 cases).
6(c)]. This is due to the growth of the longitudinal rolls in the forced flow direction, which in turn squeezes the transverse rolls. As Ra is over 5000 the region pre- vailed by the transverse or longitudinal rolls does not change significantly with the increase in Ra. Instead at Ra = 6000 the transverse rolls in the downstream
become distorted and are obviously unstable [Fig. 6(d)]. For a higher Ra of 8000 Fig. 6(e) indicates that both the longitudinal and transverse rolls are rather unstable. Finally at Ra = 10000 the vortex flow pat- tern is very irregular and it is difficult to discern any regular roll structures [Fig. 6(f)].
4.3. Flow regime map
An inspection of the results obtained reveals that the vortex flow patterns in the horizontal channel studied here can be qualitatively classified into six types : (1) stable longitudinal rolls, (2) unstable longi- tudinal rolls, (3) unstable longitudinal to transverse roll transition, (4) mixed longitudinal and transverse rolls. (5) transverse rolls and (6) irregular rolls. A flow regime map based on the present data is delineated in Fig. I.
The results from this regime map clearly suggest that the pure transverse roll pattern (type 5) only exists for Re < 7.5. At a slightly higher Reynolds number (7.5 < Re < 23.0) the mixed roll structure (type 4)
appears in a certain range of the Rayleigh number. For Re >, 30.0 the vortex flow is in the form of stable or unstable longitudinal rolls depending on the Ray- leigh number. At very high Gr/Re2 the duct is filled with the irregular rolls (type 6). For engineering appli- cation, correlating equations to fit the boundaries between the transitions of the vortex flow according to the present data are proposed as
Ra,-, = 1 lO(Re+ 13) (7) Ra,_, = 0.9Re3 + 2000 (8)
Ra3_4.5 = 8 Re2-4 + 2000 (9)
Ra 4,5 6 = 760(Re+3.3). (10)
These critical Rayleigh numbers were defined in Nomenclature.
4.4. Width and speed of moving transverse rolls First, we noted that for various cases there are 11 rolls in the heated section of the duct between z = 2 and z = 13, as those in Fig. 4. Thus each roll has a width nearly equal to the channel height, which is close to that predicted by Luijkx and Platten [ 131. The speed of the moving transverse rolls W,,,, convected
by the forced flow was determined by following the image of a particular roll from a top view window. The
342 C. H. YU et al.
Fig. 8. The local Nusselt number distribution on the bottom plate and the temperature distribution in the middle horizontal plane (JJ = 0.5) for Re = 10, Ra = 5000 and Bi = 5 at three selected time instants (a)
5 = 2, (b) t = 4 and (c) z = 6.
Table 1. Summary of the wave speed for transverse rolls
measured data can be scaled with the mean velocity of the main flow W and correlated as
Case Wave speed
Ra Re Experiment Computation Equation (11) ~
W,“,,
= -O.l63ln(Rax Re)+2.95.W (11) 2000 2.0 1.64 1.60 2000 1.0 1.80 1.71 2750 5.0 1.38 1.28 1.40 2750 2.0 1.49 1.55 2750 1.0 1.64 1.66 3000 5.3 1.33 1.23 1.37 3000 4.1 1.37 1.41 3000 2.0 1.46 1.53 4000 5.1 1.33 1.21 1.33 4000 2.0 1.45 1.49 5000 10.0 1.30 1.06 1.19 5000 7.7 1.31 1.20 1.23 5000 5.0 1.31 I .29 1.30 6000 10.0 1.30 1.08 1.16 8000 13.2 1.30 1.06
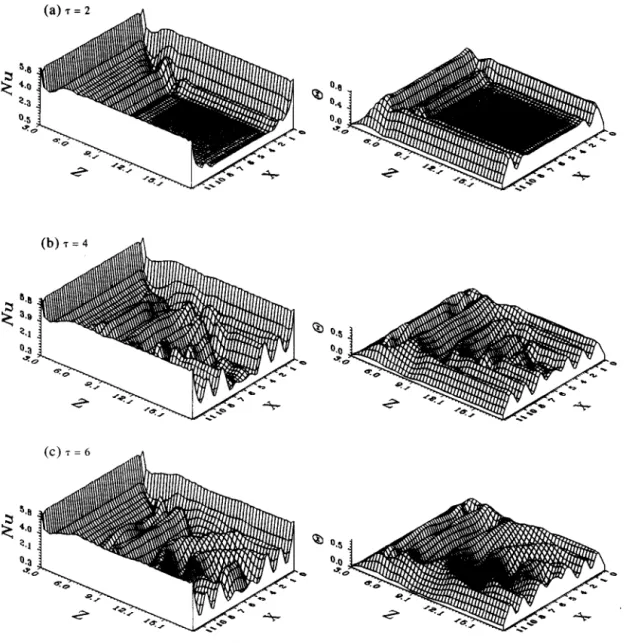
5. DISCUSSION OF NUMERICAL RESULTS To illustrate the generating process of the transverse wave from the initially unidirectional forced flow, the predicted temporal flow development for Re = 10.0,
Ra = 5000 and Bi = 5.0 is shown in Fig. 8 by plotting
the local Nusselt number distribution on the bottom plate and the temperature at the middle horizontal plane (J> = 0.5) at three selected instants of time dur- ing the initial transient. The results indicate that two longitudinal vortex rolls are induced first near the side walls and meanwhile a pair of transverse rolls are
Structures of moving transverse and mixed vortex rolls 343 (a) 7 = 2 Wmax = ’
3.763
(b) 7 = 4 Wmax =’3.946
(C) T = 6 .-.. .___...-... . . . . . .__.__._____..._.~___. . --.,Ic-x ,-_.,-- I --L--,,-- s .-_..._-. * I___\,. s cc______________________________ ______ ______ _... I ,r-, ,,_. 4 1/-,,,-‘ 0 ‘/- \,,. 8 Il.-,,. # ll/_,\, ,,/FL-__ __‘__________“‘...~_,,,~.,,,. s I//#_,,\). t///e- ,,,. r///N ‘cw.,,, _r,,,,/ _,,,,. Jr/__________________ _‘lr .\\, d-/II I \ \\\. l/II r . \ \\\d-f~PI_ ,,,,,. /Y/0-_ ,,,,, -(/,-___ __---________
-__-__________ _I I ,,.d,‘.- , ( \,4,%. _ , \ \.d,‘. * ,\\. -rec.‘. s \\,. -cc.---- _-____________.._.._._.
. . ..-..._ ___ .._,._C,.-_ , .v..-*, ,_I..- _,,\ -rC--.---. L \-rc_. __---. . . .
I I
Wmax =’
4.214
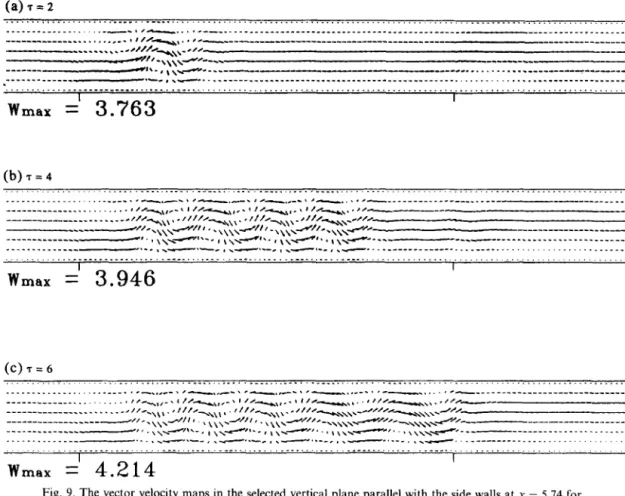
Fig. 9. The vector velocity maps in the selected vertical plane parallel with the side walls at x = 5.74 for Rr = 10, Ra = 5000 and Bi = 5 at three selected time instants (a) z = 2, (b) 5 = 4 and (c) r = 6.
induced at the entry of the heating section. As time increases, more longitudinal rolls are induced near the existing ones in the downstream and the transverse rolls pushed by the forced flow move downstream. At r = 6, seven pairs of longitudinal vortex rolls occupy the exit section of the duct after the cross-section z = 16.81. At the same time, the transverse wave dominate the core region before the section z = 16.81. As the transverse rolls move downstream at increasing 5, new transverse rolls are generated in the duct entry, move downstream, and eventually the transverse rolls fill the entire core region. Meanwhile the longitudinal rolls disappear except those near the duct sides. To further illustrate the structure of the transverse wave, Fig. 9 shows the velocity vector maps in a selected vertical plane at x = 5.74 parallel with the side walls at the three selected time instants. For clear illus- tration, the domains of the plots are not proportional to the actual ones. The results clearly manifest that an ascending thermal plume is generated in the entry by the upward buoyancy in the early transient at T = 2. When the ascending plume touches the top cold surface, it is cooled and moves downwards to become a descending plume. Thus a transverse roll forms. As the transverse roll travels downstream new ascending plume and descending plume are generated period- ically in the entry region to form a new transverse roll.
At z > 150 the flow evolves to a time periodic state. It is important to note from the predicted cross plane streamlines that there exist only one stable longi- tudinal roll near each side wall and the strength of the longitudinal rolls is rather weak due to the strong transverse rolls dominating the flow. Note that the flow is symmetric with respect to vertical central plane at x = A/2.
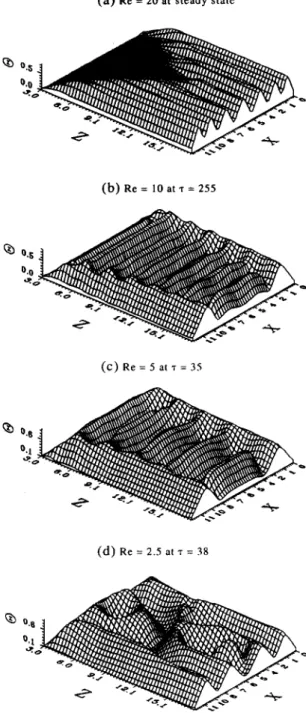
Next the effects of the Reynolds number on the calculated vortex flow structure are examined. Figure 10 demonstrates the substantial change in the vortex flow structure by showing the instantaneous tem- perature distributions in the middle horizontal plane for various Reynolds numbers but at the same Ray- leigh and Biot numbers. These results clearly indicate that at Re = 20.0 the vortex flow is in the form of stable laminar longitudinal rolls. At a reducing Rey- nolds number with Re = 10.0 transverse rolls are seen and they occupy the main portion of the duct except in the regions near the side walls. At a still lower Reynolds number of Re = 5.0, the core region of the duct is still filled with the transverse rolls, but the wave number is less. At an even lower Reynolds number of
Re = 2.5 the flow structure is irregular and the rolls are curved and have random orientation.
To explore the effects of the Rayleigh number on the vortex flow, a series of computations were con-
344 C. H. YU et al.
(a) Re = 20 at steady state
(b) Re = 10 at 7 = 255
(C) Re = 5 at 7 = 35
(d) Re = 2.5 at T = 38
0
Fig. 10. The instantaneous air temperature distributions in the middle horizontal plane at y = 0.5 for Ra = 5000, Bi = 5 and (a) Re = 20 at steady state, (b) Re = 10 at z = 255, (c)
Re = 5 at 7 = 35 and (d) Re = 2.5 at 5 = 38.
ducted for Re fixed at 10 and Ra gradually raised. The results from these computations indicate that the vortex flow gradually evolves to a pattern dominated by the steady longitudinal rolls at long time for
Re = 10.0 and Ra = 3000. As Ra is raised to the range
between 4000 and 6500, the computed data showed that after the initial transient the flow finally evolves to a time periodic state and is dominated by a single fundamental frequency. The vortex flow is char- acterized by the transverse rolls in the major portion of the duct and longitudinal rolls near the duct sides.
The flow is spanwisely symmetric with respect to the central vertical plane at x = A/2. Additionally, the region occupied by the transverse rolls becomes larger at a higher Rayleigh number. For instance, at
Ra = 4000,500O and 6000 with the Reynolds number
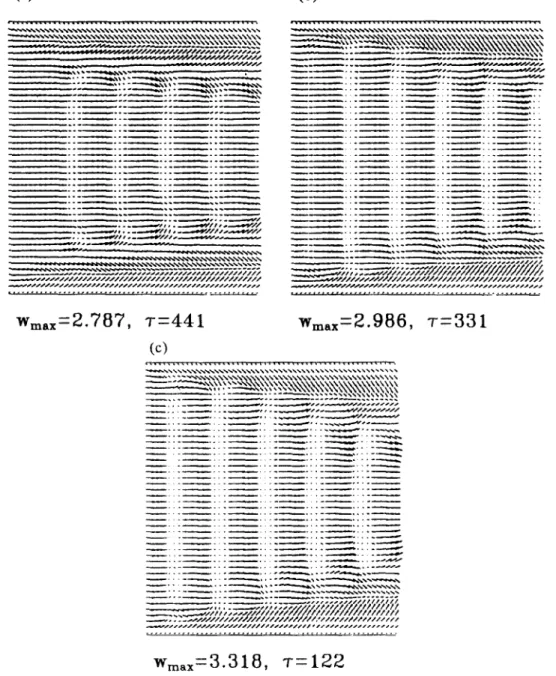
fixed at 10, the planforms of the predicted transverse vortex flows at y = 0.5 shown in Fig. 11 are in good agreement with that from the experimental flow vis- ualization in Fig. 6. This validates the adopted numerical method.
6. CONCLUDING REMARKS
A combined experimental and numerical study was carried out here to explore various vortex flow struc- tures in a low Reynolds number air flow (1 Q Re < 50) through a bottom heated horizontal plane channel. Characteristics of the moving trans- verse and mixed rolls were studied in detail. Major results can be summarized as follows.
(1) The vortex flow pattern changes from longi- tudinal to transverse rolls when the Reynolds number is lowered or when the Rayleigh number is raised for Re around 10. The flow consists of a mixture of
longitudinal rolls near the side walls and transverse rolls in the core region except for Re d 5.0. At a very low Reynolds number (Re < 5.0) the entire duct is
filled with the transverse rolls.
(2) The appearance of the transverse rolls in a lower Reynolds number flow at a high Gr/Re’ is attri- buted to the possibility of the oscillating thermal plumes in the upstream to link together in the span- wise direction, following with the severing of the returning flow to form new transverse rolls. The block- ing of the main flow by the transverse rolls causes the main flow to push them to move in the downstream direction.
(3) Six different flow patterns were observed and a flow regime map was provided.
(4) The wave speed of the transverse rolls based on the present data is correlated as
W,,,,
-= -0.163ln(RaxRe)+2.95. P
(5) The results from the numerical predictions qualitatively supported the experimental observation. During the course of this investigation it has been realized that the channel inclination and aspect ratio can exert profound influences on the spatial and tem- poral structures of the vortex flow. Comprehensive exploration of the vortex flow structure in an inclined channel or in different aspect ratios will be conducted in the near future.
Acknowledgement-The financial support of this study by the engineering division of National Science Council of Taiwan, R.O.C. through the contract NSC83-0404-E-009-054 is greatly appreciated.
Structures of moving transverse and mixed vortex rolls
(a>
(b)
W
max=2.787, T=441
(cl
w,,,=3.318, T=122
Fig. 11. The velocity vector maps in the horizontal plane at J’ = 0.5 for Rr = IO. Bi = 5 and (a) Ra = 4000, (b) Ra = 5000 and (c) Ra = 6000.
REFERENCES
1. C. C. Hwang and T. F. Lin, Buoyancy induced flow transition in mixed convective flow of air through a bottom heated horizontal rectangular duct, In?. J. Heat
Mass Transfer 37, 123551255 (1994).
2. Y. Mori and Y. Uchida, Forced convective heat transfer between horizontal flat plates, Int. J. Heat Mass Tramfer
9, 803-817 (1966).
3. M. Akiyama, G. J. Hwang and K. C. Cheng, Exper- imentals on the onset of longitudinal vortices in laminar forced convection between horizontal plates. J. Heat
Tran&er 93,335-341 (1971).
4. S. Ostrach and Y. Kamotani, Heat transfer aug-
mentation in laminar fully developed channel flow by means of heating from below, J. Heat Transfer 97, 22s
225 (1975).
5. Y. Kamotani and S. Ostrach, Effect of thermal instability
on thermally developing laminar channel flow, J. Heat
Transfer 98,62-66 (1976).
G. J. Hwang and C. L. Liu, An experimental study of convective instability in the thermal entrance region of a horizontal parallel-plate channel heated from below,
Can. J. Chem. Engng 54,521-525 (1976).
Y. Kamotani, S. Ostrach and H. Miao, Convection heat transfer augmentation in thermal entrance regions by means of thermal instability, J. Heat Transfer 101,222-
226 (1979).
W. Nakayama, G. J. Hwang and K. C. Cheng, Thermal instability in plane Poiseuille flow, J. Heat Transfer 92,
61-68 (1970).
G. J. Hwang and K. C. Cheng, Convective instability in the thermal entrance region of a horizontal parallel-plate channel heated from below, J. Heat Transfer 95, 72-77
346 C. H. YU et al. 10. 11. 12. 13. 14. 15.
F. S. Lee and G. J. Hwang, Transient analysis on the thermal instability in the thermal entrance region of a horizontal parallel plate channel, J. Heat Transfer 113,
363-370 (1991). 16.
K. C. Chiu and F. Rosenberger, Mixed convection between horizontal plates-I. Entrance effects, Int. J. Heat Muss Transfer 30, 164-1654 (1987). 17. K. C. Chiu, J. Ouazzani and F. Rosenberger, Mixed convection between horizontal plates--II. Fully developed flow, ht. J. Heat Mass Tramfir 30, 1655-
1662 (1987).
J. M. Luijkx and J. K. Platten, On the existence of 18. thermoconvective rolls transverse to a superimposed mean Poiseuille flow, Int. J. Heat Mass Transfer 24,
1287-1291 (1981). 19.
M. T. Ouazzani, J. P. Caltagirone, G. Meyer and A. Mojtabi, Etude numerique et experimental de la con- vection mixte entre deux plans horizontaux, Int. J. Heat 20. Mass Transfer 32,261-269 (1989).
M. T. Ouazzani, J. K. Platten and A. Mojtabi, Etude
experimental de la convection mixte entre deux plans horizontaux a temperatures defferents-II, Int. J. Heat Muss Trunsfer33, 1417-1427 (1990).
M. T. Ouazzani, J. K. Platten and A. Mojtabi, Inter- mittent patterns in mixed convection, Appl. Sci. Re5.51, 677-685 (1993).
M. Y. Chang, C. H. Yu and T. F. Lin, Changes of longitudinal vortex roll structure in a mixed convective air flow through a horizontal plane channel : an exper- imental study, Int. J. Heat Mass Tramfer 40, 347-363 (1997).
S. J. Kline and F. A. McClintock, Describing uncer- tainties in single-sample experiments, Much. Engny 75, 3-12 (1953).
R. B. Abernethy and J. W. Thompson, Jr, Handbook-- Uncertainty in gas turbine measurement, Technical Re- port No. AEDC-TR-73-5(AD-755356) (March 1973).
R. K. Shah and A. L. London, Laminar Flaw Forced Canoe&on in Ducts, pp. 196198. Academic Press, New York (1978).