A statistics-based pitch contour model for Mandarin speech
Sin-Horng Chen
Department of Communication Engineering, National Chiao Tung University, Taiwan
Wen-Hsing Laia)
Department of Communication Engineering, National Chiao Tung University, Taiwan and Chunghwa Telecommunication Laboratories, Taiwan
Yih-Ru Wang
Department of Communication Engineering, National Chiao Tung University, Taiwan 共Received 11 April 2004; revised 26 August 2004; accepted 4 November 2004兲
A statistics-based syllable pitch contour model for Mandarin speech is proposed. This approach takes the mean and the shape of a syllable log-pitch contour as two basic modeling units and considers several affecting factors that contribute to their variations. The affecting factors include the speaker, prosodic state共which essentially represents the high-level linguistic components of F0 and will be explained more clearly in Sec. I兲, tone, and initial and final syllable classes. The parameters of the two modeling units were automatically estimated using the expectation-maximization共EM兲 algorithm. Experimental results showed that the root mean squared errors共RMSEs兲 obtained in the closed and open tests in the reconstructed pitch period were 0.362 and 0.373 ms, respectively. This model provides a way to separate the effects of several major factors. All of the inferred values of the affecting factors were in close agreement with our prior linguistic knowledge. It also gives a quantitative and more complete description of the coarticulation effect of neighboring tones rather than conventional qualitative descriptions of the tone sandhi rules. In addition, the model can provide useful cues to determine the prosodic phrase boundaries, including those occurring at intersyllable locations, with or without punctuation marks. © 2005 Acoustical Society of America. 关DOI: 10.1121/1.1841572兴
PACS numbers: 43.72.Ar 关DDO兴 Pages: 908 –925
I. INTRODUCTION
Prosody is an inherent supra-segmental feature of human speech. It carries stress, intonation patterns, and timing struc-tures of continuous speech which, in turn, determine the naturalness and understandability of an utterance. How to automatically generate, analyze, and recognize prosody in speech is one of the unresolved problems confronting re-searchers who study speech synthesis and recognition. Al-though it is known that prosody is affected by many factors, such as the phonetic context, sentence type, syntactical struc-ture, semantics, and the emotional status of the speaker, the relationship between these affecting factors and prosody are not totally understood.
Among all the features known to carry prosodic infor-mation, pitch is the most important one. It has been reported that the F0 contour characterizes the speaking style and speaker.1Therefore, pitch plays a role in many speech related applications, like text-to-speech 共TTS兲,2–9 tone recognition,10,11 prosodic labeling,12,13 emotional state recognition,14speaker accent identification,15and so on. Ad-equate pitch control is very important for synthetic speech to be natural in TTS. If a TTS system generates a tone shape matching only the lexical expectation of each individual syl-lable, the lack of consideration of contextual tone variations
will result in underarticulation of tones and lead to the gen-eration of unnatural speech.
Pitch modeling is even more critical for Mandarin speech processing, as Mandarin is a tonal language and the information related to the tonality of a syllable appears, for the most part, on its pitch contour. Although there are only five lexical tones and a previous study16 has concluded that the pitch contour of each of the first four tones can be simply represented by a single standard pattern, syllable pitch con-tour patterns in continuous speech vary highly and can devi-ate dramatically from their canonical forms 共i.e., high-level tone, mid-rising tone, low-falling tone, high-falling tone, and low-energy tone兲. Many factors have been shown to have a major influence on the pitch contour of a tone. They include the effects of neighboring tones, referred to as sandhi rules,17 coarticulation, stress, intonation type, semantics, emotional status, and so on. In addition, the pronunciation of tone 5 is usually highly context dependent and is relatively arbitrary. Thus, pitch modeling is not a trivial research issue for Man-darin speech processing.
Pitch modeling has been the subject of many recent re-search studies on various languages. The general goal of pitch modeling is to derive a computational model that de-scribes the relationship between a set of affecting factors and pitch contour patterns. The related literature has been con-cerned with finding perceptual cues and intonational linguis-tic representations.18,19The pitch contour generation rules for synthesizing intelligible and natural-sounding speech,2–9and the automatic pitch or tone analysis for the purposes of
a兲Author to whom correspondence should be addressed. Electronic mail: [email protected]
speech recognition,10,11 speech understanding20 and word finding,21have also been studied. Pitch modeling can be per-formed using two approaches that are rule based2– 4or data driven.5– 8,22,23The former approach is conventional; it uses linguistic expertise to manually infer some phonologic rules of pitch contour generation, based on observation of a large set of utterances. A prevalent method in the approach applied to TTS uses sequential rules to initially assign the pitch con-tour of a segment with an intrinsic value and then succes-sively applies rules to modify it.2– 4 There are three main disadvantages to this approach. First, manually exploring the effect of mutual interaction among several linguistic features at different levels is highly complex. Second, the rule-inference process usually involves a controlled experiment, in which only a limited number of contextual factors is ex-amined. The resulting inferred rules may, therefore, not be general enough for unlimited texts. Third, the rule-inference process is cumbersome. As a result, it is generally very dif-ficult to collect enough rules without expending a great deal of effort.
The data-driven approach tries to construct a pitch model from a large speech corpus, usually by means of sta-tistical methods6,23 or artificial neural network 共ANN兲 techniques.5,22 It first designs a computational model to de-scribe the relationship between pitch contour patterns and some affecting factors and then trains the model, using the speech corpus. The training goals are to automatically deduct phonologic rules from the speech corpus and to implicitly incorporate them into the model’s parameters or into the ANN’s weights. The primary advantage of this approach is that the rules can be automatically established based on the training data set during the training process, without the help of linguistic experts. The recurrent neural network 共RNN兲-based method5,22is a popular method which uses an RNN to learn the mapping between the pitch parameters and some linguistic features. The main criticism raised against this method is the difficulty of interpreting the hidden structures of the model. Other methods include the hidden Markov model 共HMM兲,23 regression analysis,6 vector quantization,7 and the tree-based approach.8 In addition, an approach that adopts the concept of separating an utterance’s pitch contour into a global trend and a locally variational term has been applied in recent pitch modeling studies, e.g., those on su-perpositional modeling24,25and two-stage modeling.9,26
In this paper, a new pitch modeling approach for Man-darin speech is proposed. It takes the mean and shape of a syllable log-pitch contour as two basic modeling units and uses statistical methods to model them separately while con-sidering several affecting factors that control their variation. The reason for using parameters of the syllable pitch contour as modeling units lies in the fact that the syllable is the basic pronunciation unit of Mandarin speech and each syllable is
lexically marked with a lexical tone, which is a factor that strongly affects pitch in Mandarin. But it is well known that the prosody of an utterance is better modeled with an interval that is much longer than a syllable. Therefore, we use the neighboring tones and the prosodic states to measure the impact. The affecting factors used include the speaker, pro-sodic state, tone, and initial and final syllable classes. Here, the prosodic state is conceptually defined as the state of a syllable in a prosodic phrase. In continuous speech, speakers tend to group words into phrases whose boundaries are marked by durational and intonational cues. Those phrases are usually referred to as prosodic phrases. Many phonologi-cal rules limit their operation within prosodic phrases. While it is generally agreed that the prosodic structure of an utter-ance has some relationship with its syntactic structure, the two are not isomorphic. In the model, the prosodic state is used as a substitute for high-level linguistic information, like a word, phrase, or syntactic boundaries. Our purpose in using the prosodic state to replace conventional high-level linguis-tic information is to divide the complicated pitch modeling task into two subtasks. The first one involves modeling the pitch parameters by considering the effects of some low-level linguistic features and the prosodic state. The second subtask involves exploring the relationship between the pro-sodic state and high-level linguistic cues. Through this two-stage pitch modeling approach, some unsolved problems can be avoided. Problems such as the inconsistency of prosodic and syntactic structures, the ambiguity of word-segmentation and word-chunking for Mandarin Chinese, and the difficulty of performing automatic syntactic analysis on unlimited natural texts can be prevented in the first subtask. In the second subtask, the researcher can focus on modeling the global effect of mapping high-level linguistic features to the prosodic state, since interference caused by low-level lin-guistic features has already been removed in the first subtask. In this paper, we attack the first subtask only, leaving the second subtask to be dealt with in the future. Due to the fact that the prosodic state of a syllable is not explicitly given, it has been treated as a hidden variable and expectation-maximization共EM兲 algorithms have been applied to estimate all the parameters of the two pitch models based on a large training set. A by-product of the EM algorithm is the deter-mination of the hidden prosodic states of all the syllables in the training set. This is an additional advantage because pro-sodic labeling has recently become an interesting research topic.12An example is given as Fig. 1. This example shows that the term prosodic state could be made more understand-able. Figure 1 shows the phonetic transcription, tone 共after dash兲, and the prosodic states 共in parentheses兲 of each syl-lable, which are assigned automatically by our model. For each syllable, in our experiment, 1 of 16 prosodic states was assigned. From the sequence of prosodic states, some
level linguistic phenomenon could be observed, like the pos-sible prosodic phrase boundaries. The prosodic state essen-tially represents the high-level linguistic components of F0, so the results reported in this paper apply to the prediction of the low-level linguistic component 共tone, initial/final class, and speaker factors in our model兲 given the prediction of high-level linguistic components of F0 共the second subtask mentioned above兲.
This paper is organized as follows. Section II discusses, in detail, the proposed pitch modeling approach for Manda-rin speech. Section III presents the experimental results. De-tailed analyses of the inferred affecting factors are given in Sec. IV. An application of the proposed syllable pitch con-tour model to pitch prediction of TTS is given in Sec. V. In the last section, we offer concluding remarks and suggestions for future research.
II. THE PROPOSED PITCH MEAN AND SHAPE MODELS
In the proposed pitch modeling approach, we first per-form rough speaker normalization to the pitch period. Our purpose is to adjust the pitch levels and dynamic ranges of all the speakers so that they are approximately the same, in order to improve the efficiency of the subsequent syllable log-pitch contour modeling. In Ref. 27, a Gaussian normal-ization was used to perform a mapping from the reference pitch values to the desired frequencies, and the authors found that pitch contour moved in the proper direction. We use the same idea to normalize the pitch period of a speaker as fol-lows:
f共t兲⫽f
⬘
共t兲⫺kk •
all⫹all, 共1兲
where f
⬘
(t) and f (t) are the original and normalized pitch periods of frame t; k and k are the mean and standard deviation of the pitch period distribution of speaker k; andall and all are the average mean and average standard deviation of the pitch period distribution of all the training speakers. We then take the logarithm of the normalized pitch period, and the resulting log-pitch contour of each utterance is subsequently divided into a sequence of syllable log-pitch contours. Each syllable log-pitch contour was then decom-posed into two parts, the mean and the shape, using a third-order orthogonal polynomial expansion, with the zeroth-order coefficient representing the mean and the other three higher order coefficients representing the shape. We then take the syllable’s pitch mean and shape as basic modeling units and employ the two separate statistical models to con-sider several major affecting factors. Some parts of the pitch modeling approach are discussed in detail in the following. A. Discrete orthogonal polynomial expansion
Since all syllable log-pitch contours are smooth curves, a third-order orthogonal polynomial expansion is employed to represent them. Actually, in some previous studies,2,5 or-thogonal polynomials, up to the third order, were shown to be good enough to represent Mandarin syllable pitch con-tours. The four basis polynomials used are normalized, in length, to关0,1兴 and can be expressed as follows:5
0
冉
i M冊
⫽1, 1冉
i M冊
⫽冋
12•M M⫹2册
1/2 •冋
Mi⫺1 2册
, 共2兲 2冉
i M冊
⫽冋
180•M3 共M⫺1兲共M⫹2兲共M⫹3兲册
1/2 •冋冉
Mi冊
2 ⫺Mi ⫹M6•M⫺1册
, 3冉
i M冊
⫽冋
2800•M5 共M⫺1兲共M⫺2兲共M⫹2兲共M⫹3兲共M⫹4兲册
1/2 •冋
冉
Mi冊
3 ⫺32冉
Mi冊
2 ⫹6 M 2⫺3M⫹2 10•M2冉
i M冊
⫺共M⫺1兲共M⫺2兲 20•M2册
,for 0⭐i⭐M, where M⫹1 is the length of the current syl-lable log-pitch contour and M⭓3. They are, in fact, discrete Legendre polynomials. A syllable log-pitch contour, f (i/ M ), can then be approximated by
fˆ
冉
i M冊
⫽兺
j⫽0 3 ␣j•j冉
i M冊
, 0⭐i⭐M, 共3兲 where ␣j⫽M1⫹1兺
i⫽0 M f冉
i M冊
•j冉
i M冊
. 共4兲 B. Affecting factorsIn naturally spoken Mandarin Chinese, pitch varies con-siderably, depending on various linguistic/nonlinguistic fac-tors. In this study, we considered some factors that may have major effects on control of the variation of the pitch contour. The specific affecting factors chosen for the pitch mean and shape models are discussed in the following.
1. Affecting factors for the pitch mean model
The pitch mean is mainly affected by intonation, while the pitch shape is affected mainly by lexical tones. A brief summary of the major factors affecting intonation contours was given in Ref. 28. They include declination, downstep, final lowering, accents and tones, segmental effects, and in-tonation type. In our pitch mean model, the affecting factors considered include the tones of the previous, current, and following syllables; the initial and final classes of the current syllable; the prosodic state of the current syllable; and the speaker’s level shift and dynamic range scaling factors. Their influence on the syllable pitch mean is discussed below.
Mandarin Chinese is a tonal and syllable-based lan-guage. The syllable is the basic pronunciation unit. Each character is pronounced as a syllable. Only about 1300 pho-netically distinguishable syllables, comprising the set of all legal combinations of 411 base-syllables and five tones, ex-ist. The tonality of a syllable is mainly characterized by its
pitch contour, loudness, and duration. We, therefore, consider the tone of the current syllable as an affecting factor. Coar-ticulations from the neighboring tones, which are known as sandhi rules, also exist. Thus, the tones of the previous and following syllables are also chosen as affecting factors.
Mandarin base-syllables have a very regular phonetic structure. Each base-syllable is composed of an optional con-sonant initial and a final. The final can be further broken down into an optional medial, a vowel nucleus, and an op-tional nasal ending. As discussed in Refs. 28 and 29, many types of observed F0 movement are caused by these segmen-tal effects. We, therefore, consider the broad initial and final classes of the current syllable as affecting factors and inves-tigate their effects on pitch mean variation.
Aside from the linguistic factors mentioned above, other high-level linguistic components, such as word-level and syntactic-level features, can also seriously affect the pitch contour of an utterance. As discussed in Sec. I, the prosodic state is in our approach used to account for the influence of all high-level linguistic features. Here, the prosodic state simply means the state of the syllable in a prosodic phrase. The pitch level of a syllable can vary drastically in different parts of a prosodic phrase. The declination effect of the glo-bal downtrend, referring to the tendency of F0 to decline over the course of an utterance, is a well-known example. There are two advantages of using the prosodic state to re-place high-level linguistic features. First, pitch information is a kind of prosodic feature, so the variation of the syllable pitch contour should better match the prosodic phrase struc-ture than the syntactic phrase strucstruc-ture. Second, as men-tioned above, some unsolved problems, such as the ambigu-ity of word-segmentation and word-chunking in Mandarin Chinese and the difficulty of performing automatic syntactic analysis on unlimited natural texts, can be avoided in the current pitch modeling approach. This prevents us from us-ing improper or incomplete high-level lus-inguistic information. The main problem with using the prosodic state is the lack of large speech corpora with prosodic tags that have been prop-erly labeled. Thus, we have to treat the prosodic state of a syllable as a hidden or unknown variable. Fortunately, we are able to solve this problem by using the expectation-maximization共EM兲 algorithm, which is a technique of maxi-mum likelihood 共ML兲 estimation from incomplete data. A by-product of the approach is the automatic determination of prosodic states for all the syllables in the training set. This is an additional advantage because prosodic labeling has re-cently become an interesting research topic.12,13In addition, such prosodic phrasal information provides clues for
resolv-ing syntactic ambiguity in automatic speech
understanding20,21,30,31 and for improving the naturalness of TTS.32,33
Lastly, the pitch contour of an utterance is also signifi-cantly affected by the speaker. Speakers have different pitch levels and dynamic ranges. Rough speaker normalization is performed in the preprocessing stage in order to suppress the speaker effect and allow the pitch period distributions of all the speakers to have the same mean and standard deviation. However, we also use two speaker affecting factors in the pitch mean model to examine whether the
Gaussian-normalized syllable log-pitch contour is still speaker depen-dent.
2. Affecting factors for the pitch shape model
Pitch shapes are relatively tone determined. Production studies of Chinese tones have shown that tone shapes in natural continuous speech often deviate from their canonical shapes. They suffer from large deformations due to tone coarticulation, also known as tone sandhi. This situation is particularly common in conversation, where the boundaries among tonal categories are blurred. It has been suggested in Ref. 17 that sandhi contour patterns of poly-tonal groups are rather invariant and can be treated as the basic units of pitch contour analysis/generation. Therefore, lexical tone combi-nations are used here to consider the effect of tone coarticu-lation. To give further consideration to the coupling/ noncoupling effect of neighboring syllables, we considered one-, two-, and three-syllable tone combinations as affecting factors in the pitch shape model.
Other affecting factors chosen for the pitch shape model includ the initial and final classes of the current syllable for the segmental effect, the prosodic state of the current syllable for the effects of high-level linguistic features, and the pitch level shifting effect of speakers.
C. The pitch models
In pitch modeling, we take the mean and shape of the syllable log-pitch contour as basic modeling units and use two separate models to exploit their variations. Because the complicated high-level linguistic components of F0 are rep-resented by prosodic states, only acoustic factors are consid-ered. Therefore, simple additive models are adopted in our study. They are discussed in detail in the following. 1. The pitch mean model
The pitch mean model was constructed by first consid-ering the two affecting factors of the speaker, expressed as
Zn⫽共Yn⫹sn兲␥sn, 共5兲
where Zn is the observed mean共i.e., the zeroth-order coeffi-cient␣0 of the orthogonal polynomial transform兲 of the log-pitch contour of the nth共current兲 syllable;snand␥snare the companding 共compressing-expanding兲 factors 共CFs兲 of the two affecting factors of the speaker, representing, respec-tively, the effects of level shift and dynamic range scaling on Zn; and Yn is the speaker effect-compensated pitch mean. Here, CF means the effect of a factor on the expansion 共in-crease兲 or compression 共reduction兲 of the pitch mean. The model goes on to further consider other affecting factors, expressed as
Yn⫽Xn⫹t
n⫹ptn⫹f tn⫹in⫹fn⫹pn, 共6兲 where Xn is the normalized pitch mean of the nth syllable and is modeled as a normal distribution with mean and variance;r is the CF for affecting factor r; tn, ptn, and f tn represent the lexical tones of the current, previous, and following syllables, respectively; in and fn are broad initial and final classes of the current syllable; and pnrepresents the
prosodic state of the current syllable. Note that tn ranges from 1 to 5, while both ptnand f tnrange from 0 to 5 with 0 denoting cases with punctuation marks or the nonexistence of a preceding or succeeding syllable. The affecting factors for ptn⫽0 and f tn⫽0 are simply set to zero because we do not want to include the effect of tone across punctuation marks. All the affecting factors in the pitch mean model and their notations are summarized in Table I共a兲.
2. The pitch shape model
The pitch shape model is expressed as
Zn⫽Xn⫹btc
n⫹bqn⫹bsn⫹bin⫹bfn, 共7兲 where Zn is the observed pitch shape vector关␣1␣2␣3兴Tfor the nth syllable; Xn is the normalized pitch shape vector of the nth syllable and is modeled as a multivariate normal distribution with mean vectorand covariance matrix R; br is the CF vector for affecting factor r; tcnrepresents a lexical tone combination of the current syllable and its two nearest neighbors; and qn represents the pitch-shape prosodic state of the current syllable. Here, a lexical tone combination, in-stead of individual tones, is used because we want to con-sider the aggregative influence of the current tone and its two nearest neighboring tones. The invoking of the preceding and succeeding tones in the tone combination depends on whether or not long intersyllable pauses exist before and/or after the current syllable, respectively. In a case where both the pre- and postpauses of the current syllable are not long, we consider the effects of both the preceding and succeeding tones, and use a tri-tone combination. When the prepause and/or the postpause are equal to or longer than a predeter-mined threshold 共⫽13 frames or 65 ms in this study兲, we ignore the influence of the preceding and/or succeeding syl-lables, and use a single-tone/bi-tone combination. All the af-fecting factors in the pitch shape model and their notations are summarized in Table I共b兲.
D. Training the pitch models 1. Training the pitch mean model
To estimate the parameters of the pitch mean model, an EM algorithm is adopted. The derivation of the EM algo-rithm is based on treating the prosodic state as an unknown variable. An auxiliary function is first defined in the expec-tation step 共E-step兲 as follows:
Q共¯,兲⫽
兺
n⫽1 N兺
pn⫽1 P p共pn兩Zn,¯兲log p共Zn, pn兩兲, 共8兲 where N is the total number of training samples, P is the total number of prosodic states, p( pn兩Zn,¯) and p(Zn, pn兩) are conditional probabilities, ⫽兵,,t,pt,f t,i,f,p,s,␥s其 is the set of parameters to be estimated, and and ¯ are the new and old parameter sets, respectively. Based on the assumption that the normalized pitch mean Xn is nor-mally distributed, p(Zn, pn兩) can be derived from the as-sumed model given in Eqs.共5兲 and 共6兲 and expressed as
p共Zn, pn兩兲⫽N共Zn;共⫹tn⫹ptn⫹f tn⫹in⫹fn ⫹pn⫹sn兲␥sn,␥sn
2兲, 共9兲
where N(Z;a,b) denotes a normal distribution of Z with mean a and variance b. Similarly, p( pn兩Zn,¯) can be ex-pressed as p共pn兩Zn,¯兲⫽ p共Zn, pn兩¯兲 兺p n ⬘⫽1 P p共Zn, pn
⬘
兩¯兲. 共10兲 Then, sequential optimizations of these parameters can be performed in the maximization step共M-step兲.A drawback of the above EM algorithm is that it may produce a nonunique solution. To solve this problem, we modify each optimization procedure in the M-step to con-strained optimization by introducing a global constraint. The auxiliary function is then changed to
Q共¯,兲⫽
兺
n⫽1 N兺
pn⫽1 P p共pn兩Zn,¯兲log p共Zn, pn兩兲 ⫹冉
兺
n⫽1 N 共⫹tn⫹ptn⫹f tn⫹in⫹fn ⫹pn⫹sn兲␥sn⫺NZ冊
, 共11兲 whereZis the average of Znandis a Lagrange multiplier. The constrained optimization is finally solved via the Newton–Raphson method.To execute the EM algorithm, initializations of the pa-rameter set ¯ are needed. This is done by estimating each individual parameter independently. Specifically, the initial multiplicative/additive CF for a specific value of an affecting factor is assigned to be the ratio/difference of the mean of Zn with the affecting factor equaling the value to the mean of all Zn. Notice that, in the initialization of the CFs for the affect-ing factors of the prosodic states, each syllable is preassigned a prosodic state by means of vector quantization. Following, TABLE I. 共a兲 CFs of the affecting factors in the pitch mean model. 共b兲 CF
vectors of the affecting factors in the pitch shape model.
共a兲
␥sn CF of the dynamic range scaling of the speakers sn CF of the level shift of speakers
tn CF of the current lexical tone ptn CF of the previous lexical tone f tn CF of the following lexical tone in CF of the initial class
fn CF of the final class
pn CF of the pitch-mean prosodic state
共b兲
bsn CF vector of the speakers
btcn CF vector of the lexical tone combination of the current
syllable and its two neighbors bin CF vector of the initial class
bfn CF vector of the final class
all the parameters are sequentially updated in each iteration. The iterative procedure is continued until convergence is reached. The prosodic state can, finally, be assigned as
pn*⫽arg max
pn
p共pn兩Zn,兲. 共12兲
The EM algorithm is summarized below:
共1兲 Compute the initial values of by independently esti-mating each individual parameter from the training set. 共2兲 Do this for each iteration k:
共a兲 Update ¯⫽.
共b兲 E-step: Use Eqs. 共9兲–共11兲 to calculate Q(¯,). 共c兲 M-step: Find the optimal as follows:
⫽arg max
Q共¯,兲. 共13兲
共d兲 Termination test: If L(k)⫺L(k⫺1)⬍ or k⭓K, then stop, where
L共k兲⫽
兺
n⫽1 Nlog p共Zn兩兲 共14兲
is the total log-likelihood for iteration k and K is the maximum number of iterations.
共3兲 Assign prosodic states to all the syllables using Eq. 共12兲. 2. Training the pitch shape model
The pitch shape model is trained using the same EM algorithm. An auxiliary function with a global constraint was first defined as follows:
Q共¯,兲⫽
兺
n⫽1 N兺
qn⫽1 P p共qn兩Zn,¯兲log p共Zn,qn兩兲⫹LT ⫻冉
兺
n⫽1 N 共⫹btcn⫹bin⫹bfn⫹bqn⫹bsn兲⫺NZ冊
, 共15兲 where L is a 3⫻1 Lagrange multiplier vector and ⫽兵,R,btc,bi,bf,bq,bs其 is the set of parameter vectors to be estimated. Based on the assumption that the normalized pitch shape vector Xn is normally distributed, p(Zn,qn兩) can be expressed asp共Zn,qn兩兲⫽MVN共Zn;⫹btc
n⫹bin⫹bfn⫹bqn⫹bsn,R兲, 共16兲 where MVN共Z;a,B兲 denotes a multivariate normal distribu-tion of Z with mean vector a and covariance matrix B. By maximizing the auxiliary function, we can get the optimal parameter set. The training procedure is similar to that for the pitch mean model.
E. Testing the pitch models 1. Testing the pitch mean model
Although we obtain CFs for all affecting factors through the above training procedure, some information still must be discovered in the testing phase. This includes the CFs of the
two speaker-affecting factors and the prosodic state of each syllable. The following testing procedure is used to estimate these unknown parameters:
共1兲 Initialization:
共a兲 Freeze the CFs for the current, previous, and follow-ing tones, for the initial and final classes, and for the prosodic state, the mean, and variance of the nor-malized pitch mean to their trained values, and form a parameter set¯1⫽兵¯ ,¯ , ¯t,¯pt,¯f t,¯i,¯f,¯p其. 共b兲 Compute the initial CFs for the parameter set 2
⫽兵s,␥s其.
共2兲 Do this for each iteration k: 共a兲 Update ¯2⫽2. 共b兲 E-step: Calculate Q共¯2,2兲⫽
兺
n⫽1 N兺
pn⫽1 P p共pn兩Zn,¯1,¯2兲 ⫻log p共Zn,pn兩¯1,2兲. 共17兲 共c兲 M-step: Find the optimal 2 via2⫽arg max
2
Q共¯2,2兲. 共18兲
共d兲 Termination test: If L(k)⫺L(k⫺1)⬍ or k⭓K, then stop, where
L共k兲⫽
兺
n⫽1 Nlog p共Zn兩¯1,2兲 共19兲
is the total log-likelihood for iteration k. 共3兲 Assign prosodic state by means of
pn*⫽arg max
pn
p共pn兩Zn,¯1,2兲. 共20兲
After performing the above procedure, we can derive the two speaker CFs for each testing speaker and determine the pro-sodic state of each syllable.
2. Testing the pitch shape model
In the testing phase, a similar procedure is employed to estimate the unknown parameters of the pitch shape model from the testing data set, with all the known parameters be-ing fixed. Here, the unknown parameters are the CF vector of the speaker affecting factor and the prosodic state of each syllable. In this case, the fixed parameter set ¯1 ⫽兵¯ ,R¯ ,b¯tc,b¯i,b¯f,b¯q其 and the unknown parameter set 2 ⫽兵bs其 are used in the testing procedure.
III. EXPERIMENTAL RESULTS A. Databases
The effectiveness of the proposed syllable pitch model-ing method was examined through simulations on two data-bases. The first database was a high-quality, reading-style, microphone speech database, which was recorded in a sound-proof booth. It is referred to as the TL database. It was generated by five native Chinese speakers, including two males and three females; among these five, two were
profes-sional radio announcers. The database consisted of two types of data. The first type of data comprised sentential utterances with texts belonging to a well-designed, phonetic-balanced corpus of 455 sentences. The lengths of these sentences ranged from 3 to 75 syllables with an average of 13 syl-lables. The other types of data were longer utterances with texts belonging to a corpus of 300 paragraphs, which cov-ered a wide range of topics, including news, primary school textbooks, literature, essays, etc. The lengths of these para-graphs ranged from 24 to 529 syllables with an average length of 170 syllables. The database was divided into two parts: a training set and a test set. Table II shows the database statistics. The training set contained, in total, 102 529 syl-lables, and the test set contained 22 109 syllables. The speak-ers and text content in the test set were different from those in the training set.
After recording was completed, all speech signals in the database were converted into 16-bit data at a 20-kHz sam-pling rate. They were then manually segmented into initial and final subsyllables. The phonetic transcription was gener-ated automatically by a linguistic processor, with an 80 000-word lexicon. All the transcription errors were manually cor-rected. The pitch period was then automatically detected by the ESPS software, with large errors being detected by the program and corrections made by hand. A four-step prepro-cessing procedure was then applied to extract the four mod-eling parameters. The four steps included frame-based speaker normalization, frame-based logarithm operation, di-viding the utterances’ log-pitch contours into syllable seg-ments, and performing orthogonal expansion of syllable
log-pitch contours. The statistics for the observed mean and shape of the syllable log-pitch contour can be found in Table III共a兲.
The second database was a 100-speaker, microphone speech data set, which was a subset of TCC-300, provided by the Association of Computational Linguistics and Chinese Language Processing. It is referred to as the TCC database. The database was generated by 50 males and 50 females. Each speaker uttered several paragraphs of differing content. The speech data were all directly, digitally recorded in a laboratory in 16-kHz, 16-bit linear PCM. The total number of syllables in the database was 141 991. After recording was completed, all the speech signals were automatically seg-mented, using 100-initial and 39-final HMM models. Then, the pitch period was automatically detected by WaveSurfer software, the large errors being excluded by the program. The same four-step preprocessing procedure was then ap-plied to extract the four modeling parameters. In Table IV共a兲, the statistics for the observed mean and shape of the syllable log-pitch contour are shown.
TABLE II. TL database statistics.
Data Set Speaker Sentence Paragraph Syllable
Training Male A 1-455 1–200 34 670
Training Female B 1-455 1–50 12 945
Training Male C 1-455 1–100 20 748
Training Female D 1-455 1–200 34 166
Testing Female E None 201–300 22 109
TABLE III. The mean and共co兲variance statistics of 共a兲 the observed and 共b兲 the normalized mean and shape of the syllable log-pitch contour with 16 prosodic states for the TL database共unit of pitch period: ms兲.
共a兲
Training set Test set
Mean 共Co兲variance Mean 共Co兲variance
Pitch mean␣0 1.949 0.0372 1.948 0.0345 Pitch shape 关␣1␣2␣3兴T 共⫻100兲
冋
3.545 ⫺0.982 ⫺0.056册
冋
58.550 3.229 ⫺5.140 3.229 9.671 ⫺0.106 ⫺5.140 ⫺0.106 2.900册
冋
4.012 ⫺0.749 ⫺0.142册
冋
49.489 3.653 ⫺4.007 3.653 12.460 0.276 ⫺4.007 0.276 4.356册
共b兲Training set Test set
Mean 共Co兲variance RMSE Mean 共Co兲variance RMSE
Pitch mean␣0 1.948 0.000 402 0.0203 1.948 0.000 344 0.0183 Pitch shape 关␣1␣2␣3兴T 共⫻100兲
冋
3.660 ⫺0.996 ⫺0.104册
冋
9.865 ⫺0.354 ⫺0.076 ⫺0.354 1.907 0.232 ⫺0.076 0.232 1.251册
冋
3.143 1.381 1.120册 冋
3.861 ⫺0.906 ⫺0.085册
冋
12.885 0.955 1.073 0.955 3.101 0.808 1.073 0.808 2.263册
冋
3.603 1.762 1.505册
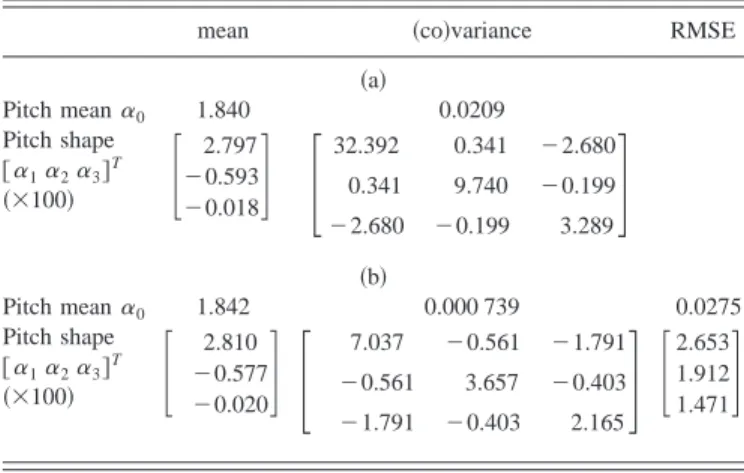
TABLE IV. The mean and共co兲variance statistics of 共a兲 the observed and 共b兲 the normalized mean and shape of the syllable log-pitch contour with 16 prosodic states for the TCC database共unit of pitch period: ms兲.mean 共co兲variance RMSE
共a兲 Pitch mean␣0 1.840 0.0209 Pitch shape 关␣1␣2␣3兴T 共⫻100兲
冋
2.797 ⫺0.593 ⫺0.018册
冋
32.392 0.341 ⫺2.680 0.341 9.740 ⫺0.199 ⫺2.680 ⫺0.199 3.289册
共b兲 Pitch mean␣0 1.842 0.000 739 0.0275 Pitch shape 关␣1␣2␣3兴T 共⫻100兲冋
2.810 ⫺0.577 ⫺0.020册
冋
7.037 ⫺0.561 ⫺1.791 ⫺0.561 3.657 ⫺0.403 ⫺1.791 ⫺0.403 2.165册
冋
2.653 1.912 1.471册
B. Experimental results of pitch modeling
The effect of the proposed pitch modeling method was examined first, with the number of prosodic states set to 16. Table III共b兲 shows the experimental results of pitch mean and shape modeling. It can be seen from the third and sixth columns of Table III共b兲 that the 共co兲variances of the normal-ized mean and shape of the syllable log-pitch contour were greatly reduced for both the closed and open tests, when compared with those shown in Table III共a兲. The RMSEs of the reconstructed mean and shape of the syllable log-pitch contour are shown in the fourth and seventh columns of Table III共b兲. Here, the reconstructed mean 共shape兲 was cal-culated based on the well-trained pitch mean 共shape兲 model by assigning the most probable prosodic state to each syl-lable and setting the normalized mean 共shape兲 parameter共s兲 to its共their兲 mean value共s兲. By combining the results of the
reconstructed pitch mean and shape, we could reconstruct the pitch contour for each syllable. The RMSEs of the recon-structed pitch contour were 0.362 and 0.373 ms/frame for the closed and open tests, respectively. Notice that these two values included RMSEs of 0.17 and 0.19 ms/frame, which resulted from applying orthogonal transformation to the closed and open test data sets, respectively.
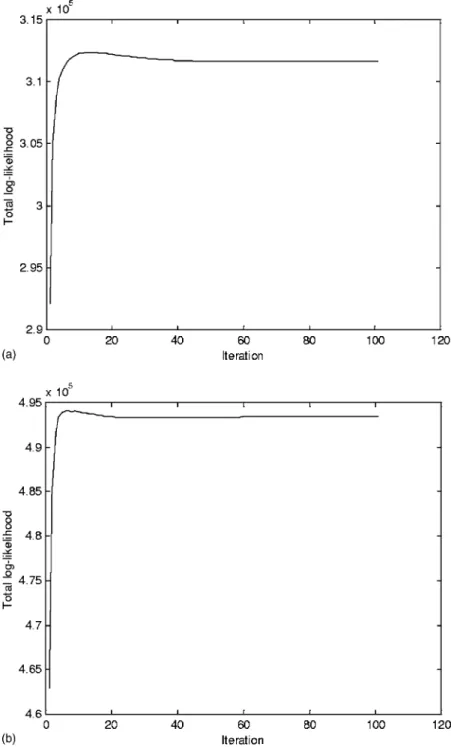
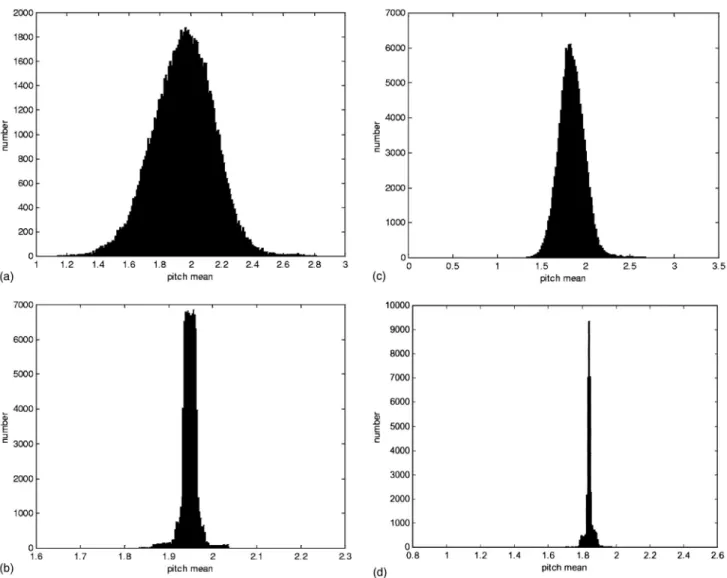
Figure 2共a兲 shows a plot of the total log-likelihood L(k) versus the iteration number k. It can be seen from Fig. 2共a兲 that the EM algorithm quickly converged in the first several iterations. The histograms of the observed and normalized syllable log-pitch mean for the training set are plotted in Figs. 3共a兲 and 3共b兲. It can be seen from these two figures that the variation of the syllable log-pitch mean was greatly re-duced after the influence of the affecting factors considered in the model was eliminated. Based on the above results, we
FIG. 2. The plot of the total log-likelihood versus the iteration number for the training of the pitch mean model of共a兲 the TL database and 共b兲 the TCC database.
concluded that the proposed pitch mean modeling method was effective.
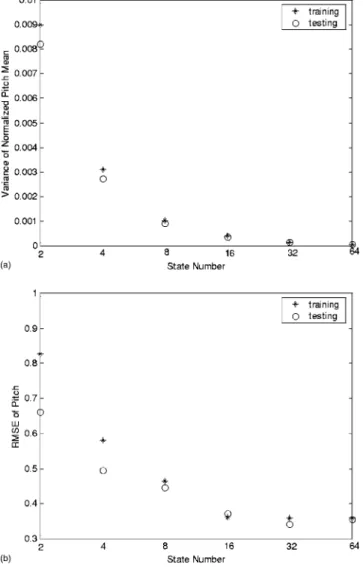
We then examined a case in which the number of pro-sodic states changed. The resulting variance of the normal-ized syllable log-pitch mean is shown in Fig. 4共a兲. As can be seen, the variance of the normalized pitch mean decreased as the number of prosodic states increased. This implies that the pitch mean model became more accurate as the number of prosodic states increased. The improvement reached satura-tion when the number of prosodic states was greater than 16. Similar findings were observed for the corresponding RM-SEs of the reconstructed pitch mean shown in Fig. 4共b兲.
Figure 5 shows two typical examples of reconstructed pitch contours of two utterances based on the pitch mean and shape models with 16 prosodic states. It can be seen from these two figures that all the reconstructed syllable pitch con-tours closely resembled their original counterparts. Actually, they were the smoothed versions of the originals as three-order orthogonal polynomial transformation was used. Fur-ther evaluation of the performance of the reconstructed pitch contours was conducted by means of two subjective tests: the AB test and the mean opinion score共MOS兲 test. The synthe-sized speech recordings, with both the original pitch contours
and the reconstructed pitch contours, were presented to the listeners involved in the tests. The inside/outside test could show whether test sentences are from the training or testing set. In the inside test, the original and reconstructed pitch contours of utterances of speaker A 共see Table II兲, a male professional announcer, were used, while in the outside test, the utterances of speaker E, a female speaker, were used. All the testing utterances were generated by the PSOLA algo-rithm using two acoustic inventories containing the wave-form templates of 414 monosyllables. These two acoustic inventories were generated by speakers A and B for the in-side and outin-side tests, respectively. It should be noted that the acoustic inventory of speaker B, who is a professional female announcer, was used in the outside test because the acoustic inventory of speaker E was lacking. All the other prosodic parameters, including the syllable duration, syllable log-energy level, and intersyllabic pause duration, were esti-mated from the training database using a regression model. Five different long test sentences were used in both the in-side and outin-side tests. Combined with the two kinds of syn-thesized speech, there were, in total, 20 test sample utter-ances. Sixteen listeners, university students, were involved in the two tests. In the AB test, each listener was given a pair of FIG. 3. The histograms of共a兲 the observed and 共b兲 the normalized pitch means for the training set of the TL database and the histograms of 共c兲 the observed and共d兲 the normalized pitch means for the TCC database.
synthesized utterances, along with the original and recon-structed pitch contours for each testing sentence, and asked to vote for the better one. Experimental results showed that 41.25% 共22.5%兲 of the synthesized speech recordings, with the original pitch contours, were found by the listeners to sound better; 25%共27.5%兲 of the synthesized speech record-ings, with the reconstructed pitch contours, were found to sound better; and 33.75% 共50%兲 of the two speech record-ings were found to sound equivalent for the inside共outside兲 test, respectively. In the MOS test, absolute category rating was conducted on a scale from 1共‘‘bad’’兲 to 5 共‘‘excellent’’兲. Experimental results showed that average MOSs of 3.94 共3.34兲 and 3.68 共3.4兲 were obtained for the synthesized speech recordings with the original and reconstructed pitch contours, respectively, in the inside 共outside兲 test. From the results of these two subjective tests, we concluded that the reconstructed pitch contours functioned almost as well as their original counterparts.
We then checked whether it was necessary to include the speaker affecting factors in both pitch mean and shape mod-els, besides frame-based speaker normalization, which was performed in the preprocessing stage. An experiment, which excluded the two speaker affecting factors used in the pitch
mean model and the speaker affecting factor used in the pitch shape model, was conducted. RMSEs of 0.362 and 0.372 ms were obtained in the closed and open tests, respectively. These results were almost the same as those for the previous cases, which used these three speaker affecting factors in the pitch mean and shape models. This showed that rough speaker normalization was good enough to eliminate the speaker’s influence.
We then checked whether the pitch mean and shape models could share the same set of prosodic states. An ex-periment, in which the prosodic state of every syllable in the pitch shape model was forced to be the same as that in the pitch mean model, was then conducted. RMSEs of 0.504 and 0.478 ms were obtained in the closed and open tests, respec-tively. These results were worse than those obtained using separate sets of prosodic states in the pitch mean and shape models. Figure 6 shows the 16 patterns of unified prosodic states. The patterns are plotted from left to right in increasing order of the prosodic state index. The vertical axis is pitch period 共ms兲. Sixteen syllable pitch contour patterns were formed using the CFs of the prosodic states, and the average values of the normalized syllable log-pitch mean and shape can be found in this figure. It can also be found in Fig. 6 that the lower-indexed states had a lower pitch mean and smaller pitch slope; they represented the beginning part of a prosodic phrase. On the other hand, the higher-indexed states had a higher pitch mean and larger pitch slope; they represented the ending part of a prosodic phrase.
Finally, we examined the effectiveness of pitch model-ing via the TCC database. The same trainmodel-ing procedure used with the TL database was applied. The number of prosodic states was set to 16. Table IV共b兲 shows the experimental results obtained for the mean and共co兲variance of the normal-ized pitch mean and shape, and the RMSEs of the recon-structed pitch mean and shape. It can be seen from the third column in Tables IV共a兲 and 共b兲 that the variance of the nor-malized pitch mean and the covariance of the nornor-malized pitch shape were greatly reduced, when compared with those of the original pitch mean and shape. By combining the re-sults for the reconstructed pitch mean and shape, we could reconstruct the pitch contour of each syllable. The RMSEs of the reconstructed pitch contours were 0.384 ms/frame, which included the RMSEs of 0.172 ms that resulted from applying orthogonal transformation. A plot of the total log-likelihood L(k) versus the iteration number k is shown in Fig. 2共b兲. The histograms of the observed and normalized syllable log-pitch mean for TCC are plotted in Figs. 3共c兲 and 共d兲. The results were still quite promising even though the pitch variation, due to the large population of speakers, was very high, and the accuracy of the observed data, due to the automatic seg-mentation performed by the HMM models, was not as high as that achieved by applying manual segmentation to the TL database.
IV. ANALYSES OF THE INFERRED MODEL PARAMETERS
We then analyzed, in detail, the inferred model param-eters in order to gain a better understanding of the effects of the affecting factors. Before discussing this, we will briefly
FIG. 4. Plots of共a兲 the variance of the normalized pitch mean versus the number of prosodic states, and 共b兲 the RMSE of the reconstructed pitch mean versus the number of prosodic states.
introduce a priori knowledge of tone patterns in Mandarin speech. As reported in Ref. 16, tone 1 is a high-level tone that starts in a speaker’s high F0 range and remains high; tone 2 is a mid-rising tone that starts in the speaker’s mid F0 range, remains level or drops slightly during the first half of the vowel, and then rises to a high-level tone at the end; tone 3 is a low-falling tone that starts in the speaker’s mid range and falls to the low range; tone 4 is a high-falling tone that usually peaks around the vowel onset and then falls to the low F0 range at the end; and tone 5 is a low-energy tone that
has a relatively arbitrary pitch contour pattern. The F0 con-tour of each of the first four tones can be represented by a simple single standard pattern, as shown in Fig. 7. However, syllable pitch contour patterns in continuous speech vary highly and can deviate dramatically from their canonical forms.
Table V shows the CFs of the affecting factors of the previous, current, and following tones in the pitch mean model. As can be seen in Table V, the CFs of the affecting factors of the current tone had negative values for tones 1 and 4, and a positive value for the other three tones. Due to the fact that the effect of a positive 共negative兲 CF was to decrease 共increase兲 the F0 mean, the CFs of the affecting factors of the current tone were well matched with the a priori phonologic knowledge discussed above. It was also reported in Ref. 34 that all tones, preceding a tone 3, had a
FIG. 5. Examples of reconstructed pitch contours for共a兲 an inside test utterance: ‘‘tzai-4 guo-2 ren-2 shiau-1 fei-4 shi-2 guan-4 gai-3 bian-4, guo-2 min-2 suo-3 de-2 ti-2 gau-1, shin-4 yung-4 dai-4 kuan-3 shr-4 chang-2, cheng-2 wei-2 chian-2 li-4 shr-4 chang-2’’ and共b兲 an outside test utterance: ‘‘tzai-4 yi-4 guo-2 jeng-4 jing-1 huen-4 luan-4 jung-1 lin-2 wei-2 shou-4 ming-4 de-5 chi-2 an-1 pei-2, wei-4 lai-2 tzai-4 jeng-4 jing-1 liang-3 fang-1 mian-4 dou-1 you-3 bu-4 shau-3 jian-1 kuen-4 ren-4 wu-4 dai-4 wan-2 cheng-2.’’
FIG. 6. The effect on the syllable pitch contour of the 16 unified prosodic states of the pitch mean and shape models. Patterns are plotted from left to
much higher F0 level than they did when they preceded other tones, and all tones had a slightly lower F0 level when they preceded a tone 1. In addition, all tones following tone 1 or 2 had a higher F0 level than they did when they followed tone 3 or 4. These phenomena corroborated the results shown in Table V. Specifically, the effect of the relatively large negative CF (f t⫽⫺0.047) for f t⫽3 greatly increased the F0 level of the current syllable when it preceded a tone 3, while the positive CF (f t⫽0.022) for f t⫽1 decreased the F0 level of the current syllable when it preceded a tone 1. Similarly, pt⫽⫺0.022 for pt⫽1 andpt⫽⫺0.034 for pt ⫽2 increased the F0 level of the current syllable when it followed a tone 1 or 2, while the positive CFs (pt ⫽0.018,0.024,0.029) decreased the F0 level of the current syllable when it followed a tone 3, 4, or 5.
An advantage of the proposed pitch modeling method is that it provides a quantitative and more complete description of the coarticulation effect of neighboring tones rather than conventional qualitative descriptions of some of the sandhi rules. This can be illustrated by reconstructing the pitch con-tour patterns using the CFs of tone-related affecting factors and the average values of the pitch mean and shape models, while ignoring the CFs of all the other affecting factors. Spe-cifically, the pitch contour pattern of the current tone tcwith the preceding tone tpand the following tone tfcan be calcu-lated, based on the proposed pitch mean and shape models, as follows: f˜
冉
i M冊
⫽e fˆ共i/M 兲, 0⭐i⭐M, 共21兲 where fˆ冉
i M冊
⫽兺
j⫽0 3 ␣ˆj•j冉
i M冊
, 0⭐i⭐M, 共22兲 ␣ˆ0⫽⫹pt⫽t p⫹t⫽tc⫹f t⫽tf, 共23兲冋
␣ˆ1 ␣ˆ2 ␣ˆ3册
⫽⫹tc⫽tptctf. 共24兲Figure 8 shows two examples. Figure 8共a兲 displays the reconstructed patterns for the current tones in tone combina-tions of 033, 133, 233, 333, 433, 533, 030, and 020. It should be noted that 0 denotes a case in which the effect of the previous or following tone is ignored. It can also be seen that all six patterns of tone 3 following tone 3共i.e., 033, 133, 233, 333, 433, and 533兲 more closely resemble a pure tone 2 共i.e., 020兲 than a pure tone 3 共i.e., 030兲. This corroborates the
well-known sandhi rule for a 33-tone pair, which says that a tone 3 will change to a tone 2 when it precedes a tone 3. In addition, these six patterns also show their dependence on the preceding tone. Roughly, their beginning parts were ad-justed in order to be more smoothly concatenated with the patterns of the preceding tones. Figure 8共b兲 displays the re-constructed patterns for tone combinations of 044, 144, 244, 344, 444, 544, and 040; it shows that all six patterns of tone 4 following tone 4 共i.e., 044, 144, 244, 344, 444, and 544兲 have a smaller slope and lower ending point, which agrees with a previous finding.3 These six patterns also show that they depend on the preceding tone.
We then examined the effects of the initial and final of the current syllable. We divided all 22 initials into seven broad classes, and 40 finals into seven broad classes, accord-ing to the manner of articulation. Initial classes included I0 ⫽兵null initial其, I1⫽兵b,d,g其, I2⫽兵f,s,sh,shi,h其, I3 ⫽兵m,n,l,r其, I4⫽兵ts,ch,chi其, I5⫽兵p,t,k其, and I6⫽兵tz,j,ji其. Fi-nal classes included F0⫽兵low vowels其, F1⫽兵middle vowels其, F2⫽兵high vowels其, F3⫽兵compound vowels其, F4 ⫽兵vowels with nasal ending其, F5⫽兵retroflexion其, and F6 ⫽兵null vowels其. Table VI共a兲 shows the CFs for these seven initial classes and seven final classes in the pitch mean model. It can be found in Table VI共a兲 that the positive CFs for 兵b,d,g其, 兵f,s,sh,shi,h其, 兵ts,ch,chi其, and 兵tz,j,ji其 lowered the syllable F0 mean, while all the others raised the syllable F0 mean. As for the finals, the positive CFs of the low vowels, compound vowels, and null vowels lowered the syllable F0 mean, while the negative CFs of the middle vowels, high vowels, nasal endings, and retroflexion raised the syllable F0 mean. However, all these 14 CFs were relatively small, com-pared to the CFs of the other affecting factors. This shows that the initial and final of the current syllable were not ma-jor factors affecting the syllable pitch level. Table VI共b兲 shows the CFs of these seven initial classes and seven final classes in the pitch shape model. It can also be seen that all the CFs are relatively small, so they also are not major fac-tors affecting the syllable pitch shape.
Table VII shows the estimated CFs of the three affecting factors for the four training speakers. As observed in Table VII共a兲, the four CFs of the dynamic range scaling factor in the pitch mean model were all close to 1 for the four speak-ers, while the four CFs of level shift were all close to 0. In addition, all the CFs of shape shift shown in Table VII共b兲 were relatively small. This shows that the use of additional speaker affecting factors, other than the frame-based speaker normalization performed in the preprocessing stage, had little effect on the improvement of the pitch mean and shape models. Actually, we have already shown in Sec. III B. that the RMSEs of the reconstructed pitch contour, formed by the proposed pitch mean and shape models, were almost the same when we excluded these three speaker affecting fac-tors.
We then examined the prosodic states of the pitch mean model, labeled by the EM algorithm, in more detail. As men-tioned in Sec. I, the prosodic state is conceptually defined as the state of the current syllable in a prosodic phrase. From this definition, one can expect the prosodic phrase structure of an utterance to be characterized by its prosodic state se-TABLE V. The inferred CFs for the affecting factors of the current,
preced-ing and followpreced-ing tones in the pitch mean model共unit of pitch period: ms兲.
Tone 1 2 3 4 5 t CF of current tone ⫺0.154 0.054 0.160 ⫺0.035 0.128 pt CF of previous tone ⫺0.022 ⫺0.034 0.018 0.024 0.029 f t CF of following tone 0.022 ⫺0.003 ⫺0.047 0.011 0.013
quence. First, a brief description of the characteristics of pro-sodic phrases will be given here. It is well known that the global downtrend tendency of F0 is to decline over the course of an utterance.28 It is also known that a slight pitch reset of the bottom line of intonation will occur at a prosodic word boundary, and that a significant pitch reset of the bot-tom line of intonation will occur at an intonational phrase boundary.35 The pitch mean sequence of an utterance will, therefore, show repeating patterns of smooth uptrend curves, starting with lower pitch levels and ending at higher pitch levels, representing the prosodic phrase structure of the ut-terance. With interference due to the tone effect, however, the prosodic phrase patterns are not as apparent as they are when they are observed based on the original pitch mean sequence of an utterance. A typical example is displayed in Fig. 9, where one can see that the original pitch mean se-quence of the utterance exhibited a repeating uptrend pattern,
while some had large zigzag variations. To eliminate the tone effect, we formed a reconstructed pitch mean sequence of the utterance by calculating the sum of the CFs of the prosodic state sequence and the mean value of the normalized pitch mean. The reconstructed pitch mean sequence is also dis-played in Fig. 9, where it is clearly shown that the recon-structed pitch mean sequence was a better representation of the smooth repeating uptrend patterns of the prosodic phrases than the original pitch mean sequence was, because the large zigzag variations caused by the tone effect had been largely eliminated. Figure 10 shows the autocorrelation func-tions of the original and reconstructed pitch mean sequences. The higher autocorrelation values shown in Fig. 10 imply that the uptrend prosodic phrase patterns, represented by the reconstructed pitch mean sequence, were smoother. The fig-ure also shows that the lowest autocorrelation value occurred at the 6-syllable lag. This agrees with the fact that the
aver-FIG. 8. 共a兲 A comparison of the patterns of tone 3 pre-ceding another tone 3 with the canonical patterns of tone 2 and tone 3.共b兲 A comparison of the patterns of tone 4 preceding another tone 4 with the canonical pat-tern of tone 4.
age length of prosodic phrases is 6.14 syllables, as evaluated based on a 1743-syllable subset of the TL database, with major and minor breaks labeled manually. Based on the above evidence, the validity of the prosodic state definition was confirmed.
Table VIII共a兲 shows the inferred CFs of the 16 prosodic states in the pitch mean model. It should be noted that these 16 CFs are sorted in increasing order, with state 0 having the smallest CF value and state 15 having the largest. Thus, the lower-indexed states correspond to the beginning part of a prosodic phrase, while the higher-indexed states correspond to the ending part of a prosodic phrase. From detailed analy-ses, we found that the prosodic states of syllables in a pro-sodic phrase generally varied from small to large and were reset when they crossed prosodic phrase boundaries. This means that a change of the state’s index, from large to small, indicated a possible prosodic phrase boundary. We, therefore, set the following rules to detect minor and major prosodic phrase boundaries:
location following syllable n
⫽
再
major boundary if 10⭐pn⫺pn⫹1⭐15, minor boundary if 4⭐pn⫺pn⫹1⭐9, nonboundary otherwise.
共25兲 Figure 11 shows some examples of prosodic labeling per-formed using the above rules, with ‘‘*’’ representing a major boundary and ‘‘&’’ representing a minor boundary. As shown
in Fig. 11, almost all the location of PMs 共punctuation marks兲 were marked with major or minor prosodic phrase boundaries. This closely agrees with prior knowledge that a PM is a good location for a break in the pronunciation of a long text. It can also be seen in Fig. 11 that some major and minor prosodic phrase boundaries were detected at non-PM intersyllable locations. From detailed analyses, we found that most of those locations were boundaries of long words. Table IX shows the prosodic labeling statistics. As shown, 80.7% of the location of major PMs belonging to the set 兵comma, period, exclamation mark, semicolon, question mark其 and 69.5% of the location of the secondary major PMs belonging to the set 兵pause—mark in Chinese punctuation used to set off items in a series, colon其 were marked with major or mi-nor prosodic phrase boundaries. On the other hand, only 42.3% of the location of the minor PMs belonging to the set 兵brace, bracket, dot其 and 10.8% of the location of the non-PMs were marked with major or minor prosodic phrase boundaries. From detailed analyses, we found that most of the major/minor prosodic phrase boundaries occurring at non-PM locations were breathing breaks or long-phrase boundaries; most of the major and secondary major PMs labeled with nonboundaries occurred at the ends of very short sentences, at locations near other breaks, or at the ends of sentences whose pronunciation exhibited relatively flat pitch variation. These phenomena closely matched our prior linguistic knowledge. In order to more accurately evaluate the performance of automatic prosodic labeling, we manu-ally processed a small data set containing 1743 syllables in order to determine whether each intersyllable location was a nonbreak, a minor break, or a major break. Table X shows a comparison of the two prosodic labeling methods, where it can be seen that the accuracy of the automatic prosodic la-beling method was 94.1%. If we combine these two classes of minor and major breaks into one break class, the accuracy rate increases to 97.2%. The automatic prosodic labeling method is, therefore, promising.
V. AN APPLICATION TO PREDICT PITCH FOR TTS A hybrid method, incorporating the above pitch mean and shape models with a linear regression method to predict TABLE VI. The inferred CFs for the affecting factors of 7 initial and 7 final classes in the共a兲 pitch mean and 共b兲 pitch shape models 共unit of pitch period: ms兲.
共a兲
Class 兵null initial其 兵b,d,g其 兵f,s,sh,shi,h其 兵m,n,l,r其 兵ts,ch,chi其 兵p,t,k其 兵tz,j,ji其
i ⫺0.008 0.004 0.011 ⫺0.013 0.003 ⫺0.014 0.003 f 0.011 ⫺0.001 ⫺0.004 0.008 ⫺0.005 ⫺0.019 0.004 共b兲 Class 兵low vowels其 兵middle vowels其 兵high vowels其 兵compound vowels其 兵vowelswith
nasal ending其 兵retroflexion其
兵null vowels其 bi 共⫻100兲
冋
⫺0.9711.125 ⫺0.548册 冋
0.522 0.015 ⫺0.020册 冋
0.509 ⫺0.440 0.321册 冋
⫺0.520 0.506 ⫺0.697册 冋
⫺1.270 ⫺0.666 0.648册
冋
⫺0.111 ⫺0.627 0.389册 冋
0.722 ⫺0.161 0.075册
bf 共⫻100兲冋
⫺0.1310.224 0.182册 冋
0.641 0.280 ⫺0.095册 冋
⫺0.278 0.865 ⫺0.076册 冋
0.978 ⫺0.017 ⫺0.094册 冋
⫺0.640 ⫺0.703 0.166册
冋
⫺1.266 0.891 ⫺0.080册 冋
⫺0.354 0.696 ⫺0.291册
TABLE VII. The inferred CFs for the four training speakers in the共a兲 pitch mean and共b兲 pitch shape models 共unit of pitch period: ms兲.
Speaker A B C D 共a兲 ␥s 1.014 0.971 1.026 0.981 s ⫺0.030 0.049 ⫺0.044 0.041 共b兲 bs 共⫻100兲
冋
0.2910.134 ⫺0.012册 冋
0.324 0.302 ⫺0.125册 冋
⫺0.216 0.349 0.348册 冋
⫺0.301 ⫺0.472 ⫺0.152册
the syllable pitch contour for Mandarin TTS, was developed. Figure 12 shows a block diagram of the proposed method. It first estimates the prosodic state CF of each syllable from inputs of linguistic features using the linear regression tech-nique. The linguistic features used here for this linear
regres-sion included共1兲 current word length: 兵1,2,3,⬎3其; 共2兲 current syllable position in word: 兵first, intermediate, last其; 共3兲 sen-tence length:兵1,关2,5兴,关6,10兴,关11,15兴,关16,20兴,⬎20其; 共4兲 current syllable position in sentence: 兵1st, 2nd, 3rd, 关4th,5th兴, 关6th,7th兴, 关8th,11th兴, last, 2nd last, 3rd last, 关5th last, 4th last兴, 关7th last, 6th last兴, 关11th last, 8th last兴, and others其, where the smaller count from the beginning or the end wins, with the count from the end breaking the tie;共5兲 punctuation mark after the current syllable共12 types⫹null兲; and 共6兲 part of speech 共53 types兲. This method then combines the pre-dicted prosodic state CFs with the CFs of other affecting factors to form estimates of four orthogonal transform coef-ficients of the log-pitch contour for each syllable using the pitch mean and shape models. Here, the CFs of the tone- and syllable-related affecting factors were obtained directly by looking-up the corresponding CF tables constructed in the training phase. On the other hand, the three CFs of the speaker could be directly specified as additional inputs to control the dynamic range of pitch contour. In this study, in order to disregard the effect of the speaker’s variability, the values of the three CFs of the speaker were assigned to the values obtained by the EM algorithm in training. In addition, the values of the normalized pitch mean and shape param-eters, required to calculate the output orthogonal transform coefficients in Eqs. 共6兲 and 共7兲, could be obtained through
FIG. 9. A comparison between the original pitch mean sequence and the reconstructed pitch mean sequence formed by adding the mean value of the normalized pitch mean and prosodic state CFs. The sentence is ‘‘gen-1 jiu-4 hua-1 chi-2 yin-2 hang-2 gu-1 ji-4, guo-2 nei-4 wu-3 bai-3 da-4 gung-1 sz-1 wei-4 lai-2 ke-3 neng-2 fu-2 he-2 tsz-3 shiang-4 juan-1 an-4 dai-4 kuan-3 ji-4 hua-4 de-5 jung-1, gau-1 jie-1 ji-2 ju-3 guan-3, ren-2 shu-4 ye-3 you-3 ji-3 wan-4 ren-2 tzuo-3 you-4, tzai-4 guo-2 ren-2 shiau-1 fei-4 shi-2 guan-4 gai-3 bian-4, guo-2 min-2 suo-3 de-2 ti-2 gau-1, shin-4 yung-4 dai-4 kuan-3 shr-4 chang-2, cheng-2 wei-2 chian-2 li-4 shr-4 chang-2.’’
FIG. 10. Autocorrelation functions of the original pitch mean sequence and the reconstructed pitch mean sequence formed by adding the mean value of the normalized pitch mean and the prosodic state CFs.
similar linear regressive estimation. However, because of the fact that their variance was very small, we simply set their values to the means of these two models. Lastly, we gener-ated the reconstructed syllable pitch contour by performing orthogonal polynomial expansion and frame-based speaker denormalization. Notice that the linguistic features used here were extracted from the input text by an automatic word tokenization algorithm, with an 80 000-word lexicon and a manual postcheck.
For a performance comparison, the conventional linear regression method was also implemented. It uses a linear combination of weighted input linguistic features to generate the four orthogonal transform parameters of the log-pitch contour for each syllable. To ensure a fair comparison, the input linguistic features used in the method comprised all the above features and some other syllable-level features, includ-ing the lexical tones 共5⫻3 types兲 of the preceding, current, and succeeding syllables; the initials共21 types⫹null兲 of the current and succeeding syllables; the medials共3 types⫹null兲 of the current syllable; and the finals 共14 types兲 of the pre-ceding and current syllables.
Experimental results obtained using the TL database are
shown in Table XI, where it can be clearly found that the hybrid method, with 16 prosodic states, outperformed the linear regression method. RMSEs of 0.996 and 0.865 ms/ frame between the predicted and observed pitch periods were obtained in the closed and open tests, respectively. The re-sults were better than those, 1.511 and 1.179 ms/frame, achieved using the linear regression method. Notice that the RMSEs resulting from orthogonal transformation were 0.17 and 0.19 ms for the closed and open test data sets, respec-tively.
Lastly, an AB test and an MOS perceptual test, similar to those discussed in Sec. III B, were employed to evaluate the performance of the proposed hybrid method and the conven-tional linear regression method. Synthesized speech record-ings, with syllable pitch contours estimated using these two methods, were compared. The same 16 listeners were in-volved in these two tests. The experimental results of the AB test showed that 98.75% 共100%兲 of the hybrid synthesized speech was found to sound better in the inside共outside兲 test, while 1.25% 共0%兲 of the linear regression synthesized speech was found to sound better. The experimental results of the MOS test showed that average MOSs of 3.5共3.18兲 and
FIG. 11. Examples of labeling minor共&兲 and major 共*兲
prosodic phrase boundaries using rules based on the prosodic state differences of the pitch mean model. TABLE VIII. The inferred CFs for the 16 prosodic states in the共a兲 pitch mean and 共b兲 pitch shape models. The
CFs in共a兲 are sorted from small to large 共unit of pitch period: ms兲.
共a兲 State 0 1 2 3 4 5 6 7 p ⫺0.400 ⫺0.225 ⫺0.159 ⫺0.113 ⫺0.081 ⫺0.047 ⫺0.016 0.014 State 8 9 10 11 12 13 14 15 p 0.039 0.073 0.102 0.130 0.161 0.196 0.265 0.348 共b兲 State 0 1 2 3 4 5 6 7 bq 共⫻100兲