行政院國家科學委員會專題研究計畫 期中進度報告
子計畫一:車牌自動辨識系統(1/3)
計畫類別: 整合型計畫 計畫編號: NSC91-2213-E-009-105- 執行期間: 91 年 08 月 01 日至 92 年 07 月 31 日 執行單位: 國立交通大學資訊工程學系 計畫主持人: 李錫堅 計畫參與人員: 王舜正 報告類型: 精簡報告 處理方式: 本計畫可公開查詢中 華 民 國 93 年 2 月 29 日
行政院國家科學委員會專題研究計畫成果報告
以電腦視覺為基礎之智慧型運輸系統 (1/3)─子計畫一:
不同視角下的車牌辨識系統
Detection and Recognition of License Plate Characters with
Different Appearances
計畫編號:NSC
91-2213-E-009-105
執行期限:91 年 8 月 1 日至 92 年 7 月 31 日
主持人:李錫堅 國立交通大學資訊工程系
一、AbstractThis project proposes an approach to developing an automatic license plate recognition system. Car images are taken from various positions outdoors. Because of the variations of angles from the camera to the car, license plates have various locations and rotation angles in an image. In the license plate detection phase, the magnitude of the vertical gradients is used to detect candidate license plate regions. These candidate regions are then evaluated based on three geometrical features: the ratio of width and height, the size and the orientation. The last feature is defined by the major axis. In the character recognition phase, we must detect character features that are non-sensitive to the rotation variations. The various rotated character images of a specific character can be normalized to the same orientation based on the major axis of the character image. The crossing counts and peripheral background area of an input character image are selected as the features for rotation-free character recognition. Experimental results show that the license plates detection method can correctly extract all license plates from 102 car images taken outdoors and the rotation-free character recognition method can achieve an accuracy rate of 98.6%.
Keywords: Character recognition, license
plate detection, license plate recognition,
image orientation detection, rotation-free character recognition
二、Introduction
THE development of Intelligent
Transportation System (ITS) has grown rapidly over the last ten years. With the progress of the computer vision technologies, data such as license plate numbers can be obtained automatically. These data can be used in follow-up analyses and monitors The following shows the input images from LPR outdoors. Figure 1 shows the images of the outdoor cars captured from digital sensors with different relative locations from the camera to the car and different appearances of the license plate may appear in the images. Figure 2 shows two different appearances of the license plates. Previous researches [1]-[10] on optical character recognition (OCR) in license plate recognition systems generally assumed that the text lies in a plane whose angles were roughly perpendicular to the optical axis of the sensor and did not consider the rotation situation. Under the assumption, various approaches to recognizing characters were studied, but those approaches failed to handle the rotation distortion as shown in Figs. 1 and 2. The range of the sensor position (pan/tilt) reported in previous studies is less than 20o, which does not work well in the license plate recognition system used outdoors, because
the license plates appearing in captured images usually have more than 20o relative location (pan/tilt).
Fig. 1: Images of the cars with different relative locations.
Fig. 2: Two different appearances of the license plates in Fig. 1.
In order to extend the application of license plate recognition into various fields, it is necessary to develop an OCR algorithm to handle more deformable images. In general, LPR system includes two main modules: (1) license plate detection and (2) character segmentation and recognition. The license plate detection phase proposed in this project can detect all license plates of the car images without constraints in relative locations and directions from the camera to the car. The character recognition phase presented in this project can recognize characters with various rotation angles since the characters are normalized with respect to the major axis. The remaining parts of this project are organized as follows. Section II studies the motivation and modules of the orientation normalization. Section III presents the procedure of license plates detection. Section IV describes the rotation-free license plate recognition module and Section V shows experimental results. The final part of the project includes some concluding remarks.
3.1 Orientation Normalization
This project aims to detect the license plates of the car image with various locations and to recognize the rotation-free characters in the license plates. It is useful to derive the major axis which shows the orientation of the
image to detect and recognize license plates. In the license plate detection phase, the major axis is measured in possible license plate region to evaluate the possibility to be a license plate region. Figure 3 shows the major axis on each image of the character “R” in five different rotation angles, where the dash lines represent the major axis of the character image. In the character recognition phase, the character images are rotated to a normalized coordinate system with respect to the major axis.
Fig. 3: The images of character “R” in different orientations. The dash lines represent the major axis.
3.2 Orientation Detection
In the binary image, we first define that the mass is the black pixels whose gray level is 1. The moment of mass of the binary image is the distribution of the mass throughout the binary image. As mentioned by Horn [11], the first moment of mass which is defined as mass times distance could be used to derive the center location of the mass and the second moment of the mass could be measured the distribution of mass relative to axes through the center of the mass. And the orientation,θ, of the mass is derived from the least second moment of the mass. Then, the major axis of the mass can be achieved from the orientationθ and the center. The steps to derive the orientation from the binary image are described in the following. The first moment of mass in the binary image is defined as
(
,)
=(
∫ ∫
( , ) ,∫ ∫
( , ))
.= x y xg x y dxdy yg x y dxdy
C c c (1)
whereg(x,y)is the black point(x,y)which gray level is 1 in the binary image.
The second moment of mass in the binary image is equal to mass times square of the distance from the black point in the binary image to a line L as shown below:
, ) , ( 2
∫ ∫
= r g x y dxdy S (2)where r is the perpendicular distance from the black point(x,y)to a line L . In Fig. 4, for a particular line L in the binary image, two parameters are defined: the distance t from the origin to the closest point on the line, and the angleθbetween the x-axis and the line, which is measured counterclockwise. The equation of the line L is presented as follows.
0 cos
sin −y +t=
x θ θ (3)
Fig. 4: The coordinate diagram.
Note that the line L intersects the x-axis at( t− )/sinθ and the y-axis att/cos . The closest point on the line to the origin is located at
(
−tsinθ
,+tcosθ
)
. Suppose that the point(
x0, y0)
is located on the line L and the distance from the point(
x0, y0)
to the point(
−tsinθ
,+tcosθ
)
isγ The equations for the point(
x0, y0)
on the line L are as the following: . sin cos and cos sin 0 0θ
γ
θ
θ
γ
θ
+ + = + − = t y t x (4) Given an arbitrary black point( )
x,y in the binary image, the shortest distance r between( )
x,y and the line L is defined as(
) (
)
(
)
(
cos sin)
(
)
. 2 cos sin 2 2 2 2 2 2 0 2 0 2 y x y x y x t t y y x x r + + + + − − + = − + − = γ θ θ γ θ θ (5) Totally differentiating with respect toγ
,we obtain. sin cos
θ
θ
γ
=x + y (6) Substituting the equation (6) back into the equation (5) lead to. cos sin y t x
r =
θ
−θ
+ (7)By substituting the equation (7) back into the equation (2), the second moment of
mass can be derived as
(
)
∫ ∫
− += xsin ycos t 2g(x,y)dxdy.
S θ θ (8)
Because the second moment of mass crosses the center of the binary image, we can substitute the equation (1) into the equation (8) and totally differentiating with respect to t , we obtain
(
xcsinθ − yccosθ +t)
=0, (9) where(
xc,yc)
is the center of the binary image. Without losing the generality, we can change the coordinate toc
c y y y
x x
x′= − and ′= − and the equation (9) can be rewritten as follows:
, cos sin cos sinθ y θ t x θ y θ x − + = ′ − ′ (10) and we can substitute the equation (10) back into the equation (8), then the new equation is obtained. ( ) ( ) ( ) ( ) ( ) ( ) ( ) ( )
(
)
(
( ) ( ))
( , ) . 2 sin ) ( 2 2 cos 2 1 ) , ( 1 2 cos 2 sin ) ( 2 2 cos 1 2 1 ) , ( cos cos sin ) ( 2 sin 2 2 2 2 2 2 2 2 2 2 y d x d y x g y x y x y x y d x d y x g y y x x y d x d y x g y y x x S ′ ′ ′ ′ − ′ − ′ − ′ + ′ = ′ ′ − ′ + ′ ′ + − ′ = ′ ′ ′ + ′ ′ + ′ = ∫∫ ∫∫ ∫ ∫ θ θ θ θ θ θ θ θ θ (11)Total differentiating S with respect toθand we can obtain
, ) ( ) ( ) ( 2 2 tan 2 2
∫ ∫
∫ ∫
′∫ ∫
′ ′− ′ ′ ′ ′ ′ ′ ′ = y d x d y y d x d x y d x d y x θ (12)Finally, we obtain the orientationθ, . ) ( ) ( ) ( 2 arctan 2 1 2 2 ′ ′ ′ − ′ ′ ′ ′ ′ ′ ′ =
∫ ∫
∫ ∫
x∫ ∫
dxdy y dxdy y d x d y x θ (13) The major axis in the binary image is defined as the line which slope isθand the major axis crosses the center.3.3 License Plate Detection
The first step of the license plate recognition system is to detect the license plate regions of the input car images. Due to the similar colors of the license plate background and that of the car body, it is difficult to detect the boundary of the license plate from the input car images in outdoors. Because the color of characters is different
from that of the license plate background, the gradients of the original image are adopted to detect candidate license plate regions. Figure 5 shows the processing flow of license plates detection.
Fig. 5: Processing flow of license plate detection.
This section presents the details of license plates detection. The procedure consists of four major steps: (1) detection of possible license plate regions, (2) possibility measurement, (3) merging of broken regions, (4) inverse rotation transformation. The last step, inverse rotation transformation, has already been described in Section 3.1. The details of the remaining steps are explained as follows.
3.3.1 Detection of Possible License Plate Regions
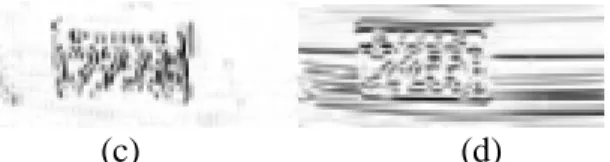
At the first step of the license plate detection phase, the possible license plate regions are detected from the gradients of the input car images. The gradients are derived by multiplying with a mask value for each pixel and its neighboring pixels. The Sobel operator uses two masks to find vertical and horizontal gradients. The masks for the Sobel are as follows [9]. Since the license plates are located on the bumper, in the car images, the license plate region is usually connected with horizontal lines. Figure 6(a) shows the license plate image. Figure 6(b) displays the Sobel gradients of Fig. 6(a). Figure 6(c) and Fig. 6(d) exhibit the vertical and horizontal gradients of Fig. 6(a). It is hard to separate the license plate region from the others in the horizontal gradients image with. But it is easy to detect the license plate region from the vertical gradients image because the magnitude of vertical gradients is strong in the characters of the license plate image while weak in the vertical lines.
(a) (b)
(c) (d)
Fig. 6: (a) The license plate image; (b) The Sobel gradients of Fig. 6(a); (c) The vertical gradients of Fig.
6(a); (d) The horizontal gradients of Fig. 6(a).
In the vertical gradients image, the license plate region is the area with large local variance. The local variances of the vertical gradients image are measured by the equation: ( ) ( ) 2 , 2 , 2 , , 2 1 2 1 0 0 0 1 2 1 ) 1 , 1 ( ) 1 , ( ) 1 , 1 ( ) , 1 ( ) , ( ) , 1 ( ) 1 , 1 ( ) 1 , ( ) 1 , 1 ( 1 1 2 1 0 0 0 1 2 1 ) 1 , 1 ( ) 1 , ( ) 1 , 1 ( ) , 1 ( ) , ( ) , 1 ( ) 1 , 1 ( ) 1 , ( ) 1 , 1 ( 1 ) , ( , ) , ( − − − • + + + + − + − − + − − − − − − − • + + + + − + − − + − − − = − = ∑ ∑ ∑ ∑ ∈ ∈ ∈ ∈ W j i x W j i x x W j i W j i x j i f j i f j i f j i f j i f j i f j i f j i f j i f N j i f j i f j i f j i f j i f j i f j i f j i f j i f N N j i g N j i g j i LocalVar (14)
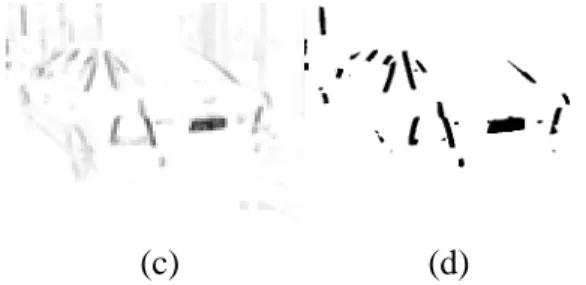
whereW is the local window mask,g( ji, )is the magnitude of the gradients image,Nxis the size ofW,•is the inner product operator and f( ji, ) denotes the gray level of the original image. In this project, in order to cover the characters in the license plate of the input car images, the size of the local window mask,W , is set as 11*7. The smaller the window size is, the more possible the license plate regions are separated, while the larger the window size is, the over detected license plate regions occur. The pixel is defined as 1 for possible license plate regions. When we threshold the local variance image, the image of possible license plate regions is obtained. Figure 7(a) shows the image of a car with a license plate, where the colors of the license plate background and that of the car body are similar. Figure 7(b) displays the vertical gradient image of Fig. 7(a). Figure 7(c) and Fig. 7(d) demonstrate the local variance image of Fig. 7(b) and the possible license plate regions, respectively.
(c) (d)
Fig. 7: (a) The car image with a license plate; (b) The vertical gradients of Fig. 7(a); (c) The local variance
of Fig. 7(b); (d) The possible license plate regions.
There may be some noise in the images of possible license plates such as holes and single dots. An opening operation of morphological analysis, in which the dilation operation is performed after an erosion operation, is applied in order to reduce the undesired effect of noise and to separate the regions that were slightly connected.
3.3.2 Possibility Measurement
To detect the most possible license plate regions from the candidate plate regions, the geometrical properties of the license plate are introduced to measure the possibility value. The following defines the geometrical features:
1) Area: If the candidate region is large, it is more likely being a license plate. A higher possibility value represents a more possible license plate region. The possibility of the area is defined asNs/(
∑
Ns)whereNsis the number of boundary rectangle of the possible license plate region, s.2) Orientation: As described in Section II, the orientation of each possible license plate region can be measured. A license plate usually appears as a horizontal rectangle. The smaller the orientation of the possible license plate region is, the higher the possibility value is. The possibility of the orientation is given by(90−θs)/90whereθsis the orientation of the possible license plate region, s. 3) Density: The ratio between the black
regions and the area of the bounding rectangle is defined as the density of the license plate region. The license plate is always a rectangle. A higher density
value means that the region is more likely to be a rectangle and to be viewed as a license plate region. The possibility of the density is defined asBS /NswhereBsis the number of the possible license plate region, s.
For each possible license plate region, s, the possibility value,p(s),is defined as the weighted sum of the above three features, as shown below.
(
)
s S s s s N B N N density n orientatio area p s p 3 2 1 90 90 , , ) ( ω θ ω ω + − + = =∑
(15)whereωi is the weighting coefficient. We need to select properωithat can keep a high detection rate. These values are determined according to experimental results. In this project, ω1 =0.2,ω2 =0.3andω3 =0.5 are adopted.
3.3.3 Merging of Broken Regions
After the detection of all candidate license plate regions, a license plate is probably separated into several adjacent regions. In Fig. 8(a), since the distance between the characters “F” and “4” in the license plate is larger than the threshold of the window mask defined above, two separated candidate license plate regions are generated. These separated regions have to be merged to extract the accurate license plate region.
(a) (b)
Fig. 8: (a) The car image with a license plate; (b) The separated possible license plate regions.
Assume that s1 and s2 are two possible license plate regions and s is the merged region of s1 and s2. Regions s1 and s2 are merged when the following two rules are satisfied.
than a threshold value.
2) The possibility value of the merged region s is larger than both of s1 and s2.
The merging operation is repeatedly performed until no regions could be merged. Then, the region with the largest possibility value is viewed as the license plate region. 3.4 Rotation-Free License Plate Recognition
In the rotation-free license plate recognition phase, there are five main steps includes as shown in Fig. 9. First, the license plate images are extracted from the original image according to the possible license plate regions derived in Section 3.3. To extract the characters in the license plate images, we binarized the license plate images. The robust dynamic threshold method, Otsu, proposed in [15] is applied. The de-noise process is then applied to eliminate small regions and the boundary. Figure 10(a) shows the license plate images extracted from Fig. 10(a) and Fig. 10(b) displays the binarized and de-noised result.
Fig. 9: Processing flow of the rotation-free character recognition module.
(a) (b)
Fig. 10: (a) The license plate image of Fig. 7(a); (b) The binarized and de-noised result of (a).
Second, the characters in the license plate images are segmented into single ones. For each character image, the major axis and inverse rotation transformation described in Section 3.1 are performed to normalize the character image. For each normalized character image, we can extract similar features even if the original character image has various rotations.
3.4.1 Character Segmentation
Given a binarized license plate image, the orientation mentioned in Section 3.1 is obtained. Then, the connected-component
based method is used to segment the image into single characters. The characters of the connected-components are confirmed by two properties of the license plate: (1) The digits on the license plate are fixed on car license plates; (2) The characters lie in horizontal orientation. When the fixed numbers of character components in the license plate image are not obtained or the major axis of the binarized license plate image does not cross through all the character components, the license plate image is rejected.
Due to the possible various rotation angles of the characters in the input image, the major axis of each single character is measured and the inverse rotation transformation described in Section 3.1 is performed to normalize the character image. Figure 11 shows the normalized characters segmented from Fig 10(b).
Fig. 11: The normalized characters segmented from Fig. 10(b).
3.4.2 Character Recognition
The statistical character recognition method proposed by Tseng[13] is adopted to recognize the normalized characters segmented from the license plate.
四、Experimental Result
The system proposed in this project has been applied to 102 images with 104 license plates, involving vehicles at different pan/tilt angles. We implemented the proposed system on a Pentium II 300MHz PC with C++ language under Windows environment and used Nikon 5700 digital camera as an input device. For the license plate detection method, Fig. 12 shows the original car images, the possible license plate regions and the result image of license plate detection. There are 108 totally license plate images extracted from the test images.
The false license plate can be rejected in the character segmentation phase described in Section 3.4.1. But when the over detected license plate region is detected such as shown
in Fig. 13, it is also rejected in the character segmentation phase. In Fig. 13, the size of characters on the spare tire is similar to the size of characters on license plate. In this project, the license plate of such images can be detected but can not be recognized. The accuracy rates of recognition are listed in Table 1. There were 624 characters extracted from the license plate images.
Table 1: Recognition Results of Rotation-free Character Recognition
六、References
1. P. Comelli, P. Ferragina, M. N. Granieri, and F. Stabile, “Optical recognition of motor vehicle license plates,” IEEE Trans.
on Vehicular Technology, vol. 44, no. 4, pp. 790-799, 1995.
2. H. J. Kim, D. W. Kim, S. K. Kim, and J. K. Lee, “Automatic recognition of a car license plate using color image Processing,” Journal of Engineering
Design and Automation, Vol. 3, No. 1, 1997.
3. S. K. Kim, D. W. Kim, and H. J. Kim, “Recognition of vehicle license plate using a genetic algorithm based segmentation,” in Proc. of IEEE
International Conference on Image Processing, Lausanne Switzerland, Sep 16-19 1996, pp. 661-664.
4. C. Coetzee, C. P. Botha and D. Weber, “PC based number plate recognition system,” in Proc. IEEE International
symposium on Industrial Electronics, Pretoria, South Africa, vol. 2, July 1998, pp. 604-610.
5. Y.-T. Cui and Q. Huang, “Character extraction of license plates from video,” in Proc. Computer Society Conference on
Computer Vision and Pattern Recognition, St. Puerto Rico, June 17-19, 1997, pp 502-507.
6. H. Kurosaki, M. Yagi and H. Yokosuka, “Vehicle license number recognition system for measuring travel time,”
Journal of Robot. Mechatron., vol. 5, no.2, pp. 192-197, 1993.
7. G. Auty, et al., “An image acquisition system for traffic monitoring applications,”, in Proc. SPIE, vol. 2416, 1995, pp. 119-133.
8. S. H. Park, K. L. Kim, K. Jung and H. J. Kim, “Locating car license plates using neural networks,” IEEE Electronics
Letters, Vol. 35, No. 17, pp 1475-1477, Aug, 1999.
9. K. M. Kim, B. J. Lee, K. Lyou and G. T. Park, “The automatic recognition of the plate of vehicle using correlation coefficient and Hough transform,”
Journal of Control Automation and System Engineering, 3(5):511-519, 1997. 10. D. U. Cho and Y. H. Cho,
“Implementation of preprocessing independent of environment and recognition of car number plate using histogram and template matching,”
Journal of the Korean Institute of Communication Sciences, 23(1):94-199, 1998.
11. B. K. P. Horn, Robot Vision. MIT Press, London, 1986.
12. R. C. Gonzalez and R. E. Woods, Digital
Image Processing. 2nd Ed., Prentice Hall, N. J., 2002.
13. Y. H. Tseng, C. C. Kuo and H. J. Lee, "Speeding-up Chinese character recognition and its application on automatic document reading," Pattern
Recognition, vol. 31, no. 11, pp. 1589-1600, 1998.
14. L. Tu, et al., “Recognition of handprinted Chinese characters by feature matching,” in Int. Conf. on Computer Processing of
Chinese and Oriental Languages, 1991 pp. 154-157.
15. N. Otsu, “A threshold selection method from gray-level histograms,” IEEE Trans.
on System Man and Cybernetics, vol. 9, no. 1, Jan 1979, pp. 62-66.