行政院國家科學委員會專題研究計畫 成果報告
應用 Profile Monitoring 分析網路使用並結合問卷調查網
路服務之整合研究
研究成果報告(精簡版)
計 畫 類 別 : 個別型
計 畫 編 號 : NSC 99-2410-H-004-150-
執 行 期 間 : 99 年 08 月 01 日至 101 年 04 月 30 日
執 行 單 位 : 國立政治大學企業管理學系
計 畫 主 持 人 : 洪叔民
計畫參與人員: 碩士班研究生-兼任助理人員:許嘉文
報 告 附 件 : 出席國際會議研究心得報告及發表論文
公 開 資 訊 : 本計畫可公開查詢
中 華 民 國 101 年 08 月 03 日
中 文 摘 要 : 本研究收集四家社群網站的 Google Analytics 資料,以統計
方法進行分析並獲得許多顯著的成果:
1, 網路使用者具有一致的行為,並在以資訊為主的社群網站
和以社群活動為主的網站上有明顯的差異.
2, 運用關聯分析可以界定社群網站所處的階段,初使期`上
升期`成熟期`或衰退期.
3, 應用迴歸分析,離群值可用來正確判斷網站的流量變化.
中文關鍵詞: Google Analytics, 網路使用者, 行為分析
英 文 摘 要 :
英文關鍵詞:
Analysis of Users’ Behavior on Social Network Sites
Shwu-Min Horng Business Administration National Chengchi University, Taiwan (R.O.C.)
1 Introduction
The term “Web 2.0” was first documented at a series of conferences (O’Reilly, 2005), and many studies have been focused on its impact on the Internet. The key development of Web 2.0 services is the great increase of user-generated content on the Web, and the ability to easily search through it and combine parts of it to form new content. Three types of Web 2.0 collaborative tools are particularly important: Blogs, Mashups, and Wikis (Dearstyne, 2007). These tools have altered, and perhaps profoundly changed, the development of internet-based social network sites (referred to as SNS throughout the remainder of the article). The low entry barrier has made SNS a popular topic for start-up companies, and a subject for academic researches.
Because the content of any SNS is generated by users, their behaviors are critical to the success of the sites. Several studies analyzed the data collected from online social networks. Viswanath et al. (2009) collected data of friendship links and wall postings of users from the Facebook New Orleans Network to examine its activity network, a network that is based on the actual interaction between users from the perspective of social networking. They found that links in the activity network tend to come and go rapidly over time, and that the strength of ties exhibits a general decreasing trend of activity as the social network link ages. Based on complex network theory, Mislove et al. (2007) analyzed the structure of four online social networks, Flickr, You tube, LiveJournal, and Orkut. Their results confirmed the power-law, small-world, and scale-free properties of online social networks. That is, the in-degree of user nodes tended to match the out-degree; the networks contained a densely connected core of high-degree nodes, and this core linked small groups of strongly clustered, low-degree nodes at the fringes of the network.
The use of online social network sites might be related to offline activities. Through surveys of university students, Cardon et al. (2009) collected data from 11 countries to examine the offline and online social ties of social network sites users by nationality, levels of individualism-collectivism, gender, usage, age, and access location. Their results show no differences in the number of offline friends and online social ties between individualist and collectivist nations. However, heavy users in individualist nations maintain more offline social ties than those in collectivist nations. Focusing on the location factor, Gilbert et al. (2008) investigated behavioral differences between rural and urban social media users by analyzing online friendships and interpersonal messages from a social network site. They found that rural people communicate with fewer friends online, and those friends live much closer to home. In addition, differences are significant for gender distributions and the use of privacy features.
Propagation of online social networks is another important research topic. Leskovec et al. (2006) analyzed a person-to-person recommendation network and developed a stochastic model to explain the propagation of recommendations and cascade size. Barshy et al. (2009) modeled social influence based on the change in adoption rate following the actions of one’s friends and found that social networking plays a
significant role in the adoption of content. Adoption rates increase as the number of friends engaged in adopting increases and this effect varies with the connectivity of a particular user. Moreover, sharing among friends occurs more rapidly than sharing among strangers. Cha et al. (2009) studied how information spreads over online social networks and collected data on the generation and removal of friend links and of users on the Flickr social network. Their analysis showed that popular photos did not spread widely throughput the network, that popular photos spread slowly through the network, and that information exchanged between friends was likely to account for over half of all favorite markings, but with a significant delay at each hop. Zhang et al. (2009) studied the effect of social networking on the problem of data diffusion, which diffuses data among all moving nodes so that the nodes that are interested in this data item can get it easily either from friend nodes or stranger nodes. To achieve better performance, they discovered that when a node meets a new contact, it should first diffuse data similar to their common interests if the new contact is a friend; it should diffuse data different from their common interests if the new contact is a stranger.
Many tools are available to measure website use. Three favorites of Web analytics software are Google Analytics, ClickTracks, and Coremetrics (Chafkin, 2006). Google Analytics is the only one among the three systems that is free of charge, and several studies have reported its applications in practice. A university library developed several interactive tutorials that covered basic services, and used Google Analytics to record usage statistics and perform assessments (Braender et al., 2009). Also with respect to Web 2.0 settings, a university created an interactive learning platform in which faculty and students could write and comment about emerging social issues surrounding the Web. They also used Google Analytics to gather usage information (Betty, 2008). Another company used Google Analytics in conjunction with website optimization provider SiteSpect to evaluate the quality of video distribution. This company’s senior marketing manager also used the data to test the video’s placement on its Web page (Bannan, 2008). A platform named AjaxScope was developed for remotely monitoring the client-side behavior of Web 2.0 Applications. It is a dynamic instrumentation platform that enables cross-user monitoring and just-in-time control of web application behavior on end-user desktops (Kıcıman & Livshits, 2007). Plaza (2009) utilized data from Google Analytics to develop a new user-friendly in-house tracking methodology for academics to analyze the effectiveness of visits, return-visit behavior and length of sessions, depending on their traffic source: direct visits, referring site entries and search engine visits. He found that return visits were the main engine for nurturing session length. These applications of Google Analytics from the literature focused on the performance of a single web service and improvement by benchmarking, while cross-websites analysis might provide information on a broader view of cyberspace. With the aforementioned studies in view, this research analyzed several SNSs through their data of recording the daily uses of users. Working with four Web companies, this study analyzed their Google Analytics data and aimed at the following objectives:
- Identifying the important measures and studying the relations among them. - Discovering commonality across the four companies.
- Providing managerial implications based on the statistical results.
2 Data Collection and Analysis
2.1 Case Companies Identification and Selection
In this paper 25 SNSs were investigated initially. They had been in operation for no more than two years, and are partially sponsored by and/or are receiving technical support from the Institute of Information Industry (III), a non-governmental organization jointly sponsored by the Government of Taiwan and
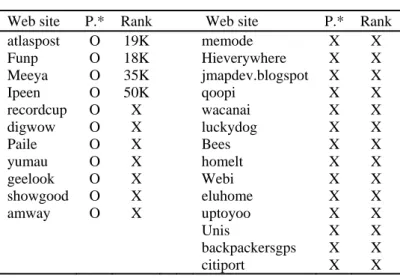
prominent private enterprises for the purpose of assisting the development of the information industry in Taiwan. Several of them were participants of the DEMO show and one of them received the People’s Choice Award in 2008. Armstrong and Hagel III (1995) indicated that building a critical mass of members was necessary for a virtual community to survive. Those web services with a large number of members or users are appropriate candidates for this study. In order to identify such SNSs, their ranking in Alexa.com was i and shown in Table 1. The four web sites listed at the top rows of the table have the highest ranks among all, and they have been selected for further study.
Web site P.* Rank Web site P.* Rank
atlaspost O 19K memode X X Funp O 18K Hieverywhere X X Meeya O 35K jmapdev.blogspot X X Ipeen O 50K qoopi X X recordcup O X wacanai X X digwow O X luckydog X X Paile O X Bees X X yumau O X homelt X X geelook O X Webi X X showgood O X eluhome X X amway O X uptoyoo X X Unis X X backpackersgps X X citiport X X Notes: - *: Pageview and reach.
- Data in columns P* and Rank were retrieved from www.alexa.com on 11/27/2008.
- “X” means data were unavailable due to insufficient information. “O” indicates that the data were recorded. - The figures in the column “Rank” are estimated values based on the curve in the graph online.
- According to www.alexa.com, a site's ranking is based on a combined measure of reach and pageviews. Reach is determined by the number of unique Alexa users who visit a site on a given day. Pageviews are the total number of Alexa user URL requests for a site.
Table 1: List of the 25 SNSs and their ranks recorded on Alexa.com.
2.2 Google Analytics Measures
The data on Google Analytics are only available for those registering their site on Google. After performing some basic configuration details, a small text file containing the security key is required to be downloaded into the server. Next, the JavaScript snipper should be added to each page of the site to activate the collection of data. The four companies based in Taiwan agreed to provide their Google Analytics data for this study. For reasons of confidentiality, the companies in this study are represented as A, B, C, and D with data recorded for 989, 328, 615, and 480 days during the period from the years 2006 to 2009, respectively. Since these companies are relatively new and some of their daily visits were quite low at the beginning, only the data with the number of daily visits consistently over 1000 were used in this
study. All of the four companies had been established within three years prior to the period when the data
were collected. A brief introduction of them follows. Company A provides a site to collect articles according to topic. Articles on different sites are tagged or recommended on this site so that users can read many high-quality articles regarding a specific topic in one specific place. Company B offers a free
platform for student users, especially campus clubs, to interact on the site. Company C mainly focuses on information on restaurants and users can either search them by location or by taste. Company D combines maps and blogs so that users can post their articles on the locations indicating where they live.
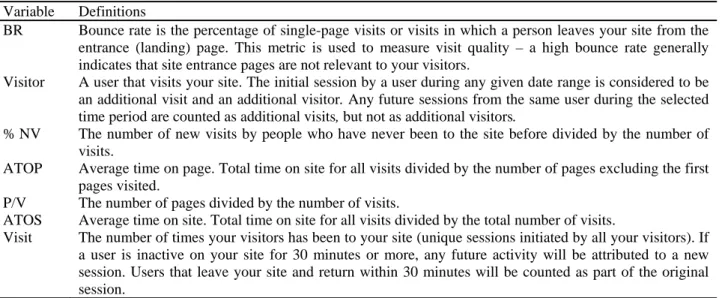
Variable Definitions
BR Bounce rate is the percentage of single-page visits or visits in which a person leaves your site from the entrance (landing) page. This metric is used to measure visit quality – a high bounce rate generally indicates that site entrance pages are not relevant to your visitors.
Visitor A user that visits your site. The initial session by a user during any given date range is considered to be an additional visit and an additional visitor. Any future sessions from the same user during the selected time period are counted as additional visits, but not as additional visitors.
% NV The number of new visits by people who have never been to the site before divided by the number of visits.
ATOP Average time on page. Total time on site for all visits divided by the number of pages excluding the first pages visited.
P/V The number of pages divided by the number of visits.
ATOS Average time on site. Total time on site for all visits divided by the total number of visits.
Visit The number of times your visitors has been to your site (unique sessions initiated by all your visitors). If a user is inactive on your site for 30 minutes or more, any future activity will be attributed to a new session. Users that leave your site and return within 30 minutes will be counted as part of the original session.
Table 2: Google Analytics measures used in this study and their definitions.
Many measures are available on Google Analytics for retrieval (Google, 2011). Thirteen dimensions in which each dimension contains two to more than 20 metrics resulting in more than 100 metrics are available for the site operator to define, store, and retrieve. After a discussion with several founders of SNSs, 15 important variables were identified, including Bounces, Bounce Rate, Entrances, Exits, percent of Exits, Visitors, New Visits, Percent of New Visits, Time on Page, Average Time on Page, Pageviews, Number of Pages / Visits, Time on Site, Average Time on Site, and Visits. These variables are mainly defined in three dimensions: Visitor (for the count), Session (for time-related measures), and Page Tracking (for page-related measures). Because these companies are relatively new, their major source of revenue is advertising that is heavily dependent on traffic flow and pages viewed. These variables were selected accordingly from the perspective of web operators. Since some of the variables are combinations of others, the data were further reduced into seven items. Table 2 shows the seven measures used in this study and their definitions from Google (Google, 2009). Visit and visitor usually increase significantly as the web service develops its reputation and gains loyal users. However, the other measures remain relatively stable unless the web service undergoes a major change of its contents.
Title of the chapter should be right-aligning, 16-point Times New Roman, bold, 60-point before and 12-point after the title.
3 Data Collection and Analysis
3.1 Descriptive Statistics Analysis
One of the four companies, D, separates its users into two types when collecting data at Google Analytics, those who login as members or as regular browsers. Although members might not login as visiting the site,
they account for only a small portion based on a focus-group interview with its members. These two groups are represented as D-M and D-Non for member users and non-member users, respectively, in company D. Although other companies also have memberships to separate non-members from members, they did not specify this function at Google Analytics. In addition, their members and non-members receive different, but insignificant benefits and the factor of membership is ignored for companies A, B, and C. The basic statistics of the five measures, including average, standard deviation, coefficient of variation, and range across the seven Google Analytics measures for the four companies for six cases, are shown in Table 3.
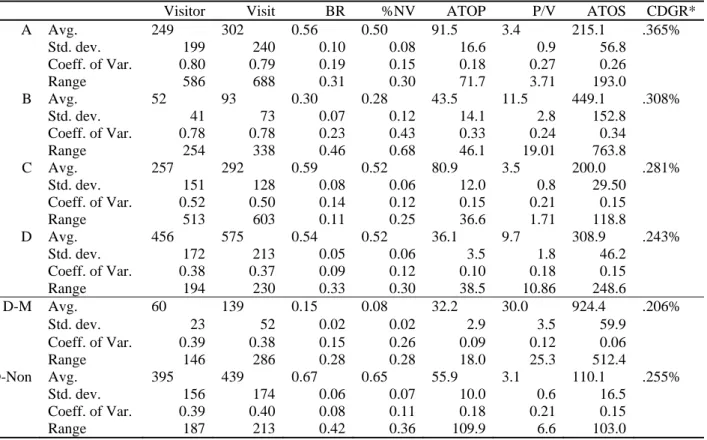
Visitor Visit BR %NV ATOP P/V ATOS CDGR*
A Avg. 249 302 0.56 0.50 91.5 3.4 215.1 .365% Std. dev. 199 240 0.10 0.08 16.6 0.9 56.8 Coeff. of Var. 0.80 0.79 0.19 0.15 0.18 0.27 0.26 Range 586 688 0.31 0.30 71.7 3.71 193.0 B Avg. 52 93 0.30 0.28 43.5 11.5 449.1 .308% Std. dev. 41 73 0.07 0.12 14.1 2.8 152.8 Coeff. of Var. 0.78 0.78 0.23 0.43 0.33 0.24 0.34 Range 254 338 0.46 0.68 46.1 19.01 763.8 C Avg. 257 292 0.59 0.52 80.9 3.5 200.0 .281% Std. dev. 151 128 0.08 0.06 12.0 0.8 29.50 Coeff. of Var. 0.52 0.50 0.14 0.12 0.15 0.21 0.15 Range 513 603 0.11 0.25 36.6 1.71 118.8 D Avg. 456 575 0.54 0.52 36.1 9.7 308.9 .243% Std. dev. 172 213 0.05 0.06 3.5 1.8 46.2 Coeff. of Var. 0.38 0.37 0.09 0.12 0.10 0.18 0.15 Range 194 230 0.33 0.30 38.5 10.86 248.6 D-M Avg. 60 139 0.15 0.08 32.2 30.0 924.4 .206% Std. dev. 23 52 0.02 0.02 2.9 3.5 59.9 Coeff. of Var. 0.39 0.38 0.15 0.26 0.09 0.12 0.06 Range 146 286 0.28 0.28 18.0 25.3 512.4 D-Non Avg. 395 439 0.67 0.65 55.9 3.1 110.1 .255% Std. dev. 156 174 0.06 0.07 10.0 0.6 16.5 Coeff. of Var. 0.39 0.40 0.08 0.11 0.18 0.21 0.15 Range 187 213 0.42 0.36 109.9 6.6 103.0
*CDGR: compound daily growth rate.
Table 3: Basic statistics of the measures for the five cases.
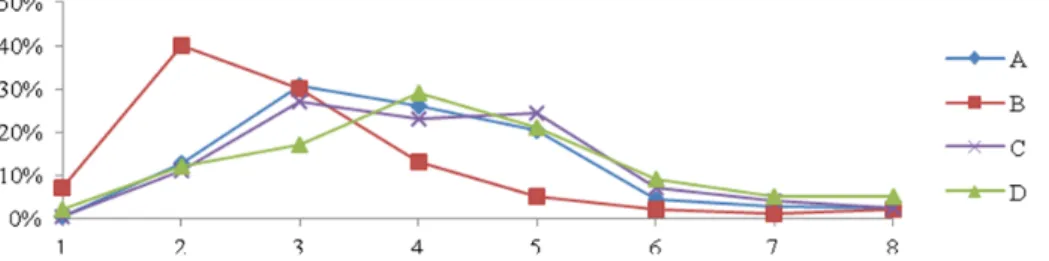
Some of the data are camouflaged for confidential reasons. However, the relative relations between cases remain the same. When comparing the four companies, company D attracts the most visitors/visits; followed by companies A and C; company B has the fewest visitors. Companies A, C, and D have very close results for BR and %NV, indicating the possible similarities of their user profiles that are supported by Figure 1. Company B has the lowest visit/visitor ratio, but the low %NV and BR, high P/V as well as high ATOS indicate that it has a focused group of users. Company A has the highest ATOP as expected, since its users visit this site to read articles. Three measures, ATOP, P/V, and ATOS, represent how visitors behave on the site. From these three measures, companies A and C seem to make up one group while B and D form another group. Visitors of companies A and C know which pages they prefer, spend more time on certain pages, and leave when they finish reading their target pages. On the other hand,
visitors of companies B and D spend more time on the site with less time devoted to each page. This is not surprising because these two companies have similar strategies for attracting visitors. For example, both of them have activities of voting for the most popular girls to attract a high volume of voters and viewers. However, company B relies on such activities more than D because of its higher CV and range for the three measures. D is the most stable company with the lowest value of CV across all of the measures. Generally speaking, none of the case companies outperforms the others in all of the measures and their users seem to behave in distinctive ways.
Figure 1: Distributions of the users for the four companies. 1 indicates ages 15 and younger, 2
to 7 indicate the ranges of (15, 20) to (40, 45), and 8 represents ages 45 and older.
The member and non-member measures for company C provide a useful reference to evaluate these measures individually. Compared with the non-member measures, members have higher P/V and ATOS, and lower BR, %NV, and ATOP. All of the measures distinguishing member from non-member are intuitively reasonable except ATOP, which is lower for members--possibly because many non-member users spend more time on those unfamiliar pages, and member users tend to browse more pages in a given time. Note that the %NV for members is 8%. Since Google Analytics defines a new visit by no previously visited records found on the cookies of their computers, some members are recognized as new visitors if their records on cookies are cleaned frequently.
3.2 CDGR Analysis
The last column in Table 3 shows the compound daily growth rate that measures the daily compound increase rate of visits from the first date to the last date of record. It is interesting to note that the four companies have similar numbers on this measure, which might be used as a benchmark indicator for other web services. Although company D has the lowest rate at .243%, it has the highest number of visits among all and this might be an indication that the increase in the number of their users has slowed down. Similarly, company B has the lowest visit tally, suggesting it is easier for them to grow. The members of company D increase at a slower rate than its non-members, as expected (.206% vs. .255%). To have a better understanding of their visit changes over time, the CDGR measures for each case are calculated starting from day 100 up to the final days of each case. That is, the CDGR at day 100 is the visits at day 100 against day 1; CDGR at day 101 is the visits at day 101 against day 2, and so on. The equation for calculating the CDGR is as follows:
(Total visits at dayt)(1+CDGR)
100
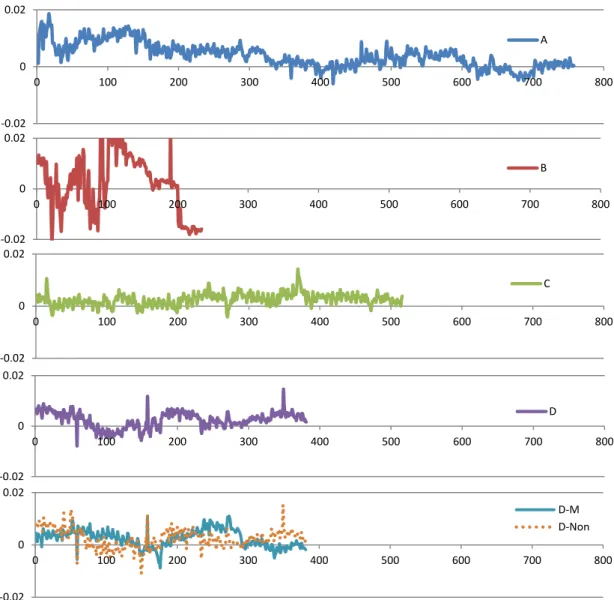
Figure 2: Results of the continuous Compound Daily Growth Rate (CDGR) for the six cases.
The X-axis does not indicate the same date for the cases, except for the bottom three charts from the same company, and it simply represents the first recorded day of CDGR.
Figure 2 show the results of the continuous CDGR for the six cases. It is clear that company A draws a significant amount of attention at the early stage, but the pattern shows that the curve has a negative slope in the long run and its future will become blurred without a fundamental change. From the longitudinal observation, Company B undertook several large-scale promotional campaigns and they are revealed by the up-and-down shape of the curve. In terms of stability, company C has the best performance with very few fluctuations. In addition, a large portion of the curve remains above zero, indicating the steady increase of its users. Although company D records the largest number of visits and registered members among the four companies, its curve shows that the number of its visitors fluctuates moderately. Noticeably, the curves of members and non-members reveal an interesting pattern. A gap of
‐0.02 0 0.02 0 100 200 300 400 500 600 700 800 A ‐0.02 0 0.02 0 100 200 300 400 500 600 700 800 B ‐0.02 0 0.02 0 100 200 300 400 500 600 700 800 C ‐0.02 0 0.02 0 100 200 300 400 500 600 700 800 D ‐0.02 0 0.02 0 100 200 300 400 500 600 700 800 D‐M D‐Non
approximately 50 days appears between the two curves. Without considering the large deviations, the first bottom of the non-member curve is at day 100 while the member’s is at day 150; the second peak of the member curve is at day 200 while the member’s is at day 250; and the second bottom of the non-member curve is at day 300 while the non-member’s is at day 350. Do non-member users follow the behavior of non-member users, or vice versa? What causes the time lag? Is it the services provided by the company, the time required for non-members to become members, interaction among users, or something else? These questions remain unanswered pending further investigation.
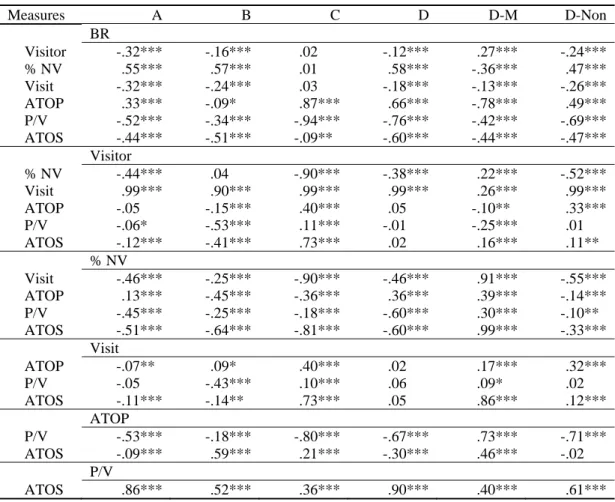
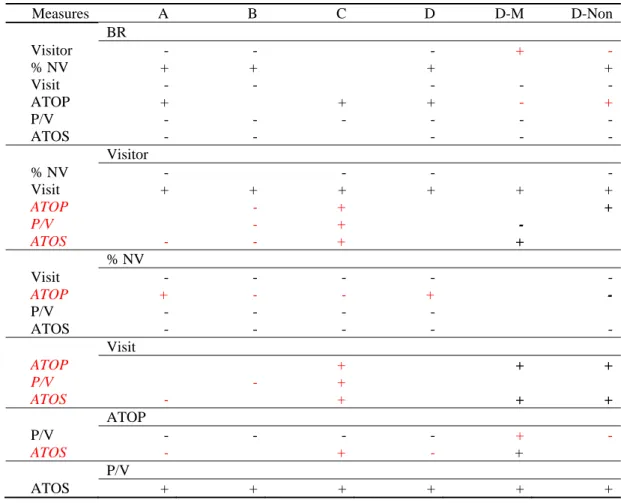
3.3 Correlation Analysis
The Pearson correlations among the measures for the six cases are illustrated in Table 4. To clearly visualize the differences among them, Table 5 shows only the relationships with a significant level of 0.01 to provide better confidence about the results. The “+” sign indicates a positive relationship while the “-” sign indicates a negative relationship. All of the data regarding %NV for the member case of company D are ignored due to possible misinterpretations. The relationship of P/V and ATOS is not shown in Table 5 because it remains the same across the six cases.
Among cases A, B, C, and D, several correlations, illustrated in red and italic fonts, show opposite effects. The following is a detailed analysis along with managerial implications:
- According to the definitions, the measure of visit will be slightly higher than that of visitor because the same visitor visits the same site more than once in the course of a day. It is expected that the relationship of these two measures with others will be nearly identical, and this hypothesis is commonly supported from the Pearson correlation results.
- Relationships of BR with others are similar across the four companies. A higher BR results in a lower visit/visitor ratio, because the positive relation between BR and %NV implies that more new visitors, more likely to leave the site at the entrance page, will reduce the total number of visit/visitor. It is also predictable that a new visitor will spend more time on each page and spend less time on the site with fewer pages viewed.
- For the relationships of visitor and the other three measures, ATOP, P/V, and ATOS, company C shows positive effects while those for companies A and B are negative. As mentioned previously, compared to others, the service of company C is primarily devoted to providing information with little emphasis on user interaction. This phenomenon, a positive relationship between visitor and ATOP, P/V, and ATOS, could serve as a distinction to separate information-oriented web services from interaction-oriented services.
- The two relationships, %NV vs. ATOP and ATOP vs. ATOS, seem to separate the four companies into two groups with A and D in one group, and B and C in the other group. Using the members and non-members of company D as benchmarks, users of companies A and D behave more like the non-members of company D while users of companies B and C act like non-members. It is intuitively expected that users of companies A and D have a higher degree of loyalty toward their web services. More frequent social relationships are also predictable. Compared to companies B and C, A and D have better platforms for user interaction. Company A is a site for reading articles and exchanging opinions on certain topics. A mechanism is used to encourage interactions such as posting articles, replying to the posting, rating the posting, and so on. Additional benefits are also provided to those receiving a high rating of their posting. New users are easily attracted by certain articles or postings, but leave the site earlier than regular users after spending time reading. Company D has postings on location to facilitate the interactions of users interested in or living at certain locations. Interviews with several heavy users of company D also revealed that they have occasional offline interactions, such as meeting or trop and a special name for those who consider themselves loyal users of the site. Although no data were collected to provide
evidence, it is clear that companies A and D have a higher level of social interactions among their users than the other two companies. The social influence among users is also expected to play a more important role in companies A and D than in B and C. Unlike regular users, new users of company C are not familiar with its service, so they probably spend less time reading the information presented on each page, and finish their browsing whenever the first available piece of information is discovered. As for company B, it employed several major promotional campaigns, attracting many new users whose main purpose was to browse certain pages such as the outcome in voting for the most popular girl on campus. After observing their highly fluctuating daily visitor tally, most new users do not become regular users as anticipated.
As for the members and non-members of company D, different results appear for the relationships of BR and visit, BR and ATOP, and ATOP and P/V. It is expected that a higher bounce rate will lead to fewer non-member visitors. However, more visitors and fewer visits for members are out of the ordinary. It implies that those member users who visit the site once or twice in one day could behave differently than the member users who visit the site more frequently in one day. A possible explanation is that the former type of member user visits the site on a different schedule than the other type of member user does, and such a member may leave the site at the entrance page without further browsing, resulting in a higher bounce rate. Measures A B C D D-M D-Non BR Visitor -.32*** -.16*** .02 -.12*** .27*** -.24*** % NV .55*** .57*** .01 .58*** -.36*** .47*** Visit -.32*** -.24*** .03 -.18*** -.13*** -.26*** ATOP .33*** -.09*** .87*** .66*** -.78*** .49*** P/V -.52*** -.34*** -.94*** -.76*** -.42*** -.69*** ATOS -.44*** -.51*** -.09** -.60*** -.44*** -.47*** Visitor % NV -.44*** .04 -.90*** -.38*** .22*** -.52*** Visit .99*** .90*** .99*** .99*** .26*** .99*** ATOP -.05*** -.15*** .40*** .05*** -.10*** .33*** P/V -.06*** -.53*** .11*** -.01*** -.25*** .01*** ATOS -.12*** -.41*** .73*** .02*** .16*** .11*** % NV Visit -.46*** -.25*** -.90*** -.46*** .91*** -.55*** ATOP .13*** -.45*** -.36*** .36*** .39*** -.14*** P/V -.45*** -.25*** -.18*** -.60*** .30*** -.10*** ATOS -.51*** -.64*** -.81*** -.60*** .99*** -.33*** Visit ATOP -.07*** .09*** .40*** .02*** .17*** .32*** P/V -.05*** -.43*** .10*** .06*** .09*** .02*** ATOS -.11*** -.14*** .73*** .05*** .86*** .12*** ATOP P/V -.53*** -.18*** -.80*** -.67*** .73*** -.71*** ATOS -.09*** .59*** .21*** -.30*** .46*** -.02*** P/V ATOS .86*** .52*** .36*** .90*** .40*** .61***
Measures A B C D D-M D-Non BR Visitor - - - + - % NV + + + + Visit - - - ATOP + + + - + P/V - - - ATOS - - - Visitor % NV - - - - Visit + + + + + + ATOP - + + P/V - + - ATOS - - + + % NV Visit - - - - - ATOP + - - + -P/V - - - -ATOS - - - - - Visit ATOP + + + P/V - + ATOS - + + + ATOP P/V - - - - + - ATOS - + - + P/V ATOS + + + + + +
Table 5: Pearson correlations of the Google Analytics measures for the six cases The “+” and “-”
signs indicate significant relationships at 0.01. Red and italic fonts at the measure column indicate different results across the four companies, A, B, C, and D. The red “+” and ”-” signs at the two rightmost columns represent the different results between members and non-members for company D.
3.4 Daily Change Analysis
Since the daily record of web sites is easily influenced by many events, outliers should be removed from the analysis. The following procedure is used to identify outliers.
‐ At the first step, the daily visit change is calculated. For example, assuming the total visits are 100 at day 1 and 120 at day 2, the daily change for day 2 is (120-100)/100 = 20%.
‐ Use the total set of daily change data calculating the mean and standard deviations. ‐ Standardize the data using the mean and standard deviations obtained at the previous step.
‐ Focus on those having an absolute standardized value greater than three and consult with the site management to identify major events around these data (dates). These data will remain unless major events are confirmed, and the data around the events will be removed from the calculations for further consideration. Examples of major events include online contests, server upgrades, new service initiation, and so on.
Table 6 shows the average daily changes across six cases. Although only one value is significant at the 0.05 level, it is interesting to note that all of them, except C, share the same pattern. Their visits increase on Monday, reach highest peak on Tuesday, start decreasing on Wednesday, maintain the downward slide until Saturday, and then experience the largest increase on Sunday.
A B C D D-M D-Non Mon. 0.081 0.061 0.200*** 0.073 0.075** 0.072 Tue. 0.023 0.023 0.011 0.010 0.010** 0.014 Wed. -0.006 -0.024 0.004 -0.014 0.000** -0.018 Thu. -0.009 -0.026 0.018 -0.018 -0.005** -0.022 Fri. -0.093 -0.016 0.004 -0.047 -0.087** -0.030 Sat. -0.065 -0.124 -0.148* -0.056 -0.075** -0.046 Sun. 0.155 0.064 -0.016 0.111 0.136** 0.104
***: significant at the 0.01 level **: significant at the 0.05 level *: significant at the 0.1 level
Table 6: Daily changes in average by weekday for the six cases.
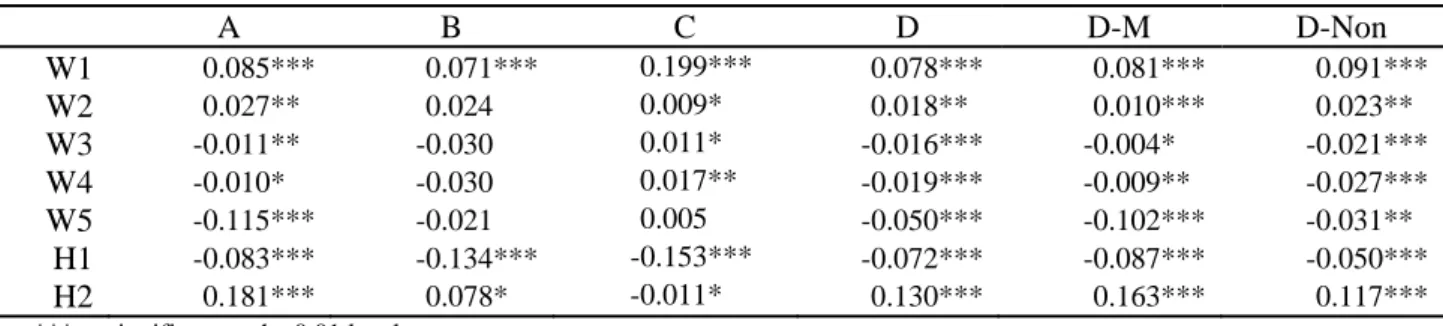
A B C D D-M D-Non W1 0.085*** 0.071*** 0.199*** 0.078*** 0.081*** 0.091*** W2 0.027*** 0.024*** 0.009* 0.018*** 0.010*** 0.023*** W3 -0.011*** -0.030*** 0.011* -0.016*** -0.004*** -0.021*** W4 -0.010*** -0.030*** 0.017** -0.019*** -0.009*** -0.027*** W5 -0.115*** -0.021*** 0.005 -0.050*** -0.102*** -0.031*** H1 -0.083*** -0.134*** -0.153*** -0.072*** -0.087*** -0.050*** H2 0.181*** 0.078*** -0.011* 0.130*** 0.163*** 0.117***
***: significant at the 0.01 level. **: significant at the 0.05 level. *: significant at the 0.1 level.
Table 7: Daily changes by labelling working days and holidays for the six cases after removing
the outliers and renaming the days.
It is reasonable to assume that non-working days are the key issue, not weekdays. Although Saturday and Sunday are non-working days in Taiwan, several days, excluding Saturday and Sunday, are reserved as national holidays. The data are reset and labeled as W1 (first work day), W2 (second work day), W3 (third work day), W4 (fourth work day), W5 (fifth work day), H1 (first non-work day), and H2 (second non-work day). For non-work days lasting more than four consecutive days, only the data from the first day (H1) and the last day (H2) will be used. Results are shown in Table 7 and most of the data are significant at 0.01. Although company B has four insignificant values out of seven, it is rationally explained by its smaller sample size (40-45) compared with other cases having larger sample sizes (65-120). Had more data been collected, it is very likely that all of the data would be significant.
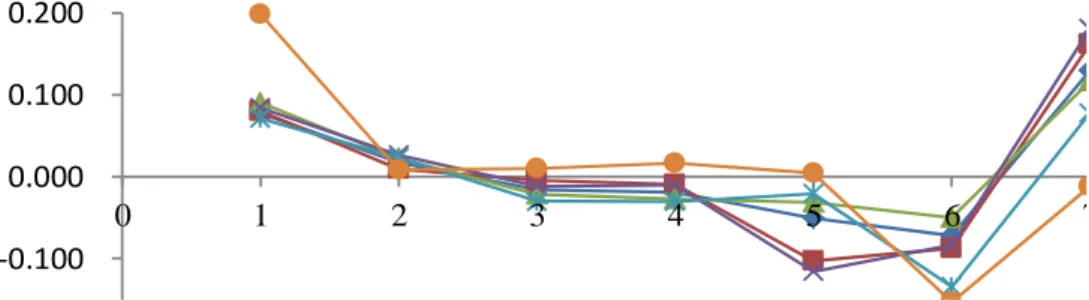
Figure 3 illustrates the plots of the daily changes by label for the five cases. After interviews with at least one user from each case and one representative from each company, a typical user’s behavior can be described as follows: On the first non-work day, the user engages in his/her regular activity such as taking
a trip, meeting friends, etc. On the second non-work day, it is time to get online and either share the experience with friends online or simply browse the Web. However, many people are preoccupied by the preparation for the coming week or other family affairs, and they tend to delay doing so for one or two days. The visits then start decreasing on Wednesday and continue until Friday. Except for company C, this “Holiday Syndrome” named in this research is observed not only across different companies (A, B, and D), but also across the two different groups of users (member and non-member) within the same company.
‐0.100 0.000 0.100 0.200
0 1 2 3 4 5 6 7
Figure 3: Daily changes in average by labels for the six cases. 1 is the first working day (W1 in
Table 7), 2 is the second working day (W2 in Table 7), and so on. 6 is the first non-working day (H1 in Table 7) and 7 represents the second non-working day (H2 in Table 7).
Although the curve of company C shares the same pattern as the others, it is significantly different in several ways. First, whereas the others have the largest increases of visitors on the second non-working day, usually Sunday, its largest increase is observed on the first working day, usually Monday. Second, when others have an increased number of visitors on the second non-working day, its number of visitors follows the pattern of the first non-working day and continuously drops. Third, when the others start declining during the second half of the working days, it constantly increases and reaches the highest number of visitors on the last working day, normally Friday. A probable explanation is that the service of company C has a different approach from that of the other three companies. Its service focuses on providing information for restaurants and offers less user interaction compared to the other three companies. Its number of visitors reaches highest peak on Friday because most of them are planning to have a nice meal in the evening or during the weekends. When the users of the other three companies start sharing their weekend experience on the last non-working day, the users of company C do not have a similarly strong intention of doing the same.
3.5 Multiple Regression Analysis
An FGI was conducted consisting of founders from the case companies and several practitioners with extensive working experience in E-commerce. It is agreed that advertisements are the most important revenue source for SNSs currently operating in Taiwan and they are heavily dependent on the measure of visit. To understand how other variables influence visit, multiple regressions are used to study the relationships among those variables. Although a pairwise correlation relationship could provide information about the dependent variable and the independent variables, the unique explanatory powers of independent variables on the variance of the dependent variable can only be revealed in multiple regression models. Preliminary results show that the models suffered by autocorrelation, and it is expected since these are time series data. To alleviate this problem, visits of the previous date are included in the
model and it will not be discussed due to its irrelevance. The following are the steps for multiple regressions.
- Identify the dependent variable as visit. Include all of the other variables as independent variables. - Use a stepwise method to select the variables included in the final regression models. All of the models
are run under SPSS version 15.
- Make sure the underlying assumptions for multiple regressions are satisfied, including linearity of the phenomenon measures, normality of the error term distribution, independence of the error term, and constant variance of the error term. Transform the data if necessary.
- Check the collinearity among independent variables, and remove those with VIF (Variance Inflation Factor) of larger than 10, as recommended by Hair et al. (2009).
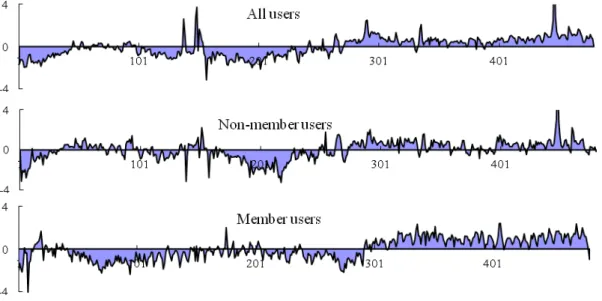
Figure 4: Standardized residual plots against recorded days for cases of company D in total,
member users, and non-members, respectively.
Figure 4 illustrates the standardized residual plots by multiple regressions with visit as the dependent variable along the recorded day for cases of D, D-M, and D-Non, respectively. Residual is the difference between the observed value of the dependent variable and the predicted valued computed from the multiple regression model. Normalizing the residual will produce the standardized residual in which most of them should fall between 3 and -3 based on normal distribution. It is noticeable that company D experiences a sudden change in their daily visits around day 280. After discussion with the company’s management, it is believed that this phenomenon is caused by a change of business model. In order to have a relatively stable source of revenue, this company starts charging heavy users a membership fee around day 250. This policy affects the predictions of the three regression models in similar ways in that they underestimate the number of visits before the announcement and overestimate the number of visits after the announcement. Since the impact of the announcement on members’ behavior seems delayed until around day 300 as indicated at the bottom of Figure 4, the analysis for company D’s member users and non-member users are divided into two sections: before day 240 and after day 290, resulting in four cases. The clear separation of the regression residuals into two sections suggests that multiple regression is capable of detecting the important strategic change and is suitable for the analysis.
The definitions of independent variables need to be clarified before further discussion. ATOP, average time on page, represents the depth of the content for a site. A higher ATOP indicates that the content is attractive and that users are willing to spend more time viewing such pages. On the other hand, P/V, pageview per visit denotes the width of the content for a given site. A high P/V suggests that users browse many interesting pages on the site. A typical example is an SNS featured with photos of many beautiful girls to attract users who browse through the photos within a short period of time. Although ATOS, average time on site, is mathematically close to the product of ATOP and P/V (when visitors leave the site at the entrance page, it will be excluded from the total pages viewed for calculating P/V), its impacts on visit are not the combination of these two measures.
%NV is an indicator of how the site attracts new users, and is expected to decline over time, since the base of new users is shrinking. Figure 5 shows the %NV of companies A, B, C, and D over recorded days. As predicted, they all decrease the longer they stay in business. As mentioned previously, company C provides different services than the others in terms of its business orientation and shows a relatively more stable curve over the others. Company B reaches its low point at an early stage, indicating that fewer new users visit its site, and the upward curve from the bottom signifies a major promotional activity. In general, company B is in a desperate position with its low %NV. The curves of companies A, C, and D stabilize at approximately 50%. Given that a certain portion of the new visitors had actually visited the site before and were recorded as new because they frequently clean their cookies in the computer, the actual percent of new visits is expected to be approximately 40% when the SNS is stabilizing. This can be used as an indicator of a stabilized SNS. Companies A, B, and D seem to experience a major drop before climbing to a higher %NV. Is this an unavoidable obstacle any interaction-oriented SNS is forced to experience and overcome, or is it simply a coincidence among the companies selected in this study? Further research can focus on this topic and provide a better understanding of user behavior on SNSs.
Figure 5: %NV plots against recorded days for companies A, B, C, and D, respectively.
Initially all of the regression models contain visit as the dependent variable and other measures including visit on the previous date, ATOP, ATOS, %NV, and BR are the independent variables. A stepwise method is used to select the independent variables included in the final regression model, and results are shown in Table 7. All of the models are significant at 0.01 with R squares ranging from .687 to .969. No significant differences are found between R square and adjusted R square for all cases
0.1 0.2 0.3 0.4 0.5 0.6 0.7 0.8 0 100 200 300 400 500 600 700 800 900 1000 A B C D
indicating no over-fitting for the independent variables. P/V is excluded from all of the models because it has a high VIF value for all of the models during the variable selection process.
Model summaries A B C* Db Da D-Mb D-Ma D-Nonb D-Nona N 963 327 614 238 215 238 215 238 215 R-sq. .969 .795 .962 .752 .830 .850 .687 .728 .840 Adj. R-sq. .969 .793 .961 .747 .825 .848 .678 .724 .837 Model Sig. .000 .000 .000 .000 .000 .000 .000 .000 .000 Ind. Var. Visitt-1 .963 .797 .555 .574 .216 .825 .388 .511 .669
ATOP NIM .136 NIM NIM .777 -.123 .279 -.119 NIM
ATOS -.027 -.252 .049 -.406 -.254 NIM .183 NIM -.324
% NV -.028 NIM -.417 -.237 .312 NIM .514 NIM -.323
BR NIM -.193 NIM -.280 -.482 .169 -.216 -.363 -.168
P/V NIM NIM NIM NIM NIM NIM NIM NIM NIM
Notes:
All of the numbers shown in the table for independent variables are significant at 0.01. NIM: not included in the model.
a
: after day 290 for company D.
b
: before day 240 for company D.
*: log transformation of the dependent variable was used in order to have a constant variance of error.
Table 7: Results of multiple regression for cases A, B, C, D before collecting fees, D after
collecting fees, members of D before collecting fees, members of D after collecting fees, non-members of D before collecting fees, and non-non-members of D after collecting fees.
Cases Ind. Var.
Pearson correlation against visit
A B C* Db Da D-Mb D-Ma D-Nonb D-Nona ATOP -.07*** .09*** .40*** -.41*** .80*** -.65*** .12* -.51*** .51*** ATOS -.11*** -.14*** .73*** -.09 -.59*** -.11* .04 .33*** -.38*** % NV* -.46*** -.25*** -.90*** -.48*** .55*** -.53*** -.62*** BR -.32*** -.16*** .03 -.52*** .49*** .13* -.22*** -.74*** .47*** Cases Ind. Var.
Multiple regression results
A B C* Db Da D-Mb D-Ma D-Nonb D-Nona
ATOP + + - + -
ATOS - - + - - + -
% NV* - - - + -
BR - - + + - - -
*: %NV is not included when building the regression models for members of company D because they are not new users.
Table 8: Results of multiple regression and correlations for the cases as in Table 6. The “+”
and ”-” signs represent significantly positive and negative coefficients at 0.01, respectively.
To better visualize the results, the pairwise correlations of visit and other independent variables, and the coefficients of regression models are reprinted in Table 8. The signs of the significant coefficients of regression models match the correlation results. When comparing companies A, B, C, and D, only the case before the announcement for D (Db) is used because it has the same condition as the others, i.e., it is
cost-free for surfing the site. The four companies show similar results, except for the sign ATOS for company C. An SNS with user interaction as the primary function could take this model as a reference in that the visit is influenced negatively by ATOP, ATOS, %NV, and BR, respectively. On the other hand, an SNS concentrating on information will experience a higher number of visits, while ATOS is increased, and %NV is lower. When reviewing the curve on Figure 5, the constant up and down of %NV for company C implies that it undergoes systematic change over time. It seems that most new users visit the site on weekends, and its users’ behaviors are the most predictable among all of the cases in this study. By observing the user behavior of the four web sites, company C is the one with the least user interactions compared to the other three. Assume company C is on the way to evolving from Web 1.0 to Web 2.0, the sign of ATOS on the correlation relationship with visits and on the multiple regression model might be an indicator which is positive for Web 1.0 services and negative for Web 2.0 service. In addition, users on Web 1.0 service might not follow the holiday syndrome as defined previously for Web 2.0 users.
Company D undertook a major strategic change and the signs in the two columns, Db and Da show different results for &NV and BR. When examining the results for non-members, no significant difference is found before and after the announcement, since the users were not affected by the change. The results for members indicate they behave differently at ATOP and BR. These differences are understandable because paying members spend more time on each page, and they visit the site for a purpose so as to get what they pay for.
4 Conclusions
This study is the first attempt to analyze the Google Analytics data from multiple web companies. These web services all positioned themselves as social network sites within a relatively short time from their establishment. All of their ranks are recorded with high numbers of visitors, indicating they are suitable as the targets of this study. Each company is distinctive in several ways. Company C is an information-oriented service while the others concentrate on the interactive experience of their users. Company B focuses on young students as its target users. Company A provides the greatest depth of knowledge among the four, and company D undertook a major strategic change to charge frequent users a membership fee during the period of data collection. Several important measures available on Google Analytics were discussed with experienced practitioners to be identified for data collection.
Statistical techniques were applied to study the data, including descriptive, compound daily growth rate, correlation, daily change, and multiple regressions. Descriptive statistics present good references for other SNSs for purposes of comparison. In addition, the differences between member and non-member users for one of the companies provide clear indications that member and non-member users behave differently and require differentiated attention from the management. The distributions of the users’ ages for the four companies comply with their strategies and common online user profiles. Next, the compound daily growth rate analysis reveals the varied patterns of their visitors. The CDGR curves of member and non-member users for company D indicate a similar pattern between them with a time lag. Further study is suggested to clarify this issue.
Pearson correlations among the measures across the cases show that company C is exclusive in that that many of its correlation coefficients have signs that are opposite from those of the other companies. The different business model of company C could explain this finding. The next analysis utilized daily changes in visits, and a “holiday syndrome” was discovered and named. This finding can assist management in positioning its advertisements and activities more efficiently. Finally, a multiple regression analysis was undertaken. Initial results for company D successfully separate its users’ behavior before and
after its policy implementation of charging heavy users. Regression analysis results not only show the differences among the four companies, but also reveal the changes in behavior of member and non-member users in light of the new policy. Web services planning to collect subscription fees from their users can learn from this experience and benefit from this finding.
Several future research directions are suggested. First, Google Analytics data collected from more web services will enhance and validate the results of this study. Second, online interactions among members, among non-members, and between members and non-members remain unclear. The curves of member and non-member on Figure 2 suggest that further study is needed. Third, social relationship between users and social influence among users are important factors for the development of online social networks. Finally, several findings indicate that the business model of company C is different from those of the other three companies. Data from more companies are required to validate these results.
5 Acknowledgement
The author gratefully acknowledges the support of the National Science Council (Grant 99-2410-H-004-150).
References
Armstrong, A., & Hagel III, J. (1995). Real profits from virtual communities. The Mckinsey Quarterly, 3, 126-141.
Bakshy, E., Karrer, B., & Adamic, L.A., 2009, Social influence and the diffusion of user-created content, Proceedings 7th ACM Conference on Electronic Commerce, Stanford, CA, USA, July 6-10.
Bannan, K. J. (2008). RADirect uses Web analytics to improve online video success. B to B, 93, 14.
Betty, P. (2008). Creation, management, and assessment of library screencasts: The Regis libraries animated tutorials project. Journal of Library Administration, 48, 295-315.
Braender, L. M., Kapp, C. M., & Years, J. (2009). Using Web technology to teach students about their digital world. Journal of Information Systems Education, 20, 145-153.
Cardon, P.W., Marshall, B., Norris, D. T., Collier, C., Goreva, V., Nillson, S., North, M., Svensson, L., Valenzuala, J. P., Whelan, C. (2009). Online and offline social ties of social network website users: An exploratory study in eleven societies, Journal of Computer Information Systems, 50, 54-64.
Cha, M/. Mislove, A., & Gummadi, K.P., 2009, A measurement-driven analysis of information propagation in the Flickr social network, Proceedings of the 18th international conference on World Wide Web, Madrid, Spain, April 20-24.
Chafkin, M. (2006). Analyze this, says Google. Inc., 28, 30.
Dearstyne, B. W. (2007). Blogs, Mashups, & Wikis: Oh, My! Information Management Journal, 41, 25-33.
Gilbert, E., Karahalios, K., & Sandvig, C. (2008). The Network in the Garden: An empirical analysis of social media in rural life. Proceedings of ACM CHI 2008 Conference on Human Factors in Computing Systems, Florence, Italy, April 5-10. Google, (2009). Google Analytics [computer software], http://www.google.com/analytics, accessed on 10/10/2009.
Google, (2011). Google Analytics Dimensions & Metrics Reference. http://code.google.com/intl/zh-TW/apis/analytics/docs/gdata/dimsmets/dimsmets.html#cats=trafficsources,session,adwords,goalconversions,system,geone twork,pagetracking,internalsearch,eventtracking,ecommerce,customvars,time, accessed on 11/27/2011.
Hair, J. F., Black, W. C., Babin, B. J., & Anderson, R. E. (2009). Multivariate Data Analysis, 7th ed., Upper Saddle River, N.J.: Pearson Education Inc.
Kıcıman, E., & Livshits, B. (2007). AjaxScope: A platform for remotely monitoring the client-side behavior of web 2.0 applications. ACM SIGOPS Operating Systems Review, 41, 17-30.
Leskovec, J., Adamic, L.A., & Huberman, B.A., (2006). The dynamic of viral marketing, Proceedings 7th ACM Conference on Electronic Commerce (EC-2006), Ann Arbor, MI, USA, June 11-15.
Mislove, A., Marcon, M., Gummadi, K.P., Druschel, P., & Bhattacharjee, B. (2007). Measurement and analysis of online social networks, Proceedings of the 5th ACM/USENIX Internet Measurement Conference, San Diego, CA, USA, October 24-26. O'Reilly, T. (2005). W h a t i s W e b 2 . 0 . http://www.oreillynet.com/pub/a/oreilly/tim/news/2005/09/30/what-is-web-20.html,
accessed on 11/24/2008.
Plaza, B. (2009). Monitoring web traffic source effectiveness with Google Analytics: An experiment with time series", Aslib Proceedings, 61, 474 – 482.
Viswanath, V., Mislove, A., Cha, M., & Gummadi, K. P. (2009). On the evolution of user interaction in Facebook, Proceedings of the 2nd ACM SIGCOMM Workshop on Social Networks, Barcelona, Spain, August 17.
Zhang, Y., Gao, W., Cao, G., La Porta, T., Krishnamachari, B., & Iyengar, A. (2009). Social-Aware data diffusion in delay tolerant MANETs, Proceedings of the 10th ACM International Symposium on Mobile Ad Hoc Networking and Computing, New Orleans, Louisiana, USA, May 18-21.
An Exploratory Study of the Users’ Behavior on Social Network Sites
Shwu-Min Horng
Department of Business Administration National Chengchi University
Taipei City, Taiwan (R.O.C.) e-mail: [email protected]/tw
Abstract—This study makes use of Google Analytics data from four social network sites under web 2.0 setting to analyze their users’ behavior. Several statistical techniques are used to analyze the data based on the measures across the four companies with seven cases. Some interesting findings indicate that certain patterns emerge according to the characteristics of the web services. Managerial implications are discussed along with suggestions for future research.
Keywords- Social Network Site; Google Analytics; Statistical Analysis.
I. INTRODUCTION
The term “Web 2.0” was first documented at a seriesof conferences [1], and its impact on the Internet has been studied widely. Many Web 2.0 collaborative tools were mentioned and three of them are particularly important, that is, Blogs, Mashups, and Wikis [2]. These tools have profoundly changed the development of internet-based social network sites (referred to as SNS throughout the remainder of the article).
Because the content of any SNS is generated by users, their behaviors are critical to the success of the sites. A study analyzed the data collected from online social networks [3]. Propagation of online social networks is another important research topic. A stochastic model was developed to explain the propagation of recommendations and cascade size [4].
Many tools are available to measure website use, and three popular Web analytics software are Google Analytics, ClickTracks, and Coremetrics [5]. Google Analytics is the only one providing free of charge, and its application in practice has been reported [6].
Because the content of any SNS is generated by users, their behaviors are critical to the success of the sites. Working with four Web 2.0 companies, this study analyzes their Google Analytics data and aims at the following objectives. First, study the relations among them through several statistical techniques. Second, discover the commonality and differences across the four companies.
A. Case Companies and Google Analytics Measures The companies in this study are represented as A, B, C, and D with data recorded for 989, 328, 615, and 480 days during the period from years 2006 to 2009, respectively. Company A provides a place to collect articles according to topic. Company B offers a free platform for student users, especially campus clubs, to interact on the site. Company C mainly focuses on restaurant information. Company D combines maps and blogs so that users can post their articles on the location indicating where they live.
Many measures are available on Google Analytics for retrieval. After discussion with several founders of SNSs, several important variables were identified including Bounce Rate (BR, the percentage of single-page visits or visits in which a person leaves your site from the entrance page), Percent of New Visits (%NV, The number of new visits by people who have never been to the site before divided by the number of visits), Average Time on Page (ATOP, Average time on page. Total time on site for all visits divided by the number of pages excluding the first pages visited), Average Time on Site (ATOS, Average time on site. Total time on site for all visits divided by the total number of visits), and Visits (The number of times your visitors has been to your site (unique sessions initiated by all your visitors).
A. CDGR Analysis
The compound daily growth rate (CDGR) that measures the daily compound increase rate of visits from the first date to the last date of record. To have a better understanding of their visit changes over time, the CDGR measures for each case (data for company D are divided into two parts, one for members and the other one for non-members) are calculated starting from day 100 up to the final days of each case. That is, the CDGR at day 100 is the visits at day 100 against day1; CDGR at day 101 is the visits at day 101 against day2; and so on. The equation for calculating the CDGR is as follows: (Total visits at dayt)(1+CDGR)100=(Total visits at dayt+100)
Figure 1. Results of the continuous Compound Daily Growth Rate (CDGR) for the six cases. The X-axis does not indicate the same date for
the cases, except the bottom three charts from the same company, and it simply represents the first recorded day of CDGR.
Fig. 1 show the results of the continuous CDGR for the six cases. It is clear that company A draws a significant amount of attention at the early stage, but the pattern shows that the curve has a negative slope in the long run. From the longitudinal observation, Company B undertook several large-scale promotional campaigns and they are revealed by the up-and-down shape of the curve. In terms of stability, company C has the best performance with very few fluctuations. In addition, a large portion of the curve remains above zero, indicating the steady increase of its users. Although company D records the largest number of visits and registered members among the four companies, its curve shows that the number of its visitors fluctuates moderately in which the curves of members and non-members reveal an interesting pattern. A gap of approximately 50 days appears between the two curves. Do member users follow the behavior of non-member users, or vice versa? What causes the time lag? These questions remain unanswered pending further investigation. To detect abnormal data, Multiple regression models with a 50 days of moving window is also used and results show that each case behaved differently with certain patterns emerged.
B. Time Series Plots for %NV
%NV is an indicator of how the site attracts new users, and is expected to decline over time, since the base of new users is shrinking. Fig. 2 shows the %NV of companies A, B, C, and D over recorded days. As predicted, they all decrease as the longer they stay in business. In general, company B is in a desperate position with its low %NV. The curves of companies A, C, and D stabilize at approximately 50%. This can be used as an indicator of a stabilized SNS. Companies A, B, and D seem to experience a major drop before climbing to a higher %NV. Is this an unavoidable obstacle any interaction-oriented SNS is forced to experience and overcome, or simply a coincidence among the companies selected in this study? Further research can focus on this topic and provide a better understanding of user behavior on SNSs.
Figure 2. %NV plots against recorded days for case A, B, C, and D, respectively.
II. CONCLUSIONS
This study analyzes the Google Analytics data from multiple web services. Statistical techniques were applied to study the data, and the results show some interesting findings. Further study is suggested to provide a better understanding for the users’ behavior on SNS.
ACKNOWLEDGMENT
The author gratefully acknowledges the support of the National Science Council (Grant 99-2410-H-004-150).
REFERENCES
[1] T. O'Reilly, W h a t i s W e b 2 . 0 , 2005, http://www.oreillynet.com/pub/a/oreilly/tim/news/2005/09/30/what-is-web-20.html, accessed on 11/24/2008.
[ 2 ] B. W. Dearstyne, “Blogs, Mashups, & Wikis: Oh, My!,” Information Management Journal, vol. 41, Jul./Aug. 2007, pp. 25-33.
[3] V., Viswanath, A., Mislove, M., Cha, & K.P., Gummadi, “On the evolution of user interaction in Facebook”, Proceedings of the 2nd ACM SIGCOMM Workshop on Social Networks, Barcelona, Spain, August 17, 2009.
[4] J., Leskovec, L.A., Adamic, & B.A. Huberman, “The dynamic of viral marketing”, Proceedings 7th ACM Conference on Electronic Commerce (EC-2006), Ann Arbor, MI, USA, June 11-15, 2006. [5] M. Chafkin, “ Analyze this, says Google,” Inc., vol. 28, Apr. 2006,
pp. 30-30.
[6] L. M. Braender, C. M. Kapp, & J. Years, “Using Web technology to teach students about their digital world,” Journal of Information Systems Education, vol. 20, Summer 2009, pp. 145-153.
-0.02 0 0.02 0 200 400 600 800 A -0.02 0 0.02 0 200 400 600 800 B -0.02 0 0.02 0 200 400 600 800 C -0.02 0 0.02 0 200 400 600 800 D -0.02 0 0.02 0 200 400 600 800 D-M D-Non 0.1 0.2 0.3 0.4 0.5 0.6 0.7 0.8 0 200 400 600 800 1000 A B C D