投資人過度自信與風險承擔 - 政大學術集成
62
0
0
全文
(2) CONTENTS List of Tables ................................................................................................................ii Abstract ........................................................................................................................ iv 1.. Introduction.................................................................................................... 1. 2.. Literature Review .......................................................................................... 3. 3.. Data Description and Research Methodology ............................................. 8 3.1 The trading mechanism of the Taiwan Futures Exchange............................................... 8 3.2 Data Description ............................................................................................................ 10. 政 治 大. 3.3 Hypotheses ................................................................................................................... 11. 立. Methodology ................................................................................................. 12. 5.. Empirical Results ......................................................................................... 14. ‧ 國. 學. 4.. 5.1 Descriptive Statistics of Samples .................................................................................. 14. ‧. 5.2 Empirical Result of the Variation of Risk Taking ......................................................... 16. y. Nat. sit. 5.2.1 The Variation of Risk Taking for Overconfident Investors.................................... 16. er. io. 5.2.2 The Variation of Risk Taking for Non-overconfidence Investors .......................... 17. al. n. v i n Ch Non-overconfident Investors ........................................................................................... 18 engchi U 5.2.3 The Variation of Risk Taking Difference between Overconfident and. 6.. Conclusion .................................................................................................... 20. References ................................................................................................................... 56. i.
(3) List of Tables Table 1: Sample characteristics. .................................................................................. 22 Table 2: Sample characteristics. .................................................................................. 24 Table 3: The variation of risk taking for overconfident investors tests in number of trades. .......................................................................................................... 26 Table 4: The variation of risk taking for overconfident investors tests in trade size. .. 28 Table 5: The variation of risk taking for overconfident investors tests in number of orders. .......................................................................................................... 30. 政 治 大 Table 7: The variation of risk taking for overconfident investors tests in trade to order 立 ratio. ............................................................................................................. 34 Table 6: The variation of risk taking for overconfident investors tests in order size. . 32. ‧ 國. 學. Table 8: The variation of risk taking for non-overconfident investors tests in number of trades. ...................................................................................................... 36. ‧. Table 9: The variation of risk taking for non-overconfident investors tests in trade size.. sit. y. Nat. ..................................................................................................................... 38. er. io. Table 10: The variation of risk taking for non-overconfident investors tests in number of orders. ...................................................................................................... 40. al. n. v i n C h for non-overconfident Table 11: The variation of risk taking investors tests in order U i e h n gc size. .............................................................................................................. 42 Table 12: The variation of risk taking for non-overconfident investors tests in trade to. order ratio. ................................................................................................... 44 Table 13: The variation of risk taking difference between overconfident and non-overconfident investors tests in number of trades. ............................... 46 Table 14: The variation of risk taking difference between overconfident and non-overconfident investors tests in trade size............................................ 48 Table 15: The variation of risk taking difference between overconfident and non-overconfident investors tests in number of orders. .............................. 50. ii.
(4) Table 16: The variation of risk taking difference between overconfident and non-overconfident investors tests in order size. .......................................... 52 Table 17: The variation of risk taking difference between overconfident and non-overconfident investors tests in trade to order ratio. ............................ 54. 立. 政 治 大. ‧. ‧ 國. 學. n. er. io. sit. y. Nat. al. Ch. engchi. iii. i n U. v.
(5) Abstract Using a dataset record account-level trades and orders from Taiwan Futures Exchange, we examine whether the variations of risk taking follows the overconfidence bias for four types of traders, including individuals, foreign institutions, domestic institutions, and foreign institutional traders. Our findings show that when investors are individuals and domestic institutions, the variations of trading activities for overconfident investors are greater than others. However, the results are not. 政 治 大 demonstrate that investors 立 take more risk following overconfidence.. significant for foreign institutions and foreign institutional traders. Therefore, we. ‧. ‧ 國. 學. n. er. io. sit. y. Nat. al. Ch. engchi. iv. i n U. v.
(6) 1. Introduction The issue of excess trading volume has been argued for a long time. De Bondt and Thaler (1995) provide that overconfidence plays an important role in solving this problem. Recently, the evidence of overconfidence hypothesis has been presented in the previous literature, for example, Gervais and Odean (2001) find that overconfident investors tend to trade more after prior gains due to overestimating information from their prior outcome. In this paper, we consider about whether the behavioral bias follows overconfidence hypothesis. In the prior literatures, they discuss the. 政 治 大 them classify investors according 立 to psychological assessment, such as, gender and. relationship between overconfidence effect and trading volume. However, most of. ‧ 國. 學. experience. In this paper, we use the behavior of investors’ trading to examine whether the variation of risk-taking is following overconfidence effect. In the other. ‧. words, the behavior difference between overconfident and non-overconfident. sit. y. Nat. investors is that overconfidence lead investors to have a tendency to place more. n. al. er. io. orders and execute more trades than before. We follow Chou and Wang (2011). i n U. v. overconfidence hypothesis to separate investors. Overconfident investor is defined. Ch. engchi. that investor in definition period has a net long (short) position, trades gains from that position, and has a net buy (sell) volume in subsequent period. Non-overconfident investors are defined as investors do not be categorized in overconfident ones. Based on the specification account-level data and the detail information from the Taiwan Futures Exchange (TAIFEX), we examine whether risk-taking variation is related to overconfidence bias. The variation of risk-taking is defined as the difference in the risk taking between the risk taking testing period and prior period. Besides, in this paper, we use several proxies as the risk taking. We follow the proxies in Coval and Shumway (2005), and Liu et al. (2010) to explain the risk-taking of investors: the 1.
(7) number of trades, the number of order, trade size, order size, and the ratio of the number of trades to the number of order. Moreover, due to the specification account-level data, we classify investors into four difference type: individual traders, domestic institutional traders, futures proprietary firms and foreign institutional traders. Therefore, we also examine whether the trader types of investors will affect the relationship between overconfidence and behavioral bias. The rest of this paper is organized as follows. Chapter 2 describes the relevant literature. Chapter 3 describes the trading mechanism of the Taiwan Futures Exchange,. 政 治 大 analyses are presented in Chapter 5. Finally, Chapter 6 concludes the paper. 立. data, and hypotheses. Chapter 4 describes the research methodology. The empirical. ‧. ‧ 國. 學. n. er. io. sit. y. Nat. al. Ch. engchi. 2. i n U. v.
(8) 2. Literature Review We review the relevant literature regarding the relationship between trading activity and prior returns in this chapter. Gervais and Odean (2001) examine the relationship between past returns and trading volume, thus, they develop a multiperiod market model describing both the process by which traders learn about their ability. In the paper, they assume a trader initially does not know his own ability, and he infers this ability from his successes and failures. They fine that trading volume is greater after market gains and lower after market losses. Moreover, the. 政 治 大 Statman et al. (2006) examine 立 whether the trading volume could predict formal. degree of overconfidence is greater after market gains and lower after market losses.. ‧ 國. 學. overconfidence models and the market-wide and the positive relationship between individual security turnover and lagged returns for many months. Using monthly. ‧. observations on all NYSE/AMEX common stocks, excluding closed-end funds,. sit. y. Nat. REITs, and ADRs, from August 1962 to December 2002, the span of the daily CRSP. n. al. er. io. files, they find that both market-wide and individual security turnover are responsive. i n U. v. to past market returns, and overconfidence effect that market returns is positively. Ch. engchi. related to volume is more pronounced in small-cap stocks and in earlier periods where individual investors hold a greater proportion of shares. Kim and Nofsinger (2007) test this hypothesis using Japanese market level data. They identify stocks with varying degrees of individual ownership and find higher monthly turnover in stocks hold by individual investors during the bubble market in Japan. Griffin et al. (2007) investigate the dynamic relationship between market-wide trading activity and returns in 46 markets. They find that in most of developed countries and developing countries market turnover is positively related to past returns and the relationship for individual investors is much stronger than for 3.
(9) institutional investors. Moreover, the relation is stronger for developing countries than developed ones; the result shows that turnover is more sensitive to adverse return shocks in markets with short-sale restrictions and high levels of corruption. Odean (1999), Barber and Odean (2002) use a dataset from a U.S. discount broker to analyze individuals. Odean (1999) finds that the individual investors reduce their returns through trading; thus, they trade excessively. Their result is consistent with overconfidence hypothesis. Barber and Odean (2002) analyze 1,607 investors who switched from phone-based to online trading during the 1990s. They find that those. 政 治 大 after going online individual investors trade more; however, they reduce their 立. who switch to online trading perform well prior to going online and beat the market,. profitably. Besides, Glaser and Weber (2009) use 3,000 individual investors who have. ‧ 國. 學. discount broker accounts in German over a 51 month period to examine whether prior. ‧. market or portfolio returns are following subsequent stock trading volume, and other. sit. y. Nat. trading activities. They find that past market returns and past portfolio returns affect. io. er. trading activity of individual investors, such as the stock portfolio turnover, the number of stock transactions, and having a tendency to trade stocks in a given month.. al. n. v i n C hthat individual investors Moreover, their results also show will buy high risk stocks engchi U. and reduce the number of stocks in their portfolio after experiencing high portfolio. returns. However, high past market returns do not have the same effect as high portfolio returns; individual investors do not increase their risk taking or underdiversification. In addition, the results approve overconfidence is based on self-attribution and the explanation variable in trading activity. O’Connell and Teo (2009) using data on mutual fund managers’ trading decisions test the effects of trading gains and losses on risk-taking among large institutional investors. Their results show that large institutions take on more risk following gains in both long position and short position gains. 4.
(10) While a dataset in Taiwan Futures Exchange, Liu et al. (2010) find that the three different types of market makers the relationship between prior outcomes and subsequent risk taking is positive. Chou and Wang (2011) examine overconfidence biases by directly testing the signed trading volume and order aggressiveness of traders following trading gains from their prior positions in different trader types foreign institutions, domestic institutions, futures proprietary firms, and individual traders. They find that investors tend to buy (sell) more after they have previously hold a long (short) position and gains; moreover, the overconfidence biases in. 政 治 大 Barberis and Xiong (2009) use a two-period model to study the trading behavior 立. individual traders are the strongest in all trader types.. of an investor who derives utility from realized gains and losses with a utility function. ‧ 國. 學. that is concave over gains and convex over losses. They find that investors may tend. ‧. to increase their risk taking after prior gains.. sit. y. Nat. There are other researches that focus on whether overconfidence bias affects the. io. er. trading activities. There are a lot of researches find that the more overconfidence bias , the more trading activities, such as, Odean (1998), Barber and Odean (2001),. al. n. v i n C h and Tate (2005), Malmendier e n g c h i U Menkhoff. Campbell et al. (2004),. et al. (2006),. Grinblatt and Keloharju (2009), and Li and Tang (2010). Odean (1998) develops models to test whether overconfidence investors overestimate their knowledge, and overestimate their ability to interpret publicly information. They find that overconfidence is positive related to trade volume, but negative related to expected utility of overconfidence investors. Barber and Odean (2001) test whether gender is a proxy for overconfidence and their data set which consist of 35,000 households from a large discount brokerage house. They find that men trade more than women; moreover, their result is consistent 5.
(11) with overconfidence models that gender is a substantial number of other attributes that might affect trading. Campbell et al. (2004) examine the relationship between narcissists and overconfident, and the relationship between overconfident and decision making. They find that narcissism is positive related to overconfidence. Besides, the willing to accept risk is following increasing confidence though the value of bets is decline. Menkhoff et al. (2006) examine the impact of experience on overconfidence and risk taking of 117 German fund managers. They find that the returns of inexperienced. 政 治 大 able to explain the relation between experience and overconfidence and risk taking. 立. fund managers are greater than of experienced ones. However, their results are not. Although the results are signification positive, they might be based on the importance. ‧ 國. 學. of learning.. ‧. Grinblatt and Keloharju (2009) use equity trading data from Finland to examine. sit. y. Nat. that two psychological attributes, sensation seeking and overconfidence, are related to. io. er. the tendency of investors to trade stocks. After controlling a number of variables that might explain trading activity, such as wealth, income, age, number of stocks owned,. al. n. v i n Cusing marital status, and occupation by regressions, they find that both h e cross-sectional ngchi U overconfident investors as well as those investors who are prone to sensation seeking trade more frequently. Using a sample of firms, Malmendier and Tate (2005), and Li and Tang (2010) find that overconfident CEOs will increase companies’ and themselves risk taking. Malmendier and Tate (2005) use a dataset consist of 477 large publicly listed on Forbes 500 and traded U.S. firms from the years 1980 to 1994. They examine the relationship between managerial overconfidence and corporate investment decisions. They define that CEOs are overconfident if they do not reduce their personal portfolio exposure to company-specific risk. Their results show that the sensitivity of 6.
(12) investment to overconfident CEOs is significantly positive related to cash flow, especially for firms have abundant internal funds. Li and Tang (2010) use a dataset from 2,790 CEOs of diverse manufacturing firms in China to examine whether CEO hubris lead to firm risk taking. Their results show that the relationship between CEO hubris and firm risk taking is significantly positive. There are other studies that regarding the relationship between prior outcomes and subsequent risk taking. Barberis and Xiong (2009) examine whether subsequent investment decisions is related to prior trading outcomes. They find that when. 政 治 大 investors may tend to increase their risk taking after prior gains. 立. preferences are defined as realized gains and losses not annual gains and losses,. Liu et al. (2010) use a dataset from Taiwan Futures Exchange to examine whether. ‧ 國. 學. the risk-taking in the afternoon is related to morning profitably. They find that market. ‧. maker take above-average risks in afternoon trading after morning gains. Their results. sit. y. Nat. are consistent with the controversy that prior outcomes affect subsequent risk taking. io. er. through a relationship that is sensitive to the model parameters.. While investors are professional traders, Coval and Shumway (2005), and Locke. al. n. v i n C h professional traders and Mann (2005) examine whether are able to avoid irrational engchi U behaviors.. Coval and Shumway (2005) find that widespread losses in the morning. lead to increases in short-run afternoon volatility but no increase in volatility measured over longer intervals. Their result is consistent with the argument that any price impact resulting from traders' behavioral biases dissipates extremely quickly. However, Locke and Mann (2005) do not find any evidence to support that professional traders hold onto losses significantly longer than gains, but little relationship between risk taking and prior trading results for average option traders, and they conclude that professional traders tend to take on less risk after prior losses.. 7.
(13) 3. Data Description and Research Methodology In this chapter, we describe the trading mechanism of the Taiwan Futures Exchange, data, and hypotheses. Section 3.1 describes the Taiwan Futures Exchange that our data trade. In section 3.2, we present the detail information about our dataset to test overconfidence effect and the variation of risk taking. In the last section of the chapter, we propose the hypotheses with regard to the all topics we have mentioned above.. 政 治 大 The TAIFEX is an order-driven 立 electronic futures market in which there are no. 3.1 The trading mechanism of the Taiwan Futures Exchange. ‧ 國. 學. designated market makers; therefore, futures prices are determined by the limit and market orders submitted by traders. These orders are executed under a price and time. ‧. priority system. The TAIFEX was operated under an automated (10 seconds). sit. y. Nat. batch-call system before July 29, 2002, but it was transformed to a continuous auction. n. al. er. io. system thereafter. The price limits on the TAIFEX are ±7% of the previous day’s. i n U. v. close. On the TAIFEX, trading is conducted from 8:45 a.m. to 1:45 p.m., Monday. Ch. engchi. through Friday (excluding public holidays). The contract on the final settlement day is traded from 8:45 a.m. to 1:30 p.m. Delivery months include the current month, the next two calendar months, and the two months after the March quarterly cycle (March, June, September, and December). The last trading day and the expiration day are the third Wednesday and Thursday, respectively, of each month. The final settlement price for each contract is computed as the volume-weighted average of each index component stock price in the last 30 minutes of trading on the final settlement day. All contracts are settled with cash, and in-the-money options are exercised automatically upon expiration. The unsettled positions of individual traders, 8.
(14) institutions, and futures proprietary firms on TAIEX index futures are restricted by the TAIFEX to 6,000, 12,000, and 36,000 contracts, respectively, while institutions are able to apply for an exemption from the above limit on trading accounts for hedging purpose (for more details, please see www.taifex.com.tw).. 立. 政 治 大. ‧. ‧ 國. 學. n. er. io. sit. y. Nat. al. Ch. engchi. 9. i n U. v.
(15) 3.2 Data Description We obtain complete order and trading data for all Taiwan Capitalization Weighted Stock Index (TAIEX) futures contracts traded on the TAIFEX between January 2004 and December 2008. The TAIFEX is a value-weighted index of all listed common stocks traded on the Taiwan Stock Exchange (TSE). The trading units of the TAIEX futures are the index value of the TAIEX × 200 New Taiwan Dollars (NT$). Due to the liquidity, we use the nearby contracts in our analysis.. 1. Our dataset consist of detail information about transactions and orders. The order. 政 治 大 delivery month, the quantity, the price, order types (limit or market order), and most 立 data include the date and time of arrival of the order, its direction (buy or sell), the. importantly, the account identification and type of trader that we are able to separately. ‧ 國. 學. examine the different trading activities for different types of trades. The transaction. ‧. data include the date and time of the transaction, its direction (buy or sell), the. sit. y. Nat. delivery month, the quantity, transaction price and the identity of the traders.. io. er. Traders are classified into the following four types: individual traders, domestic institutional traders, futures proprietary firms and foreign institutional traders.. al. n. v i n tradersCcontain government-owned hengchi U. Domestic institutional. firms and domestic. corporations. A net long (short) position is defined as an investor cumulative buy volume during a sample holding period is larger (smaller) than his cumulative sell volume.. 1. We select the most nearby contract, and each contract was chosen the day from the prior contract delivered day to the day before the contract delivered. 10.
(16) 3.3 Hypotheses Overconfidence hypothesis has been proved in several studies (Barberis et al., 1998; Daniel et al., 1998; Gervais and Odean, 2001; Statman et al., 2006; Glaser and Weber, 2009; O’Connell and Teo, 2009). In the paper, we try to examine the relationship between overconfidence effect and risk-taking variation. Besides, our dataset combine with the unique account-level data; thus, we enable to examine whether each type of traders exhibit the relationship. However, most of literatures classify investors through psychological assessment. In this paper, we use the. 政 治 大 overconfidence bias for different types of traders. We follow Chou and Wang (2011) 立. behavior of investors’ trading to examine whether risk-taking variation following. overconfidence hypothesis to separate investors. Their overconfidence hypothesis is. ‧ 國. 學. defined as if investors have previously hold a long (short) position, then trading gains. ‧. from that would induce them to buy (sell) more in the subsequent period.. sit. y. Nat. Following previous research our hypothesis is summarized as follows:. io. er. 1. The Variation of Risk-Taking Hypothesis:. H0: The variations of risk-taking for overconfident investors are greater than. n. al. non-overconfident ones.. Ch. engchi. 11. i n U. v.
(17) 4. Methodology In order to examine whether the variation of risk-taking for overconfident investors are greater than non-overconfident ones, first, we choose 5-, 10-, and 25-day holding period as definition period to look back on its trading history. Second, a net long (short) position is defined as an investor cumulative buy volume during a sample holding period is larger (smaller) than his cumulative sell volume. Third, we measure the returns for each buy (sell) transaction as the log (negative log) difference between the price at the end of the definition holding period and the transaction price. Forth,. 政 治 大 transaction returns during 立 the definition holding period. Therefore, we define gain. the returns of net long and net short position are calculated by averaging all of the. ‧ 國. 學. (loss) positions as the definition holding period returns are positive (negative). Fifth, we define a net buy (sell) volume in the subsequent period, when an investor’s. ‧. cumulative buy volume during a subsequent holding period is larger (smaller) than his. sit. y. Nat. cumulative sell volume. Sixth, we follow Chou and Wang (2011) overconfidence. n. al. er. io. hypothesis to separate investors. Therefore, we define overconfident investors as the. i n U. v. investors that hold a net long (short) position in the definition holding period, trade. Ch. engchi. gains from the position, and then have a net buy (sell) volume in the subsequent holding period. Thus, non-overconfident investors are defined as investors do not be categorized in overconfident investors. Seventh, we choose 20-, 60-, and 90-day holding period as risk taking testing period. We look back through its trading history for the previous risk taking testing period before the definition period and the risk taking testing period before the definition period. Eighth, as measuring the trading risk taking, we follow the proxies in Coval and Shumway (2005), and Liu et al (2010). Coval and Shumway (2005) use the number of trades, trade size, and total dollar risk. Liu et al. (2010) use the number of orders, the number of trades, order size, and trade 12.
(18) size to reflect how actively behavior in investor trading, however, those proxies are noisy for risk taking. Therefore, they also use the ratio of the number of trades to the number of orders to reflect each investor’s willingness to trade. In the paper, the risk taking proxies are used: the number of orders, the number of trades, order size, trade sizes, and the ratio of the number of trades to the number of orders. Ninth, the variation of cumulative proxy is defined as the difference in the cumulative proxy between the risk taking testing period after the definition period and the risk taking testing period before the definition period. We define risk-taking variation is positive. 政 治 大 testing period. Tenth, we examine the variation of cumulative proxy when investors 立. if the risk-taking proxy in the subsequent testing period is large than in the prior. are overconfident and non-overconfident by t-statistic test for all traders and the four. ‧ 國. 學. trader types. Eleventh, we compare the cumulative risk-taking variations difference. ‧. between overconfident and non-overconfident investors by t-statistic test for all. y. n. al. Cumulative Risk Taking Proxies in 20, 60, 90-day. Ch. engchi Difference. 13. sit. io. Defining Overconfident and Non-overconfident. er. Nat. traders and the four trader types.. i n U. v. Cumulative Risk Taking Proxies in 20, 60, 90-day.
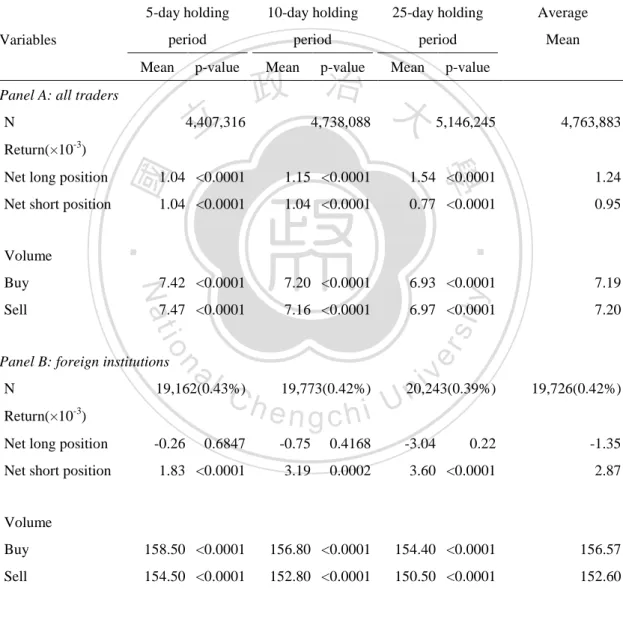
(19) 5. Empirical Results The chapter provides empirical results according to the methodology presented in the previous chapter. Section 5.1 presents descriptive statistics of all samples according different account-level and different holding period. In section 5.2, we provide the empirical results of the variation of risk-taking.. 5.1 Descriptive Statistics of Samples Table 1 reports the descriptive statistics of the holding period returns for net long. 政 治 大 holding periods include 5-,立 10-, 25-day. Panel A presents all traders, and Panels B–E. and short position, and daily trading volume by the different types of traders. The. ‧ 國. 學. present the statistics for foreign institutions, domestic institutions, futures proprietary firms and individual traders, respectively. The number of observations refers to each. ‧. sample account-days. The Returns are defined as the net long and net short positions’. sit. y. Nat. return in the 5-day (10-day, and 25-day) holding period.. n. al. er. io. As we can see from Panel A, the net long- and net short position’s returns are. i n U. v. significant higher than zero. In Panel B-E of Table 1, we can see that individual. Ch. engchi. traders execute of the largest (average percentage=98.78%) percentage of average sample account-days. Domestic institutions and foreign institutions are rank second (average percentage=0.78%) and third (average percentage=0.41%), respectively. Futures proprietary firms rank least (average percentage=0.03%) in terms of the number of account-day. However, such firms trade the largest amount of contracts (average buy=7,534.57 average sell=7,443.70) in average daily trading volume, individuals trade the smallest amount (average buy=4.4 average sell=4.5). Therefore, it should be mention that futures proprietary firms are different from futures broker in that they trade futures for their own accounts. In other words, they trade on their own 14.
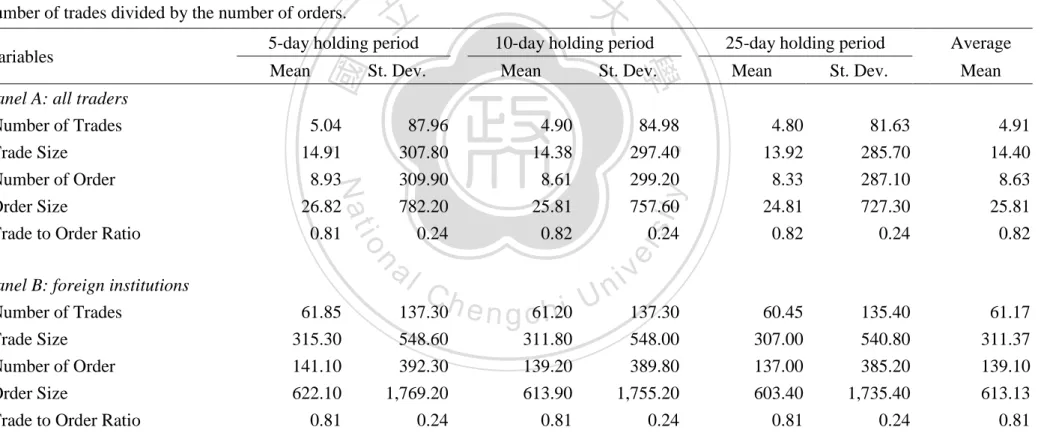
(20) accounts to make profits instead of earning commissions. Table 2 presents the summary statistics of the five different risk-taking measures. Number of trades and orders are the number of all index futures trades/orders that each investor executes during the respective time period. Trade size is the average daily transacts contracts. Order size is the average daily orders contracts. Trade to order ratio is the average ratio of number of trades to number of orders, defined as the number of trades divided by the number of orders. For all of the risk-taking measures except trade to order ratio, futures proprietary firms trade the largest (average number. 政 治 大 average order size=32,315.50), while individuals trade the smallest (average number 立. of trades=3,769.77 average trade size=14,978.30 average number of orders=10,419.83. of trades=3.63 average trade size=8.91 average number of orders=5.25 average order. ‧ 國. 學. size=14.39). Comparing trade to order ratio by trader types, we find that the average. ‧. trade to order ratio for futures proprietary firms are the smallest (0.59), and individual. sit. y. Nat. traders are the largest (0.82). Since trade to order ratio reflect each investor’s. io. n. al. er. willingness to trade, the results are difference with the other proxies.. Ch. engchi. 15. i n U. v.
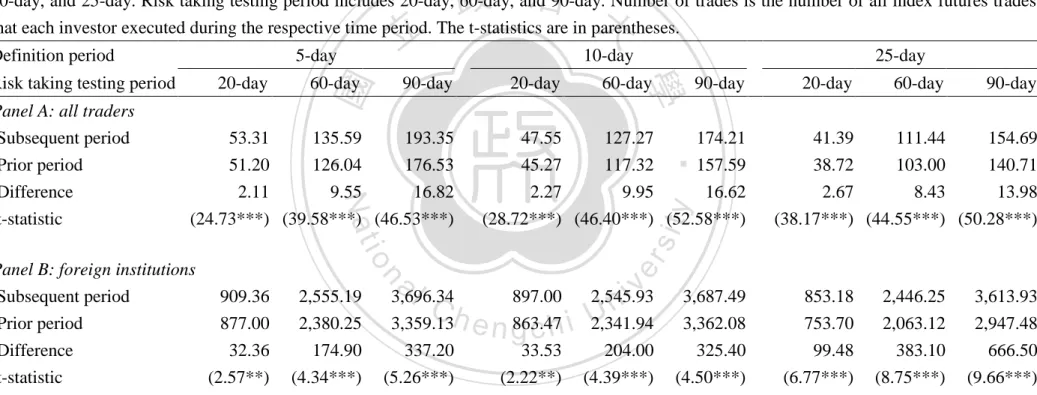
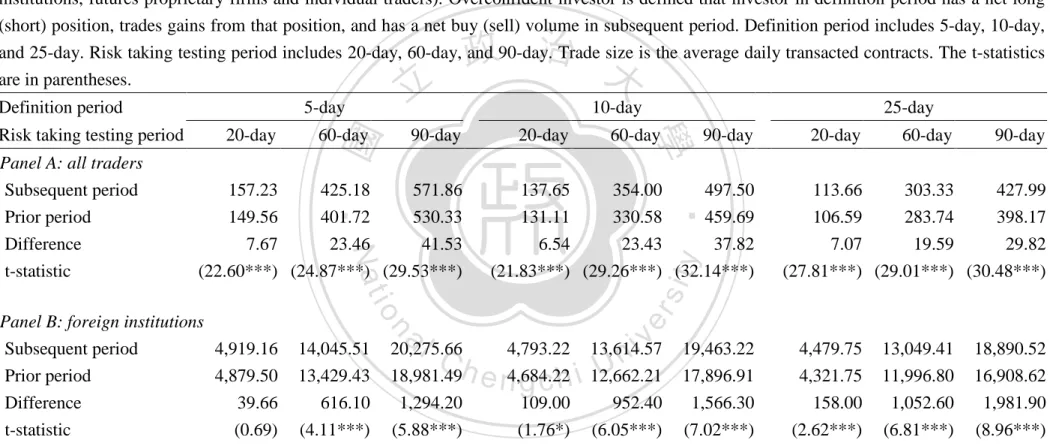
(21) 5.2 Empirical Result of the Variation of Risk Taking 5.2.1 The Variation of Risk Taking for Overconfident Investors We present the results that the difference in risk taking between prior and subsequent holding period for overconfident investors in all traders and different types of traders. Overconfident investors are defined as the investors that hold a net long (short) position in the definition period, trade gains from the position, and then have a net buy (sell) volume in the subsequent period. We test the hypothesis from Table 3 to Table 7 using following risk taking proxies: the number of trades, trade. 政 治 大 number of orders. For example, in Panel A of Table 3, overconfident behavior is 立. sizes, the number of orders, order size, and the ratio of the number of trades to the. defined that investors have a net long (short) position, accrue profit in previous 5-day. ‧ 國. 學. definition period, and then tend to hold a net buy (sell) volume in subsequent 5-day. ‧. definition period. Those overconfident investors for all traders execute 2.11 numbers. sit. y. Nat. of trades in the 20-day risk taking testing period after 5-day definition period more. io. er. than in the 20-day risk taking testing period before prior 5-day definition period. Moreover, the results indicate that overconfident investors take more risk than before.. al. n. v i n C t-statistics In Panel A of Table 3, all of the significant at the 1% level; thus, we U h e n g are i h c. find that the risk taking for overconfident investors in later period is more than prior trade for different definition period and for different risk taking testing period.. In Panel B-E of Table 3, we examine the overconfident investors’ risk taking for foreign institutions, domestic institutions, futures proprietary firms and individual traders, respectively. We find that the results for all four types of traders except futures proprietary firms are as significantly as all traders. Table 4 to 5 present the similar results as in Table 3 that overconfidence affects investors to trade more trade size and number of orders than previous period. However, in Table 6 to 7, we find that the results for order size and trade-to-order ratio are only significantly positive by 16.
(22) individuals, less significantly by foreign institutions and domestic institutions. Consequently, from Table 3 to 7, overconfidence investors execute more trades and orders in subsequent than previous period for foreign institutions, domestic institutions, and individual traders. In the other words, they take more risk than before.. 5.2.2 The Variation of Risk Taking for Non-overconfidence Investors The results of empirical analysis of non-overconfidence investors’ risk-taking are. 政 治 大 and subsequent holding period for non-overconfident investors by all traders and 立. presented from Table 8 to 12. We examine the difference in risk taking between prior. different types of traders. We define overconfident investors as the investors that hold. ‧ 國. 學. a net long (short) position in the definition period, trade gains from the position, and. ‧. then have a net buy (sell) volume in the subsequent period. Non-overconfidence. sit. y. Nat. investors are defined as all investors except overconfident ones. The risk taking. io. er. proxies from Table 8 to 12 are used the number of trades, trade sizes, the number of orders, order size, and the ratio of the number of trades to the number of orders,. al. n. v i n C h A of Table 8, overconfident respectively. For example, in Panel behavior is defined engchi U. that investors have a net long (short) position, accrue profit in previous 5-day definition period, and then tend to hold a net buy (sell) volume in subsequent 5-day. definition period. Non-overconfident investors are defined that investors do not conform to the overconfident behavior. Those non-overconfident investors for all traders execute 0.43 numbers of trades in the 20-day risk taking testing period after 5-day definition period more than in the 20-day risk taking testing period before 5-day definition period. This result indicates that non-overconfident investors’ risk-taking is larger than before. In Panel A of Table 8, all of the t-statistics are significant at the 1% level; thus, we find that the risk taking for non-overconfident investors in later period 17.
(23) is more than prior trade for different definition period and for different risk taking testing period. In Table 8 and Table 10, we find that the results are almost statistically significant; thus, overconfidence affects investors to execute more number of trades and number of order than previous period. In Table 9 and Table 11, the results show that the statistics of the risk-taking proxies of trade size and order size are significantly positive for all types of traders except domestic institutions. Moreover, Table 12 presents that as the proxy is trade-to-order ratio, the results do not exist any. 政 治 大 before as they are foreign institutions, futures proprietary firms, and individual traders, 立 consistency. From Table 8 to 12, non-overconfidence investors take more risk than. while the statistics are less significantly for domestic institutions.. ‧ 國. 學 ‧. 5.2.3 The Variation of Risk Taking Difference between Overconfident and. sit. y. Nat. Non-overconfident Investors. io. er. From Table 3 to 12, we could not provide that overconfidence will affect risk taking. Therefore, we examine whether the variation of risk taking difference between. n. al. Ch. overconfident and non-overconfident investors.. engchi. i n U. v. In Table 13 to 17, we provide the results by all traders and four types of traders. For example, in Panel A of Table 13, overconfident behavior is defined that the investors that hold a net long (short) position in the definition period, trade gains from the position, and then have a net buy (sell) volume in the subsequent period. Non-overconfident investors are defined as investors do not be categorized in overconfident ones. Those overconfident investors for all traders execute 1.75 numbers of trades in the 20-day risk taking testing period after 5-day definition period more than in the 20-day risk taking testing period before 5-day definition period. However, the non-overconfident investors execute 0.46 numbers of trades in the 18.
(24) subsequent more than in risk taking testing period. Therefore, overconfident investors have a tendency to take more risk than non-overconfident ones. Moreover, all of the t-statistics in Panel A of Table 13 are significant at the 1% level, the results show that overconfident behavior affects the number of trades for different holding period and for different test holding period. In Panel B-E of Table 13, we find that the relationship between overconfident behavior and the variations in number of trades are significantly positive only when the investors are domestic institutions and individual traders. Moreover, from Table. 政 治 大 the number of orders, order size, and trade-to-orders ratio, respectively. According to 立. 14 to 17, the results are similar to Table 13 as the risk-taking proxies are trade sizes,. our results, traders tend to trade more following overconfidence bias. The finding is. ‧ 國. 學. consistent with our hypothesis overconfident investors take more risk than. ‧. non-overconfident ones.. n. er. io. sit. y. Nat. al. Ch. engchi. 19. i n U. v.
(25) 6. Conclusion The overconfidence hypothesis has been discussed in previous literatures (Barberis et al., 1998; Daniel et al., 1998; Gervais and Odean, 2001; Statman et al., 2006; Glaser and Weber, 2009; O’Connell and Teo, 2009). Gervais and Odean (2001) find that overconfident investors overestimate information from their prior outcome; thus, they have a tendency to trade more after prior gains. In the paper, we use a dataset consist of account-level orders and transactions records from the TAIFEX to examine whether the behavioral bias is related to overconfidence hypothesis. The. 政 治 大 trading volume. Therefore, 立in this paper, we examine whether the variation of. previous literatures have showed the relationship between overconfidence effect and. ‧ 國. 學. risk-taking is following overconfidence effect, and we classify investors through the behavior of investors’ trading history not psychological assessment as prior literatures.. ‧. The variation of risk-taking is defined as the difference in the risk taking between the. sit. y. Nat. risk taking testing period and prior period. We follow Chou and Wang (2011). n. al. er. io. overconfidence hypothesis to separate investors. Therefore, we define overconfident. i n U. v. investor as investor in definition period has a net long (short) position, trades gains. Ch. engchi. from that position, and has a net buy (sell) volume in subsequent period. Non-overconfident investors are defined as investors do not be categorized in overconfident ones. Moreover, we classify investors into four difference type: individual traders, domestic institutional traders, futures proprietary firms and foreign institutional traders. Therefore, we also examine whether the trader types of investors will affect the relationship between overconfidence and behavioral bias. First, we find that the risk taking is signification positive related to overconfidence effect. Secondly, our finding shows that as the investors are domestic institutions and individual traders, the overconfidence bias will affect investors to increase their risk 20.
(26) taking. However, foreign institutions and futures proprietary firms are not influenced by the overconfidence bias. Therefore, our results are consistent with Barber and Odean (2001) that greater overconfidence leads to higher trading volume.. 立. 政 治 大. ‧. ‧ 國. 學. n. er. io. sit. y. Nat. al. Ch. engchi. 21. i n U. v.
(27) Table 1 Sample characteristics. This table presents the summary statistics of return and volume during 5-day, 10-day, and 25-day holding-period, with Panel A showing the statistics for all traders, and Panels B–E presenting the respective statistics for foreign institutions, domestic institutions, futures proprietary firms and individual traders. ‘Returns’ refer to the 5-day (10-day, or 25-day) holding-period returns for both the net long and net short positions. A net long (net short) position is defined when an investor’s cumulative buy volume during the 5-day (10-day, or 25-day) holding period is larger (smaller) than his cumulative sell volume. Volume is the average daily trading volume for all accounts. 5-day holding. 10-day holding. 25-day holding. Average. period. period. period. Mean. Variables. Mean. p-value. Panel A: all traders. 立. N. 4,407,316. 1.04 <0.0001. 1.15 <0.0001. 1.54 <0.0001. 1.24. 1.04 <0.0001. 1.04 <0.0001. 0.77 <0.0001. 0.95. 7.42 <0.0001. 7.20 <0.0001. 6.93 <0.0001. 7.19. 7.47 <0.0001. 7.16 <0.0001. 6.97 <0.0001. 7.20. ‧ 國. Net short position. Ch. 19,162(0.43%). Return(×10-3) Net long position. al. n. N. -0.26. y. sit. er. io. Panel B: foreign institutions. 4,763,883. ‧. Sell. Nat. Buy. p-value. 學. Volume. Mean. 5,146,245. Return(×10 ). Net short position. p-value. 4,738,088. -3. Net long position. 政 治 大 Mean. 19,773(0.42%). engchi. 0.6847. -0.75. 0.4168. 1.83 <0.0001. 3.19. i n U. v. 20,243(0.39%). -3.04. 19,726(0.42%). 0.22. -1.35. 0.0002. 3.60 <0.0001. 2.87. Volume Buy. 158.50 <0.0001. 156.80 <0.0001. 154.40 <0.0001. 156.57. Sell. 154.50 <0.0001. 152.80 <0.0001. 150.50 <0.0001. 152.60. 22.
(28) Panel C: domestic institutions N. 35,026(0.79%). 37,098(0.78%). 39,267(0.76%). 37,130(0.78%). Net long position. 1.37 <0.0001. 1.25 <0.0001. 1.49 <0.0001. 1.37. Net short position. 0.97 <0.0001. 1.06 <0.0001. 0.85 <0.0001. 0.96. Buy. 21.01 <0.0001. 21.19 <0.0001. 20.87 <0.0001. 21.02. Sell. 19.48 <0.0001. 19.36 <0.0001. 19.31 <0.0001. 19.39. 1,265(0.03%). 1,267(0.02%). 1,266(0.03%). Return(×10-3). Volume. Panel D: futures proprietary firms N. 1,265(0.03%) -3. Return(×10 ) Net long position. -6.22. Net short position. -6.22. 立. 0.1109. 政 治 大 8.91. 0.0005. 44.43. 0.2049. 15.71. -2.08. 0.1223. -11.07. 0.0003. -6.46. ‧ 國. 學. Volume. 0.0665. Buy Sell. 7,531.00 <0.0001 7,542.30 <0.0001 7,530.40 <0.0001. 7,534.57. 7,440.10 <0.0001 7,451.40 <0.0001 7,439.60 <0.0001. 7,443.70. ‧. Net short position. 1.04 <0.0001. al 1.04 <0.0001 Ch n. Net long position. io. Return(×10 ). Volume. y. sit. 4,351,863(98.74%) 4,679,952(98.77%) 5,085,468(98.82%) 4,705,761(98.78%) -3. 1.16 <0.0001 1.03 <0.0001. engchi. er. N. Nat. Panel E: individual traders. 1.55 <0.0001. i v <0.0001 0.76 n U. 1.25 0.94. Buy. 4.46 <0.0001. 4.38 <0.0001. 4.36 <0.0001. 4.40. Sell. 4.56 <0.0001. 4.48 <0.0001. 4.45 <0.0001. 4.50. 23.
(29) Table 2 Sample characteristics. This table presents the summary statistics of number of trades, trade size, number of orders, order size, and trade to order ratio during 5-day (10-day, or 25-day) holding-period, with Panel A showing the statistics for all traders, and Panels B–E presenting the respective statistics for foreign institutions, domestic institutions, futures proprietary firms and individual traders. Number of trades and orders are the number of all index options trades/orders that each investor executed during the respective time period. Trade size is the average daily transacted contracts. Order size is the average daily order contracts. Trade to order ratio is the average ratio of number of trades to number of orders, defined as number of trades divided by the number of orders.. 政 治 大. 立. io. n. al. 4.90 14.38 8.61 25.81 0.82. Panel B: foreign institutions Number of Trades Trade Size Number of Order Order Size Trade to Order Ratio. 61.85 315.30 141.10 622.10 0.81. Ch. 137.30 548.60 392.30 1,769.20 0.24. e n g c61.20 hi 311.80 139.20 613.90 0.81. 24. 84.98 297.40 299.20 757.60 0.24. y. 87.96 307.80 309.90 782.20 0.24. St. Dev.. sit. Mean. er. 5.04 14.91 8.93 26.82 0.81. St. Dev.. 25-day holding period. ‧. ‧ 國. Mean. Nat. Panel A: all traders Number of Trades Trade Size Number of Order Order Size Trade to Order Ratio. 10-day holding period. 學. Variables. 5-day holding period. i n U. Mean. St. Dev.. Average Mean. 4.80 13.92 8.33 24.81 0.82. 81.63 285.70 287.10 727.30 0.24. 4.91 14.40 8.63 25.81 0.82. 60.45 307.00 137.00 603.40 0.81. 135.40 540.80 385.20 1,735.40 0.24. 61.17 311.37 139.10 613.13 0.81. v. 137.30 548.00 389.80 1,755.20 0.24.
(30) Panel C: domestic institutions Number of Trades Trade Size Number of Order Order Size Trade to Order Ratio. 8.25 40.56 10.95 55.60 0.80. 16.89 91.02 20.61 125.80 0.23. 立. Panel D: futures proprietary firms Number of Trades(×103). 8.26 40.61 10.93 55.49 0.81. 16.99 90.98 20.72 124.60 0.23. 8.19 40.24 10.83 55.01 0.81. 16.84 90.78 20.52 124.90 0.23. 8.23 40.47 10.90 55.37 0.81. 3.47. 3.77. 3.47. 3.77. 9.61. 14.97. 9.62. 14.98. 政 治 大 3.77. 14.97. 9.61. 14.99. Number of Order(×10 ). 10.41. 14.91. 10.43. 14.92. 10.42. 14.91. 10.42. Order Size(×103). 32.26. 31.35. 32.37. 31.46. 32.32. 31.47. 32.32. 0.59. 0.19. 0.59. 0.19. 0.59. 0.19. 0.59. 3.61 8.82 5.21 14.23 0.82. 11.42 47.26 20.83 124.30 0.24. 3.63 8.91 5.25 14.39 0.82. y. ‧. 3.62 11.22 a l11.40 v i 47.28 47.84 8.87 n Ch 20.99 e n g c 5.23 h i U 20.76. n. 3.67 9.03 5.31 14.60 0.81. io. Panel E: individual traders Number of Trades Trade Size Number of Order Order Size Trade to Order Ratio. Nat. Trade to Order Ratio. sit. 3. er. Trade Size(×10 ). ‧ 國. 3.47. 學. 3.77. 3. 128.20 0.24. 14.35 0.82. 25. 127.30 0.24.
(31) Table 3 The variation of risk taking for overconfident investors tests in number of trades. This table presents the difference in cumulative number of trades between the risk taking testing period after the definition period and the risk taking testing period before the definition period by overconfident investors from all traders and the four trader types (foreign institutions, domestic institutions, futures proprietary firms and individual traders). Overconfident investor is defined that investor in definition period has a net long (short) position, trades gains from that position, and has a net buy (sell) volume in subsequent period. Definition period includes 5-day, 10-day, and 25-day. Risk taking testing period includes 20-day, 60-day, and 90-day. Number of trades is the number of all index futures trades that each investor executed during the respective time period. The t-statistics are in parentheses.. al. 47.55 127.27 174.21 45.27 117.32 157.59 2.27 9.95 16.62 (28.72***) (46.40***) (52.58***). n 2,555.19 2,380.25 174.90 (4.34***). 90-day. 20-day. 60-day. 90-day. 41.39 111.44 154.69 38.72 103.00 140.71 2.67 8.43 13.98 (38.17***) (44.55***) (50.28***). er. io. Panel B: foreign institutions Subsequent period 909.36 Prior period 877.00 Difference 32.36 t-statistic (2.57**). 60-day. ‧. 53.31 135.59 193.35 51.20 126.04 176.53 2.11 9.55 16.82 (24.73***) (39.58***) (46.53***). 20-day. y. 90-day. 25-day. sit. 60-day. Nat. Panel A: all traders Subsequent period Prior period Difference t-statistic. 20-day. 10-day. 學. Risk taking testing period. 立. 5-day. ‧ 國. Definition period. 政 治 大. Ch. 3,696.34 3,359.13 337.20 (5.26***). 897.00 863.47 33.53 (2.22**). engchi. 26. i n U. v. 2,545.93 2,341.94 204.00 (4.39***). 3,687.49 3,362.08 325.40 (4.50***). 853.18 753.70 99.48 (6.77***). 2,446.25 2,063.12 383.10 (8.75***). 3,613.93 2,947.48 666.50 (9.66***).
(32) Panel C: domestic institutions Subsequent period 116.63 Prior period 110.42 Difference 6.21 t-statistic (4.18***). 307.06 291.21 15.85 (3.51***). 439.83 410.50 29.33 (4.23***). Panel D: futures proprietary firms. 106.93 102.18 4.76 (3.03***). 284.77 270.78 13.98 (3.17***). 404.23 377.63 26.60 (4.27***). 93.95 90.33 3.62 (2.50**). 252.90 249.19 3.71 (0.91). 358.65 342.78 15.87 (2.82***). 86.96. 239.78. 353.63. 79.03. 212.56. 313.61. 政 治 大. 223.64. 立 329.99. Prior period(×103). 76.39. 211.43. 306.27. 83.44. 227.78. 332.46. 66.73. 196.60. 288.92. 2.28. 12.21. 23.72. 3.52. 12.00. 21.17. 12.29. 15.96. 24.69. (1.56). (1.95*). (1.00). (1.17). (1.35). (4.32***). (2.03**). (1.94*). 159.23. 42.08. 109.80. 151.10. 37.22. 98.86. 137.06. 43.92 107.89 144.95 1.82 8.28 14.28 (25.51***) (42.16***) (49.43***). io. al. n. Prior period Difference t-statistic. y. 116.17. sit. 45.74. 40.08 101.03 136.52 2.00 8.77 14.59 (29.42***) (48.58***) (55.59***). er. Panel E: individual traders Subsequent period. Difference(×10 ). ‧. (1.13). 3. Nat. t-statistic. ‧ 國. 78.66. 學. Subsequent period(×103). i n C hengchi U * Indicates significance of at the 10% level for the t-statistic test.. ** Indicates significance of at the 5% level for the t-statistic test. *** Indicates significance of at the 1% level for the t-statistic test.. 27. v. 34.83 91.24 124.88 2.39 7.62 12.17 (38.95***) (46.47***) (51.20***).
(33) Table 4 The variation of risk taking for overconfident investors tests in trade size. This table presents the difference in cumulative trade size between the risk taking testing period after the definition period and the risk taking testing period before the definition period by overconfident investors from all traders and the four trader types (foreign institutions, domestic institutions, futures proprietary firms and individual traders). Overconfident investor is defined that investor in definition period has a net long (short) position, trades gains from that position, and has a net buy (sell) volume in subsequent period. Definition period includes 5-day, 10-day, and 25-day. Risk taking testing period includes 20-day, 60-day, and 90-day. Trade size is the average daily transacted contracts. The t-statistics are in parentheses.. al. 137.65 354.00 497.50 131.11 330.58 459.69 6.54 23.43 37.82 (21.83***) (29.26***) (32.14***). n 14,045.51 13,429.43 616.10 (4.11***). 90-day. 20-day. 60-day. 90-day. 113.66 303.33 427.99 106.59 283.74 398.17 7.07 19.59 29.82 (27.81***) (29.01***) (30.48***). er. io. Panel B: foreign institutions Subsequent period 4,919.16 Prior period 4,879.50 Difference 39.66 t-statistic (0.69). 60-day. ‧. 157.23 425.18 571.86 149.56 401.72 530.33 7.67 23.46 41.53 (22.60***) (24.87***) (29.53***). 20-day. y. 90-day. 25-day. sit. 60-day. Nat. Panel A: all traders Subsequent period Prior period Difference t-statistic. 20-day. 10-day. 學. Risk taking testing period. 立. 5-day. ‧ 國. Definition period. 政 治 大. Ch. 20,275.66 18,981.49 1,294.20 (5.88***). 4,793.22 4,684.22 109.00 (1.76*). engchi. 28. i n U. v. 13,614.57 12,662.21 952.40 (6.05***). 19,463.22 17,896.91 1,566.30 (7.02***). 4,479.75 4,321.75 158.00 (2.62***). 13,049.41 11,996.80 1,052.60 (6.81***). 18,890.52 16,908.62 1,981.90 (8.96***).
(34) Panel C: domestic institutions Subsequent period 568.26 Prior period 538.81 Difference 29.45 t-statistic (3.67***). 1,440.52 1,375.94 64.58 (2.75***). 2,022.23 1,915.66 106.60 (2.98***). Panel D: futures proprietary firms. 立. 522.82 499.19 23.63 (2.88***). 1,337.46 1,308.83 28.63 (1.20). 1,866.29 1,805.43 60.87 (1.77*). 450.19 425.81 24.37 (3.19***). 1,204.48 1,181.62 22.87 (1.01). 1,679.05 1,616.81 62.23 (1.94*). 政 治 大. 875.96. 1,291.70. 328.73. 917.54. 1,345.02. 312.05. 846.55. 1,255.10. Prior period(×103). 300.67. 860.44. 1,262.75. 317.32. 903.40. 1,334.41. 269.90. 816.74. 1,235.34. 4.33. 15.51. 28.94. 11.41. 14.14. 10.61. 42.15. 29.82. 19.76. (0.66). (0.79). (1.07). (0.47). (0.23). (4.62***). (1.20). (0.50). 411.94. 107.13. 276.32. 381.44. 92.23. 243.07. 336.96. 113.22 282.92 381.93 6.09 19.10 30.01 (24.86***) (28.23***) (30.60***). n. al. y. 302.02. io. Prior period Difference t-statistic. 119.31. Nat. Panel E: individual traders Subsequent period. (0.68). ‧. t-statistic. sit. Difference(×10 ). 101.87 257.96 353.04 5.25 18.35 28.40 (23.07***) (30.56***) (32.76***). er. 3. ‧ 國. 305.00. 學. Subsequent period(×103). i n C hengchi U * Indicates significance of at the 10% level for the t-statistic test.. ** Indicates significance of at the 5% level for the t-statistic test. *** Indicates significance of at the 1% level for the t-statistic test.. 29. v. 86.58 228.24 314.67 5.65 14.83 22.29 (28.15***) (28.18***) (29.53***).
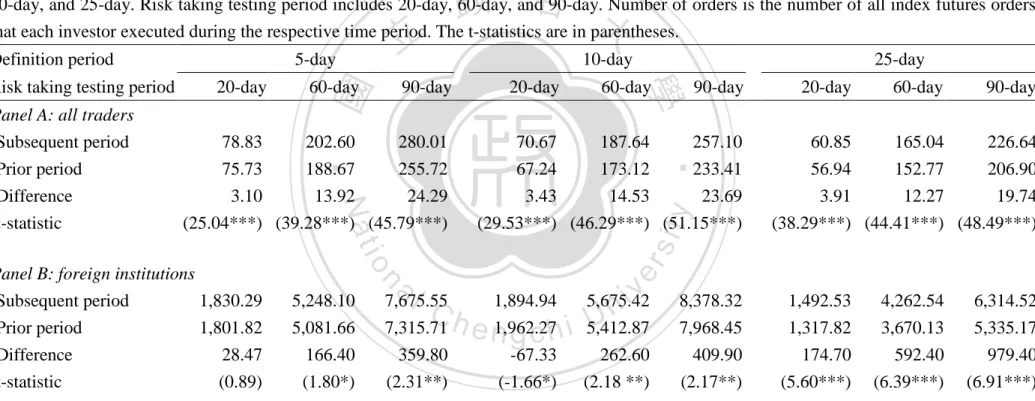
(35) Table 5 The variation of risk taking for overconfident investors tests in number of orders. This table presents the difference in cumulative number of orders between the risk taking testing period after the definition period and the risk taking testing period before the definition period by overconfident investors from all traders and the four trader types (foreign institutions, domestic institutions, futures proprietary firms and individual traders). Overconfident investor is defined that investor in definition period has a net long (short) position, trades gains from that position, and has a net buy (sell) volume in subsequent period. Definition period includes 5-day, 10-day, and 25-day. Risk taking testing period includes 20-day, 60-day, and 90-day. Number of orders is the number of all index futures orders that each investor executed during the respective time period. The t-statistics are in parentheses.. al. 70.67 187.64 257.10 67.24 173.12 233.41 3.43 14.53 23.69 (29.53***) (46.29***) (51.15***). n 5,248.10 5,081.66 166.40 (1.80*). 90-day. 20-day. 60-day. 90-day. 60.85 165.04 226.64 56.94 152.77 206.90 3.91 12.27 19.74 (38.29***) (44.41***) (48.49***). er. io. Panel B: foreign institutions Subsequent period 1,830.29 Prior period 1,801.82 Difference 28.47 t-statistic (0.89). 60-day. ‧. 78.83 202.60 280.01 75.73 188.67 255.72 3.10 13.92 24.29 (25.04***) (39.28***) (45.79***). 20-day. y. 90-day. 25-day. sit. 60-day. Nat. Panel A: all traders Subsequent period Prior period Difference t-statistic. 20-day. 10-day. 學. Risk taking testing period. 立. 5-day. ‧ 國. Definition period. 政 治 大. Ch. 7,675.55 7,315.71 359.80 (2.31**). 1,894.94 1,962.27 -67.33 (-1.66*). engchi. 30. i n U. v. 5,675.42 5,412.87 262.60 (2.18 **). 8,378.32 7,968.45 409.90 (2.17**). 1,492.53 1,317.82 174.70 (5.60***). 4,262.54 3,670.13 592.40 (6.39***). 6,314.52 5,335.17 979.40 (6.91***).
(36) Panel C: domestic institutions Subsequent period 158.33 Prior period 150.77 Difference 7.57 t-statistic (3.83***). 416.79 395.45 21.34 (3.59***). 599.13 559.89 39.23 (4.34***). Panel D: futures proprietary firms. 144.14 139.60 4.54 (2.17**). 383.72 370.25 13.47 (2.32**). 545.68 517.46 28.22 (3.45***). 127.26 123.60 3.66 (1.91*). 339.90 339.20 0.70 (0.13). 483.92 468.77 15.14 (2.04**). 251.62. 664.86. 941.70. 211.95. 545.09. 818.67. 政 治 大. 633.00. 立 915.48. Prior period(×103). 215.40. 608.87. 880.89. 254.85. 728.71. 1,071.63. 180.56. 550.56. 801.98. 9.46. 24.13. 34.59. -3.23. -63.85. -129.94. 31.38. -5.47. 16.70. t-statistic. (1.07). (0.82). (0.62). (-0.23). (-1.82*). (-2.03**). (3.21***). ( -0.13). (0.24). Panel E: individual traders Subsequent period. 68.44. 173.56. 237.64. 62.76. 163.55. 54.84. 145.88. 201.19. io. 65.73 161.09 216.40 2.70 12.47 21.24 (25.74***) (42.79***) (49.55***). n. al. y. ‧. Nat. Prior period Difference t-statistic. sit. Difference(×10 ). 225.10. 59.67 150.42 203.69 3.09 13.13 21.41 (30.70***) (49.16***) (55.07***). er. 3. ‧ 國. 224.86. 學. Subsequent period(×103). i n C hengchi U * Indicates significance of at the 10% level for the t-statistic test.. ** Indicates significance of at the 5% level for the t-statistic test. *** Indicates significance of at the 1% level for the t-statistic test.. 31. v. 51.33 134.68 183.41 3.51 11.20 17.78 (38.81***) (46.36***) (50.46***).
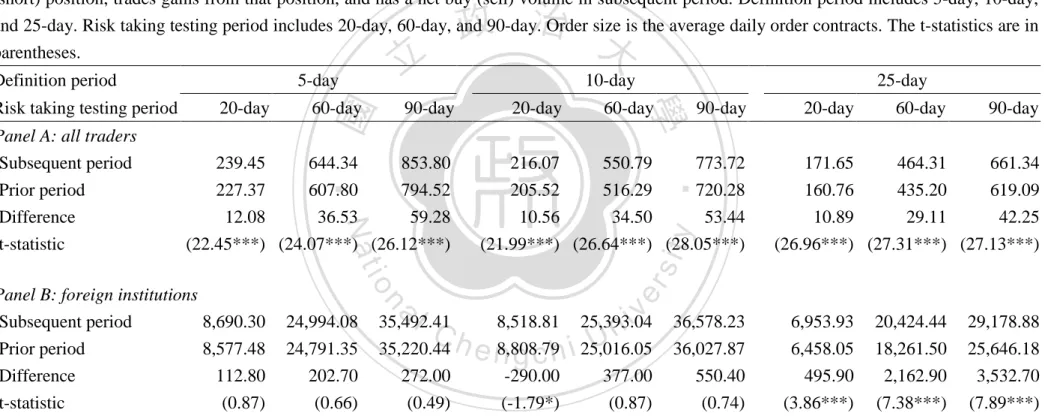
(37) Table 6 The variation of risk taking for overconfident investors tests in order size. This table presents the difference in cumulative order size between the risk taking testing period after the definition period and the risk taking testing period before the definition period by overconfident investors from all traders and the four trader types (foreign institutions, domestic institutions, futures proprietary firms and individual traders). Overconfident investor is defined that investor in definition period has a net long (short) position, trades gains from that position, and has a net buy (sell) volume in subsequent period. Definition period includes 5-day, 10-day, and 25-day. Risk taking testing period includes 20-day, 60-day, and 90-day. Order size is the average daily order contracts. The t-statistics are in parentheses.. al. 216.07 550.79 773.72 205.52 516.29 720.28 10.56 34.50 53.44 (21.99***) (26.64***) (28.05***). n 24,994.08 24,791.35 202.70 (0.66). 90-day. 20-day. 60-day. 90-day. 171.65 464.31 661.34 160.76 435.20 619.09 10.89 29.11 42.25 (26.96***) (27.31***) (27.13***). er. io. Panel B: foreign institutions Subsequent period 8,690.30 Prior period 8,577.48 Difference 112.80 t-statistic (0.87). 60-day. ‧. 239.45 644.34 853.80 227.37 607.80 794.52 12.08 36.53 59.28 (22.45***) (24.07***) (26.12***). 20-day. y. 90-day. 25-day. sit. 60-day. Nat. Panel A: all traders Subsequent period Prior period Difference t-statistic. 20-day. 10-day. 學. Risk taking testing period. 立. 5-day. ‧ 國. Definition period. 政 治 大. Ch. 35,492.41 35,220.44 272.00 (0.49). 8,518.81 8,808.79 -290.00 (-1.79*). engchi. 32. i n U. v. 25,393.04 25,016.05 377.00 (0.87). 36,578.23 36,027.87 550.40 (0.74). 6,953.93 6,458.05 495.90 (3.86***). 20,424.44 18,261.50 2,162.90 (7.38***). 29,178.88 25,646.18 3,532.70 (7.89***).
(38) Panel C: domestic institutions Subsequent period 783.67 Prior period 753.23 Difference 30.45 t-statistic (2.65***). 1,983.20 1,914.12 69.07 (2.10**). 2,774.58 2,670.55 104.00 (2.13**). Panel D: futures proprietary firms. 立. 720.28 691.13 22.49 (1.87**). 1,837.55 1,815.98 21.58 (0.65). 2,558.40 2,508.93 49.47 (1.05). 617.19 590.84 26.34 (2.43**). 1,625.59 1,626.31 -0.72 (-0.02). 2,292.84 2,246.57 46.27 (1.08). 政 治 大. 1,903.26. 2,814.90. 743.11. 2,010.85. 2,937.28. 669.21. 1,759.23. 2,604.67. Prior period(×103). 657.38. 1,825.67. 2,660.61. 735.44. 2,036.72. 2,990.26. 561.29. 1,692.58. 2,505.41. Difference(×10 ). 18.84. 77.59. 154.29. 7.67. -25.87. -52.98. 107.92. 66,654.30. 99,261.10. t-statistic. (0.89). (1.06). (1.30). (0.23). (-0.28). (-0.36). (3.76***). (0.84). (0.75). 182.38. 465.53. 631.54. 164.59. 424.37. 583.82. 140.15. 369.07. 506.26. n. al. sit. y. ‧. 173.00 436.20 586.65 9.38 29.34 44.89 (24.29***) (27.06***) (28.53***). io. Prior period Difference t-statistic. Nat. Panel E: individual traders Subsequent period. 156.13 397.36 542.24 8.46 27.01 41.58 (23.48***) (28.10***) (29.98***). er. 3. ‧ 國. 676.22. 學. Subsequent period(×103). i n C hengchi U * Indicates significance of at the 10% level for the t-statistic test.. ** Indicates significance of at the 5% level for the t-statistic test. *** Indicates significance of at the 1% level for the t-statistic test.. 33. v. 131.54 346.66 472.90 8.61 22.41 33.36 (27.35***) (27.04***) (27.81***).
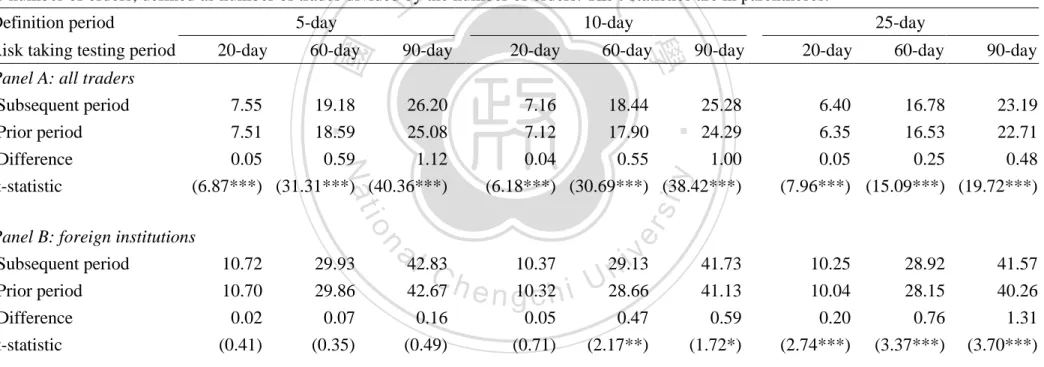
(39) Table 7 The variation of risk taking for overconfident investors tests in trade to order ratio. This table presents the difference in cumulative trade to order ratio between the risk taking testing period after the definition period and the risk taking testing period before the definition period by overconfident investors from all traders and the four trader types (foreign institutions, domestic institutions, futures proprietary firms and individual traders). Overconfident investor is defined that investor in definition period has a net long (short) position, trades gains from that position, and has a net buy (sell) volume in subsequent period. Definition period includes 5-day, 10-day, and 25-day. Risk taking testing period includes 20-day, 60-day, and 90-day. Trade to order ratio is the average ratio of number of trades to number of orders, defined as number of trades divided by the number of orders. The t-statistics are in parentheses.. 29.93 29.86 0.07 (0.35). a42.83 l C h 42.67 0.16 (0.49). 90-day. 7.16 18.44 25.28 7.12 17.90 24.29 0.04 0.55 1.00 (6.18***) (30.69***) (38.42***). n. 10.72 10.70 0.02 (0.41). 60-day. ‧. io. Panel B: foreign institutions Subsequent period Prior period Difference t-statistic. Nat. 7.55 19.18 26.20 7.51 18.59 25.08 0.05 0.59 1.12 (6.87***) (31.31***) (40.36***). 20-day. y. 90-day. sit. 60-day. 25-day 20-day. 60-day. 90-day. 6.40 16.78 23.19 6.35 16.53 22.71 0.05 0.25 0.48 (7.96***) (15.09***) (19.72***). er. 20-day. 10-day. 學. Risk taking testing period Panel A: all traders Subsequent period Prior period Difference t-statistic. 立. 5-day. ‧ 國. Definition period. 政 治 大. 10.37 10.32 0.05 (0.71). engchi. 34. i n U. v. 29.13 28.66 0.47 (2.17**). 41.73 41.13 0.59 (1.72*). 10.25 10.04 0.20 (2.74***). 28.92 28.15 0.76 (3.37***). 41.57 40.26 1.31 (3.70***).
(40) 24.19 24.08 0.11 (0.61). 34.06 33.75 0.31 (1.06). 8.14 8.00 0.13 (2.12**). 11.00 11.01 -0.01 (-0.06). 31.96 32.46 -0.51 (-1.25). 46.99 48.08 -1.09 (-1.71*). 10.98 11.79 -0.81 (-5.55***). 7.11. 18.27. 22.14 22.14 0.01 (0.04). 31.10 31.05 0.05 (0.17). 32.11 47.50 34.40 51.28 -2.28 -3.78 (-4.88***) (-4.89***). 7.45 18.38 24.75 0.05 0.60 1.14 (6.71***) (31.61***) (40.82***). n. al. sit. 25.89. y. ‧. 18.98. io. Prior period Difference t-statistic. 7.49. Nat. Panel E: individual traders Subsequent period. 33.09 32.79 0.29 (1.04). 政 治 大. ‧ 國. 立. 23.57 23.39 0.17 (0.95). 學. Panel D: futures proprietary firms Subsequent period 11.22 32.81 48.46 Prior period 11.46 33.93 50.39 Difference -0.24 -1.11 -1.92 t-statistic (-3.23***) (-2.88***) (-2.71***). 8.79 8.66 0.13 (2.13**). 25.02. 7.07 17.72 24.01 0.04 0.55 1.01 (5.94***) (30.76***) (38.70***). er. Panel C: domestic institutions Subsequent period 9.10 Prior period 9.03 Difference 0.07 t-statistic (1.12). i n C * Indicates significance of at the 10% level for the t-statistic test. hengchi U. ** Indicates significance of at the 5% level for the t-statistic test. *** Indicates significance of at the 1% level for the t-statistic test.. 35. v. 6.35. 16.62. 22.95. 6.30 16.37 22.47 0.05 0.25 0.48 (7.72***) (15.11***) (19.77***).
(41) Table 8 The variation of risk taking for non-overconfident investors tests in number of trades. This table presents the difference in cumulative number of trades between the risk taking testing period after the definition period and the risk taking testing period before the definition period by overconfident investors from all traders and the four trader types (foreign institutions, domestic institutions, futures proprietary firms and individual traders). Overconfident investor is defined that investor in definition period has a net long (short) position, trades gains from that position, and has a net buy (sell) volume in subsequent period. Non-overconfident investors are defined as investors do not be categorized in overconfident ones. Definition period includes 5-day, 10-day, and 25-day. Risk taking testing period includes 20-day, 60-day, and 90-day. Number of trades is the number of all index futures trades that each investor executed during the respective time period. The t-statistics are in parentheses.. 政 治 大. 60-day. 92.00 87.88 4.13. 125.38 117.78 7.60. 33.24 33.02 0.23. 85.68 82.24 3.44. al. 2,494.74 2,379.12 115.60 (5.66***). 116.87 110.29 6.58. (11.04***) (64.37***) (86.11***). n. Panel B: foreign institutions Subsequent period 880.47 Prior period 857.10 Difference 23.36 t-statistic (3.24***). 90-day. 20-day. 60-day. 90-day. 28.19 28.09 0.10. 75.26 72.18 3.08. 103.64 97.97 5.68. (4.79***) (56.32***) (73.70***). er. (21.11***) (76.28***) (97.32***). sit. 20-day. 25-day. ‧. 90-day. io. t-statistic. 36.40 35.97 0.43. 60-day. Nat. Panel A: all traders Subsequent period Prior period Difference. 20-day. 10-day. ‧ 國. Risk taking testing period. 5-day. 學. Definition period. y. 立. Ch. 3,574.16 3,366.29 207.90 (6.59***). e n g839.82 chi 818.59 21.23 (2.94***). 36. i n U. v. 2,386.17 2,271.54 114.60 (5.59***). 3,420.58 3,209.95 210.60 (6.79***). 780.41 745.51 34.90 (4.19***). 2,215.64 2,074.03 141.60 (6.12***). 3,165.97 2,960.64 205.30 (6.40***).
(42) Panel C: domestic institutions Subsequent period Prior period Difference t-statistic. 92.98 92.30 0.68 (1.27). 248.04 242.19 5.85 (3.58***). 347.78 337.19 10.59 (4.29***). 88.05 87.20 0.85 (1.51). 238.36 233.39 4.97 (2.96***). 333.77 323.56 10.20 (4.08***). 77.84 77.13 0.70 (1.11). 214.77 209.75 5.03 (2.76***). 302.43 290.79 11.63 (4.40***). 政 治 大. Panel D: futures proprietary firms 220.83. 立331.81. 70.52. 217.02. 326.24. 73.10. 225.29. 337.52. Prior period(×103). 69.26. 196.54. 283.56. 66.20. 189.31. 273.00. 67.03. 188.25. 271.02. 24.29. 48.26. 4.32. 27.71. 53.24. 6.07. 37.04. 66.49. (8.14***) (10.60***). (4.78***). (9.86***) (12.67***). (4.50***). 117.47. 33.97 82.44 110.37 0.38 3.87 7.10 (20.02***) (76.45***) (97.70***). n. al. 31.42. 80.21. y. 86.31. io. Prior period Difference t-statistic. 34.36. Nat. Panel E: individual traders Subsequent period. (3.64***). ‧. t-statistic. 3.29. sit. Difference(×10 ). 109.38. 31.23 77.00 103.28 0.19 3.21 6.09 (9.56***) (64.21***) (85.77***). er. 3. ‧ 國. 72.55. 學. Subsequent period(×103). i n C hengchi U * Indicates significance of at the 10% level for the t-statistic test.. ** Indicates significance of at the 5% level for the t-statistic test. *** Indicates significance of at the 1% level for the t-statistic test.. 37. v. 26.56. (9.53***) (11.93***). 70.37. 96.36. 26.53 67.59 91.26 0.04 2.78 5.10 (1.94**) (54.44***) (71.31***).
(43) Table 9 The variation of risk taking for non-overconfident investors tests in trade size. This table presents the difference in cumulative trade size between the risk taking testing period after the definition period and the risk taking testing period before the definition period by overconfident investors from all traders and the four trader types (foreign institutions, domestic institutions, futures proprietary firms and individual traders). Overconfident investor is defined that investor in definition period has a net long (short) position, trades gains from that position, and has a net buy (sell) volume in subsequent period. Non-overconfident investors are defined as investors do not be categorized in overconfident ones. Definition period includes 5-day, 10-day, and 25-day. Risk taking testing period includes 20-day, 60-day, and 90-day. Trade size is the average daily transacted contracts. The t-statistics are in parentheses. 20-day. 77.56 202.65 278.50 77.88 199.68 271.67 -0.32 2.96 6.83 (-5.18***) (18.05***) (28.98***). 65.11 66.61 -1.50 (-23.61***). n. al. 90-day. 60-day. 90-day. 174.92 240.45 174.18 237.78 0.75 2.68 (4.49***) (11.42***). er. io. Panel B: foreign institutions Subsequent period 4,690.62 Prior period 4,582.28 Difference 108.30 t-statistic (3.44***). 60-day. ‧. 84.94 216.74 300.62 84.57 211.88 291.07 0.37 4.86 9.55 (6.00***) (29.03***) (39.49***). 20-day. y. 90-day. 25-day. sit. 60-day. Nat. Panel A: all traders Subsequent period Prior period Difference t-statistic. 20-day. 10-day. 學. Risk taking testing period. 立. 5-day. ‧ 國. Definition period. 政 治 大. Ch. 13,415.20 19,415.69 12,747.59 18,064.95 667.60 1,350.70 (8.27***) (11.63***). 4,518.44 4,400.56 117.90 (3.64***). engchi. 38. i n U. v. 12,919.48 18,756.21 12,295.25 17,421.58 624.20 1,334.60 (7.73***) (11.38***). 4,269.46 12,168.69 17,724.30 4,026.48 11,242.92 16,060.87 243.00 925.80 1,663.40 (7.07***) (10.94***) (13.04***).
(44) Panel C: domestic institutions Subsequent period Prior period Difference t-statistic. 450.79 452.77 -1.99 (-0.69). 1,164.36 1,187.03 -22.67 (-2.45**). 1,617.07 1,638.62 -21.55 (-1.54). Panel D: futures proprietary firms. 立. 425.36 1,106.02 432.55 1,133.83 -7.19 -27.81 (-2.27**) (-2.94***). 1,550.90 1,574.42 -23.52 (-1.67*). 政 治 大. 366.31 996.58 1,393.33 382.43 1,035.23 1,432.51 -16.12 -38.65 -39.18 ( -4.52***) (-3.78***) (-2.67***). 889.28. 1,325.89. 286.30. 878.94. 1,311.50. 288.94. 881.33. 1,313.80. Prior period(×103). 284.16. 829.56. 1,208.12. 276.56. 811.20. 1,179.81. 278.71. 794.76. 1,152.01. 8.46. 59.71. 117.77. 9.73. 67.74. 131.69. 10.22. 86.57. 161.80. (2.78***). (6.25***). (8.21***). (3.16***). (7.39***). (9.79***). (2.41**). (7.28***). (9.37***). 74.87. 189.36. 68.36. 175.41. 239.65. 57.08. 151.05. 208.58. 68.82 173.06 234.67 -0.47 2.35 4.97 (-8.51***) (16.42***) (24.51***). 58.66 -1.58 (-28.32***). 151.35 -0.30 (-2.08**). 207.63 0.95 (4.73***). n. al. y. 259.12. 74.70 185.26 251.64 0.18 4.10 7.48 (3.25***) (28.19***) (35.74***). io. Prior period Difference t-statistic. Nat. Panel E: individual traders Subsequent period. ‧. t-statistic. sit. Difference(×10 ). er. 3. ‧ 國. 292.62. 學. Subsequent period(×103). i n C hengchi U * Indicates significance of at the 10% level for the t-statistic test.. ** Indicates significance of at the 5% level for the t-statistic test. *** Indicates significance of at the 1% level for the t-statistic test.. 39. v.
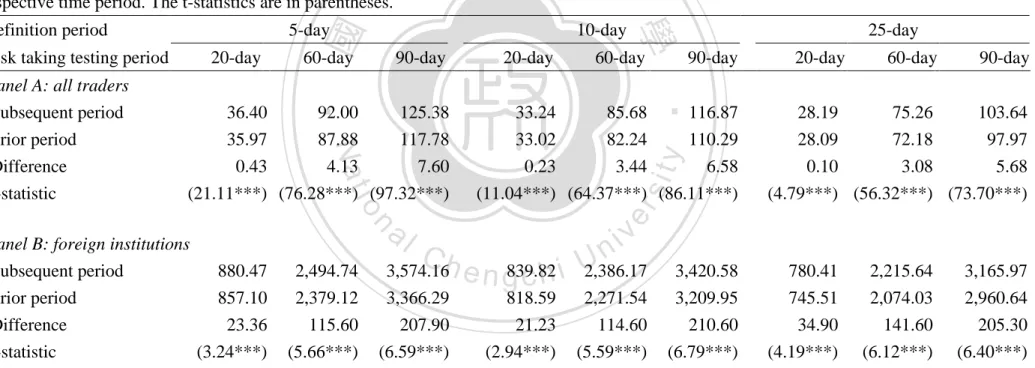
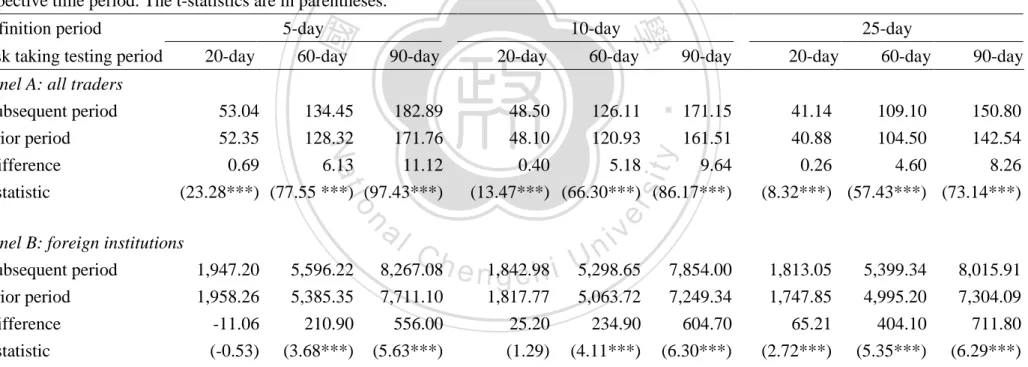
(45) Table 10 The variation of risk taking for non-overconfident investors tests in number of orders. This table presents the difference in cumulative number of orders between the risk taking testing period after the definition period and the risk taking testing period before the definition period by overconfident investors from all traders and the four trader types (foreign institutions, domestic institutions, futures proprietary firms and individual traders). Overconfident investor is defined that investor in definition period has a net long (short) position, trades gains from that position, and has a net buy (sell) volume in subsequent period. Non-overconfident investors are defined as investors do not be categorized in overconfident ones. Definition period includes 5-day, 10-day, and 25-day. Risk taking testing period includes 20-day, 60-day, and 90-day. Number of orders is the number of all index futures orders that each investor executed during the respective time period. The t-statistics are in parentheses.. 政 治 大. 60-day. 182.89 171.76 11.12. 48.50 48.10 0.40. 126.11 120.93 5.18. al. 5,596.22 5,385.35 210.90 (3.68***). 171.15 161.51 9.64. (13.47***) (66.30***) (86.17***). n. Panel B: foreign institutions Subsequent period 1,947.20 Prior period 1,958.26 Difference -11.06 t-statistic (-0.53). 90-day. 20-day. 60-day. 90-day. 41.14 40.88 0.26. 109.10 104.50 4.60. 150.80 142.54 8.26. (8.32***) (57.43***) (73.14***). er. (23.28***) (77.55 ***) (97.43***). sit. 20-day. 25-day. ‧. 90-day. 134.45 128.32 6.13. io. t-statistic. 53.04 52.35 0.69. 60-day. Nat. Panel A: all traders Subsequent period Prior period Difference. 20-day. 10-day. ‧ 國. Risk taking testing period. 5-day. 學. Definition period. y. 立. Ch. 8,267.08 7,711.10 556.00 (5.63***). e n1,842.98 gchi 1,817.77 25.20 (1.29). 40. i n U. v. 5,298.65 5,063.72 234.90 (4.11***). 7,854.00 7,249.34 604.70 (6.30***). 1,813.05 1,747.85 65.21 (2.72***). 5,399.34 4,995.20 404.10 (5.35***). 8,015.91 7,304.09 711.80 (6.29***).
(46) Panel C: domestic institutions Subsequent period 126.77 Prior period 126.28 Difference 0.49 t-statistic (0.68). 337.73 330.85 6.88 (3.19***). 474.35 461.56 12.79 (3.92***). 120.29 119.29 1.00 (1.32). 324.45 317.85 6.60 (2.98***). 455.83 442.29 13.55 (4.11***). 106.46 105.32 1.13 (1.35). 293.24 286.35 6.88 (2.86***). 412.37 396.58 15.79 (4.53***). 政 治 大. Panel D: futures proprietary firms 612.51. 立918.54. 191.12. 606.65. 915.43. 205.97. 640.25. 956.13. Prior period(×103). 187.10. 522.10. 735.53. 172.46. 482.13. 673.82. 180.42. 490.35. 688.27. 90.40. 183.01. 18.65. 124.52. 241.60. 25.55. 149.90. 267.87. (2.59***). (7.41***). (7.69***). (5.11***). (9.61***) ( 9.70***). (5.01***). (8.26***). (8.50***). 50.39. 126.63. 172.40. 46.05. 38.98. 103.21. 142.20. 49.76 120.80 161.92 0.63 5.84 10.48 (22.56***) (78.59***) (98.18***). io. al. n. Prior period Difference t-statistic. 117.87. y. Nat. Panel E: individual traders Subsequent period. ‧. t-statistic. 10.02. sit. Difference(×10 ). 160.79. 45.71 112.98 151.77 0.35 4.89 9.02 (12.16***) (66.62***) (86.37***). er. 3. ‧ 國. 197.12. 學. Subsequent period(×103). i n C hengchi U * Indicates significance of at the 10% level for the t-statistic test.. ** Indicates significance of at the 5% level for the t-statistic test. *** Indicates significance of at the 1% level for the t-statistic test.. 41. v. 38.81 98.98 134.60 0.17 4.23 7.60 (5.83***) (56.33***) (72.14***).
(47) Table 11 The variation of risk taking for non-overconfident investors tests in order size. This table presents the difference in cumulative order size between the risk taking testing period after the definition period and the risk taking testing period before the definition period by overconfident investors from all traders and the four trader types (foreign institutions, domestic institutions, futures proprietary firms and individual traders). Overconfident investor is defined that investor in definition period has a net long (short) position, trades gains from that position, and has a net buy (sell) volume in subsequent period. Non-overconfident investors are defined as investors do not be categorized in overconfident ones. Definition period includes 5-day, 10-day, and 25-day. Risk taking testing period includes 20-day, 60-day, and 90-day. Order size is the average daily order contracts. The t-statistics are in parentheses. 20-day. 60-day. 90-day. 357.76 349.65 8.11 (2.82***). 1,013.31 1,465.56 940.53 1,320.97 72.78 144.60 (8.72***) (10.95***). 96.56 98.78 -2.22 (-22.77***). 260.08 259.69 0.39 (1.53). 354.79 352.61 2.18 (6.01***). 8,325.72 8,126.43 199.30 (2.76***). 24,305.35 23,311.60 993.80 (5.15***). 8,006.76 7,773.92 232.80 (2.44**). 23,884.90 22,735.74 1,149.20 (4.07***). 35,208.67 32,634.98 2,573.70 (5.42***). n. al. 90-day. er. io 25,651.25 24,685.35 965.90 (4.77***). 60-day. y. 125.74 326.15 441.86 125.14 319.20 428.91 0.60 6.96 12.95 (6.40***) (27.02***) (34.70***). ‧ 國. 20-day. 25-day. ‧. 90-day. Panel B: foreign institutions Subsequent period 8,662.97 Prior period 8,648.84 Difference 14.13 t-statistic (0.18). 60-day. Nat. Panel A: all traders Subsequent period Prior period Difference t-statistic. 20-day. 10-day. 學. Risk taking testing period. 立. 5-day. sit. Definition period. 政 治 大. Ch. 37,621.38 35,393.05 2,228.30 (5.95***). engchi. 42. i n U. v. 35,592.44 33,316.89 2,275.60 (6.29***).
數據

+7
相關文件
了⼀一個方案,用以尋找滿足 Calabi 方程的空 間,這些空間現在通稱為 Calabi-Yau 空間。.
Thus, for example, the sample mean may be regarded as the mean of the order statistics, and the sample pth quantile may be expressed as.. ξ ˆ
This article is for the founding of the modern centuries of Buddhist Studies in Taiwan, the mainland before 1949, the Republic of China period (1912~1949), and Taiwan from
According to the Heisenberg uncertainty principle, if the observed region has size L, an estimate of an individual Fourier mode with wavevector q will be a weighted average of
This paper is based on Tang Lin’ s Ming Bao Ji (Retribution after Death), which is written in the Early Tang period, to examine the transformation of the perception of animal since
This paper examines the effect of banks’off-balance sheet activities on their risk and profitability in Taiwan.We takes quarterly data of 37 commercial banks, covering the period
專案執 行團隊
The closing inventory value calculated under the Absorption Costing method is higher than Marginal Costing, as fixed production costs are treated as product and costs will be carried
