1
行政院國家科學委員會補助專題研究計畫成果報告
※※※※※※※※※※※※※※※※※※※※※※※※※※
※
※
※
半導體產業供應鏈配送網路之整體規劃及應用系統開發
(I)
※
※
※
※※※※※※※※※※※※※※※※※※※※※※※※※※
計畫類別:
R
個別型計畫
□整合型計畫
計畫編號:NSC90-2218-E-009-034
執行期間:
90 年
8 月
1 日至
91 年
7 月
31 日
計畫主持人:沙永傑
計畫參與人員:車振華
本成果報告包括以下應繳交之附件:
□赴國外出差或研習心得報告一份
□赴大陸地區出差或研習心得報告一份
□出席國際學術會議心得報告及發表之論文各一份
□國際合作研究計畫國外研究報告書一份
執行單位:國立交通大學工業工程與管理研究所
中
華
民
國
91
年
10
月
15
日
行政院國家科學委員會專題研究計畫成果報告
半導體產業供應鏈配送網路之整體規劃及應用系統開發(I)
The Integr ation Planning of Supply Chain Networ k System for the
Semiconductor Industr y and an Application System Development (I)
計畫編號:NSC 90-2218-E-009-034
執行期限:90 年 8 月 1 日至 91 年 7 月 31 日
主持人:沙永傑 國立交通大學工業工程與管理研究所
計畫參與人員:車振華 國立交通大學工業工程與管理研究所
1. Abstr act
Supply chain management has offered a way to make industry more competitive. While
widespread methodologies may only
effectively solve the production-distribution problem from supplier- or customer-oriented
consideration, those methods can’t
demonstrate actual situations. In the
competitive semiconductor industry
environment, simultaneously considering the perspectives of supplier and consumers is especially, because multiple manufacturing and demanding steps are performed for separate situations, concurrently. This work
presents a novel interaction-oriented
approach, based on the analytic hierarchy process (AHP) methodology, for solving the semiconductor distribution problem with multiple quantitative and qualitative criteria. This approach provides the expected optimal satisfaction for all the participators of the
whole chain while the cooperative
information is shared perfectly and
effectively.
Keywor ds: interaction-oriented analytic hierarchy process, supply chain distribution networks 中文摘要 半導體產業為目前具成長性的產業, 台灣半導體產業主要為國際廠代工,使得 此產業從供應至消費形成一規模相當龐大 的供應鏈網路系統。相對地,整個網路體 系之控制變得非常複雜,因而在進行供應 鏈網路系統規劃時,必須以宏觀的視野對 整個產業的上、中、下游作整體規劃。另 外一般供應鏈體系相關的研究仍僅考慮系 統能達成單一目標,如成本最小化、銷售 最大化… 等,且亦缺少系統化的方法指示 產業成員如何執行其任務,方可達成既定 的目標。因此,本研究將提出交互導向之 層級結構分析法,同時考量定性(彈性、 滿意度… )及定量(成本、產能、交期… ) 多種評估指標,以期在多項資源限制條件 下,建構出一適當的供應鏈配送網路系 統,使產業能達到整體最適化的成果。 關鍵詞:交互導向層級結構分析、供應鏈 配送網路、整體最適化 2. Intr oduction
Christopher (1992) stated that an adequate definition of supply chain from a logistical point of perspective is “a network of organizations that are involved, through upstream and downstream linkages, in different processes and activities that produce value in the form of products and services in the hands of the ultimate consumer” point of perspective. Supply chain management,
increases the competitiveness of the
industrial environment, involves planning and managing the flow of information,
material, and product through a
multi-echelon of design,
production/manufacturing, transportation and distribution until it reaches the customer.
In the semiconductor industry, modeling the supply chain is particularly critical. Semiconductor fabrication, assembly and testing facilities represent very substantial capital investments. The essence of supply
chain management is considered to be the integration of business activities to serve end customers by establishing a strategic partner alliance. The relationships in a supply chain may adopt various legal forms (Ellram 1991). Figure 1 illustrates the relationship between the dependent natures of supplier-customer relations. For the semiconductor supply chain, the relationship between supplier and customer tends to create a decision problem involving multiple selections. That is, the
relationship is in the quadrant Ⅰ
(strategically cooperative) of the figure 1.
Ⅲ Supplier-dominated Ⅰ Strategically Cooperative Ⅳ Absolutely Interdependent Ⅱ Customer-dominated Number of Suppliers Number of Customers only one only one
more than one
more than one
Figure1. Dependent natures of supplier-customer relations.
This study proposes an
interaction-oriented based approach, based on AHP methodology, to solve the semiconductor supply chain distribution
problem assuming a particular optimal
satisfaction. This approach is preceded by an analysis to defining the best potential distribution points and release quantity for upstream companies, to determine feasible distribution downstream cooperators and volume and gather extensive information on them. The proposed approach thus aims to help determine which companies among the feasible cooperators will be included in the distribution network of a semiconductor supply chain and the size of the release quantity obtained from upstream suppliers. This work emphasized to present an efficient and systematic approach for modeling the distribution behavior of the semiconductor supply chain so as to maximize overall satisfaction with the chain.
3. Results and discussions
Semiconductor supply chain modeling is a team endeavor. The AHP is one available method for creating a systematic framework for group interaction and decision-making
(Saaty 1980, 1982, 1983). Meanwhile, Dyer
and Forman (1992) demonstrate the
advantages of AHP in a group setting as follows: both tangibles and intangibles, individual values and shared values are included in an AHP-based group decision process, and group discussions are focused on objectives rather than on alternatives, being structured so that every factor relevant to the decision is considered in turn. Additionally, in structured analysis, the discussion continues until all relevant information from each individual member in the group has been considered and a consensus on decision alternatives has been reached.
In this study, the real-world application was applied to the {1-3-3-4-1} network
topology. Herein, {E0-E1-E2-E3-E4} denotes
the number of enterprises in the zero echelon (silicon material supply), first echelon
(materials fabrication), second echelon
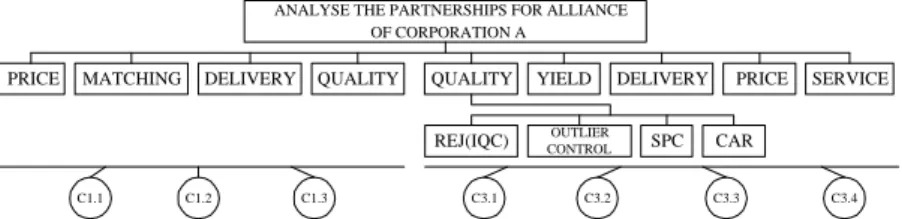
(wafer fabrication), third echelon (assembly), and fourth echelon (Test). The network topology is modified according to actual conditions. To assess the importance of these critical success factors and analyze the
performance of partnerships of the
corporation A, the success factors and cooperators for alliances are structured in a hierarchy, as shown in Figure 2. For conciseness, data acquisition of other nodes is the same with the corporation A.
According to the viewpoints of suppliers and customers in each organization, prior weights are ready for linking enterprises. Combining these two viewpoints, the integrate viewpoint is formulated using
multiplication methodology SPe(x),e+ 1(y) ×
SPe+ 1(y),e(x) (SPe(x),e+ 1(y) = the prior weight
from node x in echelon e to node y in echelon
e+ 1 and SPe+ 1(y),e(x) = the prior weight from
node y in echelon e+ 1 to node x in echelon e).
The integrated linkage weights (IW) are then
calculated and also listed in Table 1. The
integrated semiconductor supply chain
network is established using IW or IW, which
were included in the Table 1. Up to this point, the integrated network is ready for a supply chain distribution decision. Since the total quantity of the batch size of customer
demand is 1000 unites, Fig. 3 briefly demonstrates the supply chain network with
IW and IW, which are depicted by separately
placing their values with 100% out of and in brackets attached to arcs, with two network situations presented herein. Tables 2(a) and (b) present the results of the two illustrative network situations. Table 2(a) presents the results of supply chain distribution problem in situation 1 were obtained, in which customer demand is satisfied and total supplier and customer preferences are optimized. Meanwhile, Table 2(b) displays the results of the same supply chain distribution problem, since the acceptable
value of integrated linkage weight c exceeds
0.2. The results of distribution problem of
situations 1 and 2 demonstrate that nodes C1.1
and C1.3 of echelon 1 and nodes C3.1, C3.2,
and C3.3 of echelon 3 exist in both situations,
and that other nodes in echelon 2 are indwelled in both situations. In situation 2, the lower limit of acceptable value of
integrated linkage weight c is given, and
equals 0.2, that linkage weights IW0(1),1(2),
IW1(2),2(1), IW2(1),3(3), IW2(1),3(4), IW2(2),3(1),
IW2(2),3(2), IW2(2),3(4), IW2(3),3(1), IW2(3),3(3), and
IW2(3),3(4) are incompetent and will be removed from the supply chain distribution
network. Meanwhile, while Σx= 1IW0(x),1(2)
andΣx= 1~3IW2(x),3(4) are both zero, the nodes
C1.2 and C3.4 would be eliminated from this
chain, which could lead to IW2(1),3(4),
IW2(2),3(1), IW2(2),3(2), and IW3(4),4(1) losing their purpose. After limiting the lower limit of integrated linkage weight, the processing
volume of nodes C1.2 and C3.4 would be
shared individually by nodes C1.1 and C1.3
and nodes C3.1, C3.2, and C3.3 in the
distribution decision.
These results could be compared to conventional aftermaths, which only consider one preference, for research seeking cost
minimization and profit maximization.
According to these analytical outcomes, Tables 2(a) and (b) which display the above two situations, reveal that the quantities of each node for processing in the plant of itself and transporting to the downstream factory simultaneously match the supplier and customers’multi satisfactory preferences.
4. Self-evaluation for this pr oject
This project was performed following the schedule and scope proposed in proposal. This project proposed a systematic and
flexible approach to efficiently and
effectively solving the complex distribution decision problem for the supply chain environment of the semiconductor industry. Relationships are acquired by using the AHP-based technique, which enables both quantitative and qualitative factors to be included in the decision process, and models the veritably behavior of semiconductor manufacturing process by employing the
interaction-oriented technique, which
simultaneously integrates suppliers and customers’ multi-satisfactory preferences. In the future, new or potential companies could be readily included in the existing supply chain network. Accordingly, this approach can provide a feasible quality solution and can easily and expeditiously be applied to real world applications. The results of this project will be written as a technical paper
and submitted for publication in the
international journal. Refer ence
[1] Christopher, M.G., Logistics and Supply Chain Management: Strategies for Reducing Costs and Improving Services, Pitman, London, 1992. [2] Dyer, R.F. and Forman, E.H., “Group decision
support with the analytic hierarchy process,”
Decision Support Systems, Vol.8, pp.99-124, 1992.
[3] Ellram, L.M., “Supply chain management: the industrial organization perspective,”International Journal of Physical Distribution and Logistics Management, Vol.21(1), pp.13-22, 1991.
[4] Saaty, T.L., The Analytic Hierarchy Process, McGraw-Hill, New York, 1980.
[5] Saaty, T.L.,Decision making for Leaders, Lifetime Learning, New York, 1982.
[6] Saaty, T.L., “Priority Setting in Complex Problems,” IEEE Transactions on Engineering Management, Vol.30(3), pp.140-155, 1983.
5
ANALYSE THE PARTNERSHIPS FOR ALLIANCE OF CORPORATION A
PRICE MATCHING DELIVERY QUALITY QUALITY YIELD DELIVERY PRICE SERVICE CAR
OUTLIER
CONTROL SPC
REJ(IQC)
C1.1 C1.2 C1.3 C3.1 C3.2 C3.3 C3.4
Figure 2. The AHP-hierarchy for analyzing the partnerships of the corporation A.
Table 1. Linkage weights of supplier and customer viewpoints.
For upstream supplier For downstream
production/distributo r
Relationship Prior weight Relationship Prior weight
Integrate linkage weights (IW) C0.1← C1.1 1.000 C0.1→ C1.1 0.310 0.310 C0.1← C1.2 1.000 C0.1→ C1.2 0.110 0.110 C0.1← C1.3 1.000 C0.1→ C1.3 0.580 0.580 C1.1← C2.1 0.410 C1.1→ C2.1 0.250 0.103 C1.2← C2.1 0.205 C1.2→ C2.1 0.152 0.031 C1.3← C2.1 0.384 C1.3→ C2.1 0.536 0.206 C1.1← C2.2 0.235 C1.1→ C2.2 0.320 0.075 C1.2← C2.2 0.422 C1.2→ C2.2 0.422 0.178 C1.3← C2.2 0.343 C1.3→ C2.2 0.302 0.104 C1.1← C2.3 0.127 C1.1→ C2.3 0.430 0.055 C1.2← C2.3 0.221 C1.2→ C2.3 0.426 0.094 C1.3← C2.3 0.652 C1.3→ C2.3 0.162 0.106 C2.1← C3.1 0.751 C2.1→ C3.1 0.245 0.184 C2.2← C3.1 0.111 C2.2→ C3.1 0.122 0.014 C2.3← C3.1 0.138 C2.3→ C3.1 0.151 0.021 C2.1← C3.2 0.315 C2.1→ C3.2 0.239 0.075 C2.2← C3.2 0.132 C2.2→ C3.2 0.214 0.028 C2.3← C3.2 0.553 C2.3→ C3.2 0.552 0.305 C2.1← C3.3 0.250 C2.1→ C3.3 0.197 0.049 C2.2← C3.3 0.643 C2.2→ C3.3 0.420 0.270 C2.3← C3.3 0.107 C2.3→ C3.3 0.177 0.019 C2.1← C3.4 0.121 C2.1→ C3.4 0.319 0.039 C2.2← C3.4 0.276 C2.2→ C3.4 0.244 0.067 C2.3← C3.4 0.603 C2.3→ C3.4 0.120 0.072 71.2 (1.0) 1.0 (1.0) 1.0 (1.0) 1.0 (1.0) 1.0 (1.0) 4.5 (0.0) 73.1 (1.0) 5.0 (0.0) 17.8 (0.0) 7.4 (0.0) 3.6 (0.0) 11.1 (0.0) 14.2 (0.0) 21.7 (29.0) 53.0 (71.0) 25.4 (25.4) 25.0 (25.0) 49.6 (49.6) 31.0 (0.0) 58.7 (0.0) 10.3 (0.0) 23.5 (23.5) 32.4 (32.3) 44.1 (44.1) 58.0 (65.2) 11.0 (0.0) 31.0 (34.8) C0.1 C1.1 C1.2 C1.3 C2.1 C2.2 C2.3 C3.1 C3.2 C3.3 C3.4 C4.1 17.3 (0.0)
Figure 3. Complete network for situations 1 and 2.
Table 2. Results of physical distribution using the interaction-oriented approach. (a) Situation 1: subsistent relations must be maintained. (b) Situation 2: subsistent relations are not always maintained and 0.2 is set as an acceptable value.
(a) Demand (b) Demand
C1.1 C1.2 C1.3 C2.1 C2.2 C2.3 C3.1 C3.2 C3.3 C3.4 C4.1 C1.1 C1.2 C1.3 C2.1 C2.2 C2.3 C3.1 C3.2 C3.3 C3.4 C4.1 C0.1 310 110 580 C0.1 348 - 652 C1.1 137 100 73 C1.1 154 113 82 C1.2 11 65 34 C1.2 - - - C1.3 288 145 148 C1.3 323 163 166 C2.1 231 94 62 48 C2.1 338 138 - - C2.2 11 23 221 55 C2.2 - - 275 - C2.3 13 186 12 44 C2.3 - 248 - - C3.1 255 C3.1 338 C3.2 304 C3.2 386 C3.3 294 C3.3 275 Sup p ly C3.4 148 Sup p ly C3.4 - Total 310 110 580 436 310 255 255 304 294 148 1000 Total 348 - 652 477 275 248 338 386 275 - 1000