Exploring the Activity and Specificity of Gold
Nanoparticle-Bound Trypsin by Capillary Electrophoresis
with Laser-Induced Fluorescence Detection
Yu-Fen Huang, Chih-Ching Huang, and Huan-Tsung Chang*
Department of Chemistry, National Taiwan University, Taipei, Taiwan, Republic of China Received March 29, 2003. In Final Form: June 15, 2003
This paper describes the use of micellar electrokinetic chromatography (MEKC) and capillary zone electrophoresis (CZE) in conjunction with laser-induced fluorescence (LIF) detection for investigating the specificity of biocatalysis by trypsin when it is conjugated to gold nanoparticles (GNPs). In the presence of sodium dodecyl sulfate (SDS), adsorption of the tryptic fragments on GNP-trypsin and on the capillary wall is reduced. As a result, the sensitivity and resolution of electropherograms of the tryptic fragments from bovine serum albumin (BSA) is improved. MEKC-LIF measurements show clearly that the specificity of GNP-trypsin differs from that of free trypsin and that the tryptic digest of GNP-BSA is significantly different from the GNP-tryptic digest of BSA. We have used CZE-LIF to observe differences in the biocatalytic activity of trypsin and GNP-trypsin. Changes in the electropherograms provide information of the progress of digestion and indicate that the activity of GNP-trypsin is lower than that of free trypsin. The results of this study suggest that changes in the conformations and steric effects contribute to the loss of activity and changes in specificity of trypsin adsorbed on GNPs.
Introduction
Advances in nanotechnology allow the synthesis and fabrication of numerous novel nanoparticles (NPs) for different purposes, such as in electronics, as sensors, and as catalysts, because of the unique electronic, optical, and catalytic properties that result from their size.1-3These properties arise for the following reason: For a given mass of gold, the surface area increases with decreasing particle size. In addition, the selectivity and specificity of NPs toward substrates can be improved by controlling their sizes and shapes precisely and/or by modifying their surfaces.
Functional gold nanoparticles (GNPs) that are conju-gated with biomolecules such as DNA, enzymes, and antibodies have been made and demonstrated in a variety of fields, including biosensors, separation science, and catalysis.4-11Recently, GNPs conjugated with enzymes, such as pepsin and fungal protease, have been synthesized and tested, with results showing that biocatalytic activity and stability in aqueous solution is retained.10,11 The conjugation is believed to occur mainly through
interac-tions of the gold surface with thiol groups of cysteine residues and amino groups of lysine residues of the enzymes; the stability of bioconjugated GNPs is attributed to steric and Coulombic repulsions. To retain their biocatalytic activities, the three-dimensional structures of enzymes must still exist when they are bound to GNPs. This situation can be achieved by carefully modifying the GNP surface with suitable capping agents, such as citrate, and/or with spacers, such as poly(ethylene glycol).12In addition, the pH and ionic strength of the aqueous solution are important factors that affect catalytic behavior. For example, the biological activity (selectivity and digestion efficiency) of pepsin-bioconjugated GNPs remains almost the same as it is in the bulk solution at pH 3.0 when glycine is used as the capping agent.10
Numerous spectroscopic tools, such as UV-vis absorp-tion, fluorescence, Raman scattering, and IR spectroscopy, are commonly used to explore the stability and activity of bioconjugated GNPs. For example, the shifts in the so-called amide I and II bands in IR spectra of enzymes, and the π-π* band in fluorescence spectra that is due to the tryptophan residues, have been utilized to investigate adsorption, while acid-soluble products (tryptophan and tyrosine residues) have been used to determine the biocatalytic ability of bound enzymes by measuring the UV absorbance of aromatic units at 280 nm.10,11,13These techniques, however, do not provide direct information on the digestion products of NP-bound enzymes, which is information that is essential when investigating the biocatalytic activity and specificity of enzymes.
Capillary electrophoresis (CE) is a fast and efficient separation technique that can be used for the analysis of tryptic digests.14 It is a long-standing interest in our research group to study protein separation by CE in conjunction with laser-induced fluorescence (LIF) detec-* Corresponding author: Tel/fax 011-886-2-2362-1963; e-mail
(1) Shipway, A. N.; Lahav, M.; Willner, I. Adv. Mater. 2000, 12, 993-998.
(2) Vossmeyer, T.; Guse, B.; Besnard, I.; Bauer, R. E.; Mu¨llen, K.; Yasuda, A. Adv. Mater. 2002, 14, 238-242.
(3) Shiraishi, Y.; Toshima, N. Colloids Surf. A 2000, 169, 59-66. (4) Storhoff, J. J.; Elghanian, R.; Mucic, R. C.; Mirkin, C. A.; Letsinger, R. L. J. Am. Chem. Soc. 1998, 120, 1959-1964.
(5) Maxwell, D. J.; Taylor, J. R.; Nie, S. J. Am. Chem. Soc. 2002, 124, 9606-9612.
(6) Wang, J.; Xu, D.; Kawde, A.-N.; Polsky, R. Anal. Chem. 2001, 73, 5576-5581.
(7) Thanh, N. T. K.; Rosenzweig, Z. Anal. Chem. 2002, 74, 1624-1628.
(8) Zhang, C.; Zhang, Z.; Yu, B., Shi, J.; Zhang, X. Anal. Chem. 2002,
74, 96-99.
(9) Zanchet, D.; Micheel, C. M.; Parak, W. J.; Gerion, D.; Alivisatos, A. P. Nano Lett. 2001, 1, 32-35.
(10) Gole, A.; Dash, C.; Ramakrishnan, V.; Sainkar, S. R.; Mandale, A. B.; Rao, M.; Sastry, M. Langmuir 2001, 17, 1674-1679.
(11) Gole, A. Dash, C.; Soman, C.; Sainkar, S. R.; Rao, M.; Sastry, M. Bioconjugate Chem. 2001, 12, 684-690.
(12) Veiseh, M.; Zareie, M. H.; Zhang, M. Langmuir 2002, 18, 6671-6678.
(13) Keating, C. D.; Kovaleski, K. M.; Natan, M. J. J. Phys. Chem.
B 1998, 102, 9404-9413.
(14) Welder, F.; McCorquodale, E. M.; Colyer, C. L. Electrophoresis 2002, 23, 1585-1590.
10.1021/la034541o CCC: $25.00 © 2003 American Chemical Society Published on Web 07/23/2003
tion. Over the past few years, we have developed tech-niques for the analysis of proteins subjected to electroos-motic flow (EOF) by using an Nd:YAG laser with its output at 266 nm.15,16Although these methods allow the analysis of traces of proteins containing tryptophan, tyrosine, and/ or phenylalanine residues, fluorescence that is quenched by SDS and acids remains problematic.
Despite its ability to analyze traces of proteins from complicated samples, such as urine and cerebrospinal fluids, CE-LIF has not been tested for the analysis of bioconjugated NPs. In the case of using GNPs, the two main problems are fluorescence quenching and adsorption of GNPs on the capillary wall. The native fluorescence of proteins is quenched because of energy transfer between proteins (or peptides) with maximum excitation wave-lengths at ca. 340 nm and GNPs with high absorption coefficients in the UV spectral range. Adsorption of GNPs on the capillary wall causes a change in the electroosmotic flow (EOF), which leads to irreproducibility of results. Loss of resolution is another problem if the peptides are adsorbed strongly onto GNPs because this process affects their electrophoretic mobilities.
The primary goal of this work was to develop techniques for exploring the specificity and bioactivity of GNP-bound trypsin (GNP-trypsin). We have analyzed the tryptic digests of bovine serum albumin (BSA) by micellar electrokinetic chromatography (MEKC)-LIF using an Nd: YAG laser at 266 nm and explored the effect of the SDS concentration and pH on the resolution and sensitivity. The electropherograms reveal the different bioactivity and specificity of GNP-trypsin and trypsin. To provide kinetic information, we have also analyzed the tryptic digests by capillary zone electrophoresis (CZE)-LIF using a BSA-specific dye, albumin blue 580 (AB 580).
Experimental Section
Materials. SDS, proteins, and all chemicals for preparing buffers were obtained from Sigma (St Louis, MO). AB 580 was purchased from Molecular Probes (Eugene, OR). TB buffers were prepared from tris(hydroxymethyl)aminomethane (Tris) adjusted with boric acid to values of pH ranging from 8.0 to 10.0. In this paper, the molarity of TB buffer refers to that of Tris. A 10 mM stock solution of AB 580 was prepared in methanol. Solutions of BSA and trypsin were prepared in water and stored at 4 °C.
Capillary Electrophoresis Apparatus. The basic design of the separation system has been reported previously17and is described here briefly. A high-voltage power supply from Gamma High Voltage Research (Ormond Beach, FL) was used to drive electrophoresis. The entire system was enclosed in a black box with a high-voltage interlock. The high-voltage end of the separation system was housed in a plexiglass box for safety. An EPO-5000 pulsed Nd:YAG laser at 266 nm, 3000 Hz output, from Continuum (Santa Clara, CA) was used to induce intrinsic fluorescence. When AB 580 was used for kinetic studies, a 1.5-mW He-Ne laser with 594 nm output from Melles Griot (Irvine, CA) was used for excitation and a 620-nm interference filter was used to block the scattered light. In both cases, the emitted light was collected with a 10× objective (numerical aperture ) 0.25) before it reached a Hamamatsu R928 photomultiplier tube (Shizuoka-Ken, Japan). The amplified current was transferred directly through a 10-kΩ resistor to a Borwin 24-bit A/D interface at 5 Hz (JMBS Developments, Le Fontanil, France) and the data were stored in a personal computer. Fused-silica capillaries from Polymicro Technologies (Phoenix, AZ) with 75 µm i.d. and 365 µm o.d. were used for protein separations without any coating process.
Synthesis of GNPs. The preparation of 13-nm-diameter GNPs was achieved according to a reported method, described here briefly.18An aqueous solution of HAuCl4(1 mM, 250 mL) was brought to a vigorous boil with stirring in a round-bottom flask fitted with a reflux condenser, and then trisodium citrate (38.8 mM, 25 mL) was added rapidly. The solution was boiled for another 15 min, during which time the color of the solution changed from pale yellow to deep red. The solution was cooled to room temperature with continued stirring.
Formation of GNP-Trypsin and GNP-BSA. The GNP solution prepared above was diluted by a factor of 3 with a glycine buffer (75 mM, pH 9.0). Trypsin (0.1 mM, 0.5 mL) or BSA (0.1 mM, 0.5 mL) was added with stirring to a portion of the diluted solution containing the GNPs (50 mL; 50 mM glycine buffer, pH 9.0). The solution was equilibrated for 1 h before being centrifuged at 18 000 rpm for 20 min to remove the uncoordinated trypsin or BSA remaining in solution. The precipitate obtained was subjected to three repeated wash cycles involving rinsing with 50 mM glycine buffer (50 mL) and centrifuging at 18 000 rpm for 20 min. Finally, the GNP-trypsin or GNP-BSA was suspended in the glycine buffer (12.5 mL) for further experiments.
Tryptic Digestion and Peptide Separation by CE. The digestion of 5 µM BSA was carried out with 0.25 µM trypsin or GNP-trypsin (equilibrated with 0.25 µM trypsin) in the glycine buffer at 37 °C overnight. The digestion of GNP-BSA was carried out with 0.25 µM trypsin in the glycine buffer at 37 °C overnight. The tryptic digests were injected hydrodynamically into an uncoated capillary filled with 100 mM TB buffers containing 0-80 mM SDS, pH 8.0, at a height of 22.5 cm for 10 s, and the separation was conducted at 15 kV. For the kinetic studies, the digestion of 5 µM BSA was carried out with 0.25 µM trypsin or GNP-trypsin in the glycine buffer at 37 °C for a period of time ranging from 1 min to overnight. The digests or supernatant of the tryptic digests were injected hydrodynamically into an uncoated capillary filled with 100 mM TB buffer containing 1 µM AB 580 at a height of 22.5 cm for 10 s, and the separations were preformed at 15 kV.
Spectroscopic Measurement. To investigate the effect of SDS on the fluorescence of tryptic and GNP-tryptic digests, we collected fluorescence spectra using a Jasco FP-6200 spectrometer (Tokyo, Japan) with excitation at 280 nm. To investigate the change in the surface plasmon resonance (SPR) of the GNPs, we took UV-vis spectra on a Jasco spectrophotometer. To charac-terize the secondary structures of proteins in the GNP-trypsin bioconjugates, we collected FTIR spectra on a Jasco Fourier transform infrared spectrometer. The samples were prepared by drop-drying BSA or GNP-BSA on a KBr cell.
Results and Discussion
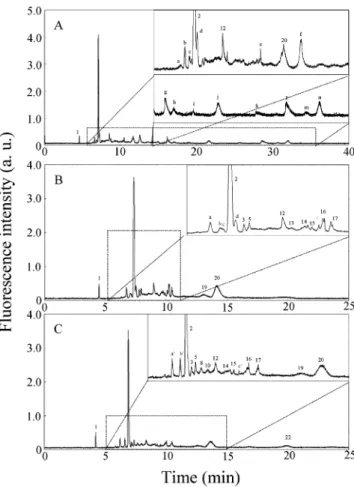
Effect of Background Electrolyte on Separation. The role that pH plays in the analyses of proteins and peptides by CE-LIF with UV lasers has been recognized for a number of years.19In view of the intrinsic fluorescence of proteins and peptides, conducting analyses at a pH of ca. 10.0 generally is preferred. The role of pH in deter-mining resolution, however, is more complicated. On one hand, adsorption of proteins and peptides on the capillary wall is lessened at high pHswhen they are both negatively chargedsbecause of Coulombic repulsion. On the other hand, it is easier to achieve high resolution in capillary zone electrophoresis (CZE) at values of pH close to the values of pI of proteins and peptides, but generally this situation requires a deactivated capillary. On the basis of these considerations, CZE-LIF was tested for the sepa-ration of tryptic digests of BSA at values of pH of 8.0, 9.0, and 10.0. A loss of resolution was observed at pH 10.0, while peak broadening occurred at pH 8.0 with only three peaks being detected. As shown in Figure 1A, the best result, in terms of resolution, was at pH 9.0. The number (15) Tseng, W.-L.; Chang, H.-T. Anal. Chem. 2000, 72, 4805-4811.
(16) Tseng, W.-L.; Lin, Y.-W.; Chang, H.-T. Anal. Chem. 2002, 74, 4828-4834.
(17) Chen, H.-S.; Chang, H.-T. Anal. Chem. 1999, 71, 2033-2036.
(18) Grabar, K. C.; Freeman, R. G.; Hommer, M. B.; Natan, M. J.
Anal. Chem. 1995, 67, 735-743.
(19) Tseng, W.-L.; Chang, H.-T. J. Chromatogr. A 2001, 924, 93-101.
of peaks, however, was less than the total of 26 expected, indicating that further improvement in resolution was required. Two broad peak profiles at the migration times around 10 and 17 min indicate that adsorption of the fragments also took place.
To further improve resolution, we tested the possibility of using MEKC-LIF, a technique in which the background electrolytes contain SDS micelles. In the presence of these micelles, the separation is preferred at pH 8.0 rather than pH 9.0. This preference is mainly because the partitioning into SDS micelles of the tryptic fragments is greater at lower pH because of their lower negative-charge density. Several broad peaks and asymmetric peak profiles (not shown) indicated that adsorption is problematic at low SDS concentrations (<40 mM). With increasing SDS concentration, the peaks corresponding to the tryptic fragments became sharper and the migration times for some of the tryptic fragments became longer, thereby further improving the resolution. The separation was most successful at 60 mM SDS, as is shown in Figure 1B. The resolution did not improve with further increases in SDS concentration, which instead caused instability of the baseline and irreproducibility of results, mainly because of problems associated with the fluorescent background (impurities from SDS) and Joule heating. It is important to note that SDS caused intrinsic fluorescence quenching of proteins such as BSA but not, or only slightly, of the tryptic fragments. The existence of this phenomenon is supported by the observation that the fluorescence
intensities of several resolved tryptic fragments (such as peaks 2, 5, and 12 in Figure 1B) remained almost constant at different SDS concentrations. This feature suggests that lack of interference is an advantage of conducting peptide analyses by this method, since proteins and enzymes are not detectable because of quenching by SDS. Specificity of GNP-Trypsin and Trypsin. The developed MEKC-LIF method addressed above was applied to the analysis of GNP-tryptic digests of BSA. The electropherogram in Figure 2A displays several new peaks, marked a-n, but it lacks the peaks 3-11 and 13-19 that were observed in Figure 1B. This result suggests that the specificity of GNP-trypsin is different from that of trypsin. A second explanation of this observation might be due to interactions of the GNPs with the capillary wall and with the tryptic fragments. To support these hy-potheses, we conducted a tryptic digestion of BSA using a mixture composed of both free trypsin and GNP-trypsin. The electropherogram shown in Figure 2B differs from those shown in either Figure 1B (trypsin alone) or Figure 2A (GNP-trypsin alone), with some peptide fragments appearing to be formed from digestion by free trypsin and others by GNP-trypsin. To minimize the effect that GNPs might have on the resolution of the separation, we injected the sample after centrifugation, and the subsequent electropherogram is shown in Figure 2C. The appearance of peaks 8 and 10 after centrifugation indicates that the corresponding tryptic fragments were likely to have been desorbed from the GNP-trypsin by this process. On the other hand, peaks c and d disappeared after centrifugation,
Figure 1. Capillary electropherograms displaying the
separa-tion of tryptic digests of BSA (A) in 100 mM TB (pH 9.0) and (B) in 100 mM TB (pH 8.0) containing 60 mM SDS and detected with an Nd:YAG pulsed laser. Numbers denote different tryptic fragments. Conditions: capillary total length ) 40 cm; effective length ) 30 cm; hydrodynamic injection height of 22.5 cm for 10 s; separation voltage 15 kV. The peak numbers may not represent the same peptide fragments in the two electrophero-grams.
Figure 2. Electropherograms of (A) GNP-tryptic digest of BSA,
(B) tryptic and GNP-tryptic digests of BSA, (C) GNP-tryptic digest of BSA after centrifugation. Letters denote the tryptic fragments obtained when only the GNP-trypsin was used. Conditions: separation buffer 100 mM TB, pH 8.0, containing 60 mM SDS. Other conditions are the same as those in Figure 1.
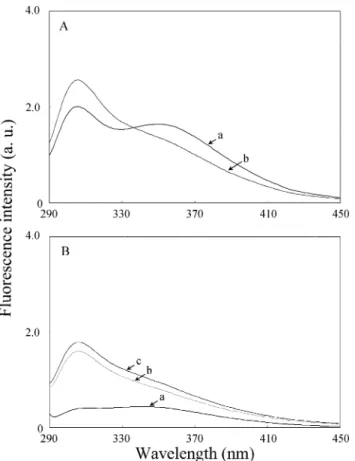
indicating that these tryptic fragments might have strong interactions with the GNP-trypsin. Apparently, the dif-ferent electropherogram patterns shown in Figures 1B and 2A,C indicate that the specificity of GNP-trypsin is different from that of trypsin, presumably because of the different conformations of the enzymes when immobilized. To investigate the impact of SDS on the sensitivity of detection by fluorescence, we added SDS to the tryptic digest. Figure 3A show that two bands (in curve a) with wavelength maxima at 308 and 350 nm in the emission spectrum of the tryptic digest are transformed into one band with a shoulder (in curve b) in the presence of 60 mM SDS. The results reveal that interactions take place to some extent between the tryptic fragments and SDS micelles. The increase in the fluorescence intensity around 308 nm indicates the advantage of analyzing peptides by MEKC-LIF. Note that the maximum fluorescence wave-length of BSA has been shifted from 338 to 310 nm and that the intensity has decreased by a factor of 1.4 under these conditions. To show that fluorescence quenching is caused by the GNPs and that SDS plays a role in desorbing the tryptic fragments from the GNPs, we collected the fluorescence spectra of the GNP-tryptic digests of BSA in the absence and presence of 60 mM SDS. Figure 3B shows that the fluorescence intensity of the tryptic fragments around 308 nm is very weak (curve a), which supports our belief that energy transfer occurs between GNPs and the tryptic fragments. This result also confirms that the tryptic fragments are adsorbed on the surface of GNP-trypsin in the absence of SDS. The fluorescence intensity of the supernatant at ca. 308 nm increases dramatically (curve b) in the presence of SDS, which suggests that the tryptic fragments are easily separated from GNP-trypsin by
simple centrifugation in the presence of SDS. This observation suggests that some of the peptides adsorb physically (weakly) on the surface of the GNP-trypsin. By comparison, the fluorescence increased (curve c) when SDS was added to the digest prior to centrifugation, which indicates that some of the peptides might adsorb strongly. This result suggests that adding SDS is an effective method for the recovery of peptides bound to GNP-trypsin and supports our reasoning discussed above (Figure 2). Next we investigated the digestion of GNP-BSA with trypsin under the same conditions. Figure 4A displays an electropherogram with only one peak, which is a situation much different from the results shown in Figures 1B and 2. It is important to note that the peak does not correspond to either GNP-BSA or to BSA. Similar results were found also in the cases of GNP-carbonic anhydrase, GNP-β-casein, and other systems. Aggregation of the GNPs is not a reason for this result, which is confirmed by the observation that no change occurred in the SPR band of the GNPs around 519 nm. Indeed, we have found that the GNPs are stable over a broad range of pH values (6.0-10.0) and at higher ionic strengths (>100 mM) in the presence of BSA. The one peak detected suggests that most of the active sites are not available for trypsin once BSA is adsorbed on the GNPs. This hypothesis is supported by the fact that BSA contains 35 cysteine residues and 60 lysine residues that are believed to be able to form covalent bonds to the GNPs. We conducted IR measurements to investigate the interactions between BSA and the GNPs. The feature at ca. 3250 cm-1in the FTIR spectrum shown in Figure 4B arises from the N-H stretching vibration mode in the BSA molecules. Figure 4C shows that this band becomes broad in GNP-BSA, which indicates that binding occurs of the amino groups of BSA to the GNPs.
Figure 3. (A) Fluorescence spectra of the tryptic digests of
BSA in the absence (curve a) and presence (curve b) of 60 mM SDS. (B) Fluorescence spectra of the GNP-tryptic digests of BSA (curve a) and of the supernatant in the presence of 60 mM SDS that was added after (curve b) and before (curve c) centrifugation.
Figure 4. (A) Electropherogram of tryptic digests of
GNP-BSA. The peak is due to a tryptic fragment. Conditions are the same as those in Figure 2. (B) FTIR spectrum of BSA. (C) FTIR spectrum of GNP-BSA.
The bands at ca. 1500-1700 cm-1(amide bands) are broad, which shows that changes in the structure of BSA occur once it is adsorbed on the GNPs.
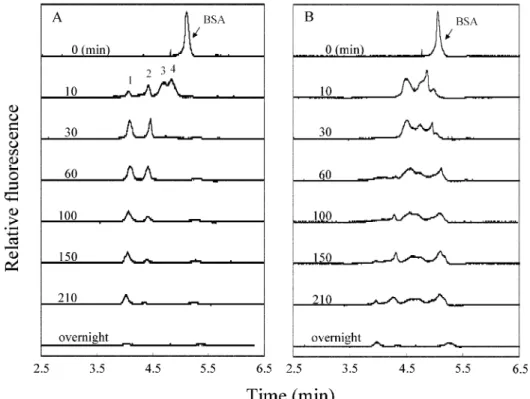
Kinetics. Because SDS and/or GNPs cause quenching of the intrinsic fluorescence of BSA, the conditions used above are not suitable for kinetic studies. Thus, we developed a CZE-LIF technique that uses no SDS in the background electrolytes by using AB 580, a highly selective dye for BSA, to label BSA and an He-Ne laser at 594 nm to excite the BSA-AB 580 complex. AB 580 alone is nonfluorescent, but it is strongly fluorescent once it binds to BSA.20,21 Figure 5 shows the different peak profiles observed during the course of the reactions (times between 0 and 12 h) when trypsin and GNP-trypsin were used to digest BSA. The peak corresponding to BSA disappeared within 10 min when trypsin was used, but some BSA remained when GNP-trypsin was used, a situation that confirms that the activity of trypsin is higher than that of GNP-trypsin. On the basis of changes in the peak height of BSA, we estimate that the digestion efficiency of free trypsin is about 39.8% in 1 min, which is much higher than that of GNP-trypsin (less than 1.0%). The peak corresponding to BSA and peaks 1-4 were still observed after digestion overnight with GNP-trypsin, which indi-cates clearly that its activity is lower than that of free trypsin. There is also evidence that shows the differences in the progress of digestion. Four tryptic fragments and two (or three) GNP-tryptic fragments, respectively, bind to AB 580 after 10 min of digestion. Peak 1 appeared within
10 min and its intensity increased with further reaction time up to 60 min when trypsin was used, while it started to appear only after 60 min when GNP-trypsin was used. The increase in the intensity of peak 1 correlates with the decrease in the intensity of peaks 3 and 4 in the course of 30 min, which indicates that the tryptic fragment corresponding to peak 1 is likely to be digested from fragments 3 and 4. Again, we suggest that the lower activity of GNP-trypsin relative to trypsin might be attributable to changes in protein conformation and/or steric effects.
Conclusions
We have described an MEKC-LIF method for exploring, for the first time, the biocatalytic activity and specificity of bioconjugated GNPs. In this study, we have found that adding SDS to the background electrolyte is extremely useful because the tryptic fragments desorb readily from the GNPs and fluoresce strongly in the presence of SDS micelles. The MEKC-LIF and CZE-LIF measurements show clearly that GNP-trypsin and trypsin possess different specificity, with the former having lower activity mainly because of changes in the enzyme’s conformation. Although we used an inexpensive UV-pulsed laser in this study, the reported method can easily be applied to the investigation of the bioactivity and specificity of biocon-jugated NPs using any commercial CE instruments with UV-vis light sources.
Acknowledgment. This work was supported by the National Science Council of Taiwan, the Republic of China (NSC 91-2113-M-002-052 and NSC 91-2120-M-002-001). LA034541O
(20) Kessler, M. A.; Meinitzer, A.; Wolfbeis, O. S. Anal. Biochem. 1997, 248, 180-182.
(21) Tseng, W.-L.; Chiu, T.-C.; Weng, J.-M.; Chang, H.-T. J. Liq.
Chromatogr. Relat. Technol. 2001, 24, 2971-2982.
Figure 5. Electropherograms of (A) tryptic and (B) GNP-tryptic digests of BSA obtained by CZE-LIF with an He-Ne laser. The
![TraditionalMLCalgorithmsmainlytacklethebatchMLCproblem,wheretheinputdataarepresentedinabatch[24,28].Nevertheless,inmanyMLCapplicationssuchase-mailcategorization[22],multi-labelexamplesarriveasastream.Onlineanalysisistherefore dimensionreducermotivatedbyma](data:image/gif;base64,R0lGODlhAQABAIAAAP///wAAACH5BAEAAAAALAAAAAABAAEAAAICRAEAOw==)