行政院國家科學委員會專題研究計畫 成果報告
遺傳及耳石微化學標記在兩側洄游型及瀕危經濟性魚類族
群管理的應用(3/3)
研究成果報告(完整版)
計 畫 類 別 : 個別型 計 畫 編 號 : NSC 95-2313-B-002-016- 執 行 期 間 : 95 年 08 月 01 日至 96 年 09 月 30 日 執 行 單 位 : 國立臺灣大學漁業科學研究所 計 畫 主 持 人 : 曾萬年 計畫參與人員: 教授:曾萬年 助理教授:蕭仁傑 研究助技師:Yoshiyuki Iizuka 報 告 附 件 : 國際合作計畫研究心得報告 處 理 方 式 : 本計畫可公開查詢中 華 民 國 96 年 09 月 30 日
PROGRAM ON MUTUAL FUNDS FOR THE SCIENTIFIC CO-OPERATION OF REPUBLIC OF LITHUANIA AND REPUBLIC OF LATVIA WITH
REPUBLIC OF CHINA (TAIWAN)
FINAL
REPORT
On
Application of Genetic and Microchemical Markers as Implements for Diadromous
and Endangered Commercial Fish Species Populations Management
Submitted to: National Science Council, Bonn office, Bonn, Germany National Science Council, Taipei, Taiwan, Republic of China Department of Science and Higher Education under the Ministry of Education and Science, Vilnius, Lithuania
Department of Higher Education & Science of the Ministry of Education and Science, Riga, Latvia
Submitted by:
Dr. Habil. Corresponding member of the Lithuanian Academy of Sciences Mečislovas ŽALAKEVIČIUS
Instute of Ecology of Vilnius University Akademijos 2, LT-08412 Vilnius 21, Lithuania Tel/Fax: +370 5 272 92 57, e-mail: [email protected]
Prof. Dr. Wann-Nian TZENG
Institute of Fisheries Science, College of Life Science, National Taiwan University, Taipei, Taiwan 106, Republic of China
Tel: 886-2-23639570, Fax: 886-2-23636837, E-mail: [email protected] Prof. Habil. Dr. Isaak RASHAL
Institute of Biology, University of Latvia Miera str. 3, Salaspils, LV-2169, Latvia
Tel: +371 7945435 (office), +371 9516935, Fax:+371 7944986, E-mail: [email protected]
GMM. Final report (2004-2007)
APPLICATION OF GENETIC AND MICROCHEMICAL MARKERS AS IMPLEMENTS FOR DIADROMOUS AND ENDANGERED COMMERCIAL FISH SPECIES POPULATIONS MANAGEMENT
YEAR 2004 - 2007
The report was completed by:
Professor Wann Nian Tzeng
Institute of Fisheries Sciences, College of Life Science, National Taiwan University,
Taipei, 10617, Taiwan, ROC
Dr. Jen Chieh Shiao
Institute of Zoology, Academia Sinica, Nankang, Taipei, 11529, Taiwan, ROC
Dr. Yoshiyuki Iizuka
Institute of Earth Sciences, Academia Sinica, Nankang, Taipei, 11529, Taiwan, ROC
Prof. Isaak Rashal, Dr. Ilze Veinberga
Institute of Biology, University of Latvia
Maris Plikshs, Atis Minde
Latvian Fish Resource Agency, Latvia
Dr. Dalius Butkauskas, Dr. L.Ložys
Institute of Ecology of Vilnius University, Lithuania
CONTENT
I. GENERAL PART
1.1 Summary of GMM project
1.2 Objectives and Tasks within GMM Project
1.3 Introduction
1.4 Fish collection and sampling sites
II. DESCRIPTION OF THE RESULTS
2.1 Microchemical analysis of fish otoliths
2.2 Microchemical analysis of fish otoliths. Appendixes
2.3 Description of the genetic analysis results
2.4 General conclusions and reccomendations for studied fish species management 3 3 4 6 15 23 23 53 96 133
GMM. Final report (2004-2007) General part
APPLICATION OF GENETIC AND MICROCHEMICAL MARKERS AS IMPLEMENTS FOR DIADROMOUS AND ENDANGERED COMMERCIAL FISH SPECIES POPULATIONS MANAGEMENT
YEAR (2004 - 2007)
I. GENERAL PART
1.1 Summary of GMM project
This research project is aimed at demonstrating the effective use of the genetic and microchemical markers analysis as a fundamental scientific basis upon which advice could be given to the interested stakeholders: fisheries managers, conservationists, fishermen, socio-economists and etc. on a local, national or international scale. By analyzing microsatellite DNA in the tissues and Sr/Ca ratio in the otoliths of fish, chosen as model species, i.e. the facultatively catadromous eel (Anquilla anquilla), as well as the freshwater and the amphidromous-like behaving pikeperch (Sander lucioperca) and the perch (Perca fluviatilis), the project results should provide a set of answers to crucial questions of the stock management. Problems such as absence of knowledge of natural recruitment, stocking effectiveness of the endangered European eel and general lack of understanding of the genetic structure, a spatial and temporal migratory behavior of the amphidromous perch and pikeperch in the region impede management of the species. The project should assess:
-the population genetic structure and stock boundaries of the targeted fish species in the South-Eastern Baltic Sea region based on the investigations into polymorphic microsatellite loci;
-migration patterns of the targeted fish species between fresh and brackish water bodies, as well as the eel recruitment and stocking success by means of microchemical otolith analysis.
Cooperation between specialists from Lithuania, Latvia and Taiwan, R.O.C. should lead to an efficient combination of facilities, knowledge and expertise, which are adequate to obtain new important and reliable results in the field of diadromous fish population management, i.e. genetic structuring and tracing of the migratory behavior. One of the most important objectives of the project is to provide a good opportunity to transfer knowledge from the high level research centre of Taiwan, R.O.C. to those in the Baltic countries. Joint efforts and knowledge will lead to an innovative approach to management-related problems and expand our understanding of life history, behavior and the population structure of fish species.
The implementation of the project is expected to contribute to integration and promotion of cooperation between the regions. The project will be implemented in accordance with the relevant international and national legal and ethical requirements.
GMM. Final report (2004-2007). General part
1.2 Objectives and Tasks within GMM Project
Many interpretations of phylogeographical and population genetic studies of fish suffer from uncertainty arising from artificial stocking or due to lack of information about the migrating behaviour of species of interest. Successful fish stock management is not effective without a complete understanding of the population genetic structure, stock boundaries and spatial and temporal migratory patterns. In recent years, advances in analytical techniques have led to the use of otolith microchemistry as an aid to stock discrimination in fishes. Genetic markers are widely used as implements for acknowledging potential stock differences. The recent development of such investigation methods as the assay of microsatellites provided us with the opportunity to evaluate relationships between populations and subpopulations. By combining two modern techniques, i.e. the otolith microchemical and microsatellite DNA analysis, we intend to demonstrate the effectiveness of such an approach to the diadromous fish stocks management. The techniques applied will present an innovate approach to address the management-related problems. Therefore, combining the microchemical otolith analyses with the genetic analyses will enable us to expand our knowledge of the migration pattern and population/subpopulation-related evaluation of diadromous fish.
The purpose of the present research proposal is to demonstrate benefits of the presented techniques in outlining guidelines for commercially important fish species management based on the data derived from the investigations into the subpopulations genetic structure and seasonal migration behaviour. During the GMM project implementation the catadromous1 eel (Anquilla anquilla), as well as both freshwater and amphidromous2-like behaving subpopulations of the pikeperch (Sander lucioperca) and perch (Perca fluviatilis) will be investigated as model species to demonstrate effectiveness of our approach.
The main research objectives of the project are as follows:
1. Evaluation of the population genetic structure and stock boundaries of the targeted fish species in the South-Eastern Baltic Sea region based on the investigations into polymorphic microsatellite loci.
2. Estimation of migration patterns of the targeted fish species between fresh and brackish water bodies, as well as eel recruitment and stocking success by means of the microchemical otolith analysis.
To achieve the above–stated objectives of the proposed project a number of tasks are defined: • to collect field material from the South-Eastern part of the Baltic Sea (coastal fresh
and brackish waters of Latvia and Lithuania) for both the genetic and microchemical analysis. Samples of the targeted species representing spawning and summering (summering in different water sites in terms of water salinity) should be collected during the first and second years of research;
• to screen available microsatellite primers for assessing the genetic structure of the pikeperch and perch originating from Latvian and Lithuanian coastal water areas of the Baltic Sea. To identify species-specific microsatellite primers for the eel based on screening the primers developed for taxonomically related species;
• to evaluate the genetic structure of targeted species based on the microsatellites assay; • to perform the microchemical analysis of the Sr/Ca ratio of the material collected to
estimate spatial and temporal migratory patterns of the perch and pikeperch, as well as
1
GMM. Final report (2004-2007). General part
• to evaluate the eel natural recruitment and stocking success; • to integrate the data obtained and to determine the following:
-whether subpopulations of the pikeperch and perch from Latvia and Lithuania are isolated by means of the distance between the inhabited water areas (level of genetic isolation);
-whether the amphidromous and non-migrating pikeperch and perch subpopulations have different spawning sites and possess significant genetic differences;
-whether the amphidromous Percids migrate yearly;
-whether the catadromous eel exhibits features of amphidromous behaviour;
-whether the stocked or naturally recruited eel prevail in the coastal waterbodies of Lithuania and Latvia;
-whether the stocked and recruited eel (if any) has detectible genetic differences. • Summing up the data obtained to prepare recommendations for fisheries managers,
GMM. Final report (2004-2007). General part
1.3 Introduction
Perch and pikeperch belong to the freshwater fish family Percidae (Collette et al., 1977). The pikeperch and the perch are common in the inland waters of Europe and are primary freshwater fish species with a long evolutionary history in freshwaters. (Collette et al., 1977; Lehtonen et al., 1996). However, they also live in brackish waters (Karås, 1996; Lehtonen et al. 1996) and both have some tolerances to water salinity. As the result in some localities both species inhabit brackish water sites instead freshwater. Seasonal amphidromous migrations between fresh and brackish waters in both species are documented as well (Skora, 1996, Gyllensten et al., 1985). Amphidromous migrations are typical behavior for Percids inhabiting the South-Eastern part of the Baltic Sea. However, only some part of Percids population migrates for a summer to the Sea. In Lithuania, each year, after over-wintering and spawning in the Curonian Lagoon, some part of populations of these typical fresh water fish species migrates to the brackish coastal waters of the Baltic Sea, while in the autumn returns back to the Lagoon. It is proved that Percids benefit faster growth rates do to such migrations to the brackish environment (Ložys, 2004). However, currently there is a general lack of information on Percids migrations in the South-Eastern region of the Baltic Sea basin. As a result, without exact answers to the population structure or a spatial and temporal migratory pattern, management of the valuable Percid fish species is based only on the unconfirmed hypothesis. In Lithuania coastal waters Percids fishery is not quoted assuming that coastal fishermen exploit the same populations as in the Curonian Lagoon. Fisheries managers and conservationists on a local scale (in Lithuania) support the hypothesis that pikeperch spawning in the Eastern part of the freshwater Curonian Lagoon (the Nemunas River delta) is subpopulation “not migrating” to the Baltic Sea; whereas pikeperch spawning in northern part of the Lagoon (in quite close distance from the Sea) migrates for summer to the brackish Baltic Sea. Similar behavior of Percids was observed in brackish Vistula Lagoon (territorial waters of Kaliningrad region (Russia) and Poland): pikeperch spawn in the Lagoon, whereas a greater part of the population migrates to the Baltic Sea for a summer after spawning. Russia, Lithuania and Latvia managers assume that in the Baltic Sea they exploit the pikeperch originating from the Vistula and Curonian Lagoon, or even from the Gulf of Riga. However, exploitation of the mixed stocks (Russian-Lithuanian-Latvian) can not be denied, since Lehtonen (1983) surveying conventionally tagged pikeperch populations demonstrated that pikeperch migration distances could reach as many as 200 km. To sum up the Percids management in the South-Eastern part of the Baltic Sea is based on the unconfirmed hypothesis. The definition of the population genetic structure of the perch and the pikeperch and their temporal and spatial migration patterns could serve the improvement of sustainable exploitation and management of this fish stocks in the coastal waters of the Baltic Sea and the adjusted freshwater basins. The perch and the pikeperch are one the most valuable fish species and as a result their landings determine a large part of fishermen incomes in the region. Landings of both Percids in the Curonian Lagoon are rather stabil (Figs.1-2), however landing trend of perch in Lithuania coastal waters raise concern. Pikeperch landings during the last two years are also very small. An improper approach in fisheries management (absence of fishing limits in coastal waters) could cause the “migrating” Percid stock crash in the coastal waters of the Baltic Sea as it happened to the amphidromous-behaving bream (Abramis brama) subpopulation in the coastal waters of Lithuania in the 1990s after coastal trawl fishery on bream was set up. Therefore, the knowledge obtained within GMM project should support the Percid fisheries management by knowledge of primary importance.
GMM. Final report (2004-2007). General part Curonian Lagoon 0 20 40 60 80 100 120 1994 1995 1996 1997 1998 1999 2000 2001 2002 2003 2004 2005 in t o n e s Baltic Sea 0 10 20 30 40 50 60 1994 1995 1996 1997 1998 1999 2000 2001 2002 2003 2004 2005 in tones
1 Fig. Pikeperch landings in the Curonian Lagoon and Baltic Sea, Lithuania during 1994-2005
GMM. Final report (2004-2007). General part Curonian Lagoon 0 10 20 30 40 50 60 1999 2000 2001 2002 2003 2004 2004 2005 in t o n e s Baltic Sea 0 0.5 1 1.5 2 2.5 3 3.5 1999 2000 2001 2002 2003 2004 2004 2005 in t o n e s
2 Fig. Perch landings in the Curonian Lagoon and Baltic Sea, Lithuania during 1999-2005
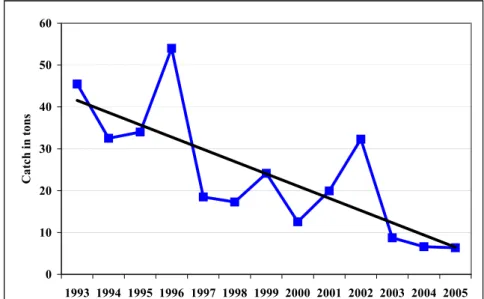
In Latvia pikeperch is important commercial species with high market price around 3,5 USD per kg for fresh fish. Pikeperch are caught mainly in coastal waters of Gulf of Riga where landings make more than 90 % from total annual catches. Pikeperch is fished mainly with fykenets. Catches in other types of gears are insignificant. The great interest of fishermen has resulted in overfishing of this species and significant decrease in pikeperch landings not only in Latvian part of Riga Gulf (Fig. 3), but also in Estonian waters (Ojaveer et al 2003). The landings have decreased from around 45 tons in early 90’s to just 6 tons in 2004 and 2005 that is more than 10 times less. The stocking of pikeperch programme in the Daugava River and adjusted freshwater basins has been implemented since 1993. Annually 200-300 thousand one summer old specimens has been released near to Daugava River mouth (1993-1995) or in Bullupe and Kisezers (1996-2005). However the amounts of artificially reproduced and released juveniles as it can be seen are insufficient to maintain the stock in high fishing effort situation. Hence, strong additional measures are needed to ensure pikeperch stock recovery.
GMM. Final report (2004-2007). General part
However it is essential to know the structure of the stock for elaboration of any effective stock management and recovery plan. Previous tagging experiments together with results of microchemical and genetical analyses provided by this GMM project will provide the necessary knowledge for elaboration of pikeperch stock protection measures.
0 10 20 30 40 50 60 1993 1994 1995 1996 1997 1998 1999 2000 2001 2002 2003 2004 2005 Ca tc h in ton s
Fig. 3. Pikeperch catch in tones of in Latvian coastal waters of Riga Gulf in 1993-2005
In Latvia perch is one of the most abundant fish species in the coastal waters of Gulf of Riga and therefore has great importance also in coastal fisheries. Its market price is not as high as for eel and pikeperch but it has tendency to increase and presently is around 1USD per kg. The most part (over 80 %) of annual perch landings come from Riga Gulf, where it is fished mainly by fykenets. Annual perch landings in the Riga Gulf have been relatively stable since early 90’s (Fig. 4) and are around 30-40 tons. The stock structure of perch in Riga Gulf is unknown. In previous years a tagging experiment was carried out which ended without any significant result due to extremely low number of recaptured fish. There still are several hypotheses about perch population structure and possible spawning in the coastal zone that cannot be proved or denied without genetical analyses and otolyth microchemistry analyses performed in this GMM project. Presently the fishing pressure on perch is relatively small and annual landing sizes depend more on perch yearclass strength. However in the situation when abundance of other commercially important fish decreases the importance and share of perch fisheries will increase. Therefore good knowledge about perch stock structure is vital for effective stock management.
GMM. Final report (2004-2007). General part 0 10 20 30 40 50 60 1993 1994 1995 1996 1997 1998 1999 2000 2001 2002 2003 2004 2005 Ca tc h in ton s
Fig. 4. Perch catch in tones in Latvian coastal waters of Riga Gulf in 1993-2005
Eels are exploited in most European countries, as well as in Lithuania and therefore are important not only as a natural asset but also as an economic resource for European fishermen. Eel landings in the Curonian Lagoon, the main are for eel fishery in Lithuania, demonstrates very negative decrease drends as overall in the rest Europe. Some positive landing trends during the last decade in the coastal waters is caused by increase in fishing efforts, but not by improving of stock status (Fig. 5).
Curonian Lagoon 0 20 40 60 80 100 120 197 5 1977 197 9 1981 198 3 1985 198 7 1989 1991 1993 1995 1997 1999 2001 2003 2005 in tones
GMM. Final report (2004-2007). General part Baltic Sea 0 0.1 0.2 0.3 0.4 0.5 0.6 0.7 1995 1996 1997 1998 1999 2000 2001 2002 2003 2004 2005 in tone s
5 Fig. Eel landings in the Curonian Lagoon (during 1975-2005) and Baltic Sea (during 1995-2005), Lithuania
Eel in Latvia is one of most expensive fishes in market today as the price per kg is above 17 USD for fresh eel and twice as high for smoked eel. This is why coastal fishermen are very interested in eel fishery. Despite that eel catches in Latvian coastal waters are small comparing with other Baltic Sea countries. Eel fishing is usually done with different fykenets. Longlines are used only in small scale fishery by some fishermen. Specialised eel fykenets are used only in limited numbers, because there is always significant amount of undersized fishes of different species bycatch in these fishing gears. Although eels are caught along all Latvian coast line, significant landings occur only in Riga Gulf and usually make more than 80% of total eel catches. Usually annual European eel landings are somewhere around 1.5 – 2 tons. The biggest landings were recorded in 2005 (Fig. 6) where they reached almost 3.5 tons in Riga Gulf. The reasons of such significant increase trend in the Gulf of Riga that it is opposite to general stock development trend of European eel are not clear. However it can be speculated that one reason of such increase is determined by improvement of landing reporting by fishermen. 0 0,5 1 1,5 2 2,5 3 3,5 4 C atch in tons
GMM. Final report (2004-2007). General part
Fig. 6. Catch in tones of European eel in Latvian coastal waters of Riga Gulf in 1993-2005
In Latvian inland waters the first official restocking of glass eel and young yellow ell were carried out in 1927 in the lake Odzes. More regularly eel restocking has been performed during 1960-1988 when were released 30.1 millions glass eels in 51 lakes (Annon, 2005). Since 1990 eel restocking is recorded only three times. Till 1990’ies the restocking was made by state but in recent decades - by private enterprises e.g. fishing rights/lakes leaseholder. In all cases stocking material was imported from the France.
Restocking was aimed to improve the fishing possibilities in given lake. Therefore all release was done in lakes which outlets were equipped with eel traps or so called “eel weir”. The eel weirs covered practically all the outlet for all escapements during sea dwelling migrations. Although all lakes are situated in the midland of Latvia via rivers and its branches lakes are connected to the sea. However, downstream migration of eel additionally to eel weirs is limited by hydroelectric power station dams. Particularly since beginning of 1990’ies, when approximately 150 small hydroelectric power stations have been built on small rivers (12 of which are the new), it result that in some cases up to 7 dams can restrict eel downstream migrations. It should be mentioned that these stations are not equipped with eel ladders.
It is considered that eel catches in inland waters are mainly based on restocked eel because the upstream migrations are restricted also by above mentioned obstacles (Fig. 7).
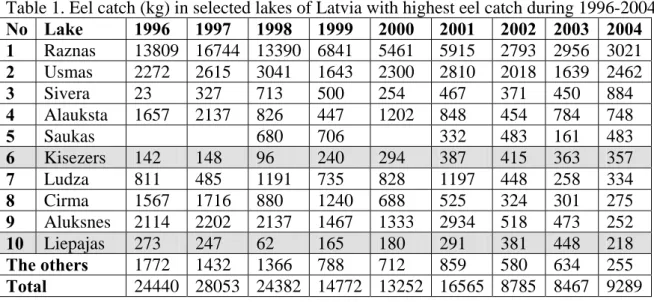
Recently in the inland waters eel catches are reported in 16 lakes belonging to 3 river basins. Only 2 of these lakes are accessible for diadromous fish e.g. Liepajas and Kisezers (ICES, 2006). The last one is located near the Riga city and close to southern part of the Gulf of Riga. Historically there was no eel restocking in these lakes and it is assumed that catch in this lakes are based on wild stock. Although it is observed decrease of eel landings in the inland waters of Latvia in the Liepaja Lake and Kizezers the catches are almost stable (Table 1).
Table 1. Eel catch (kg) in selected lakes of Latvia with highest eel catch during 1996-2004
No Lake 1996 1997 1998 1999 2000 2001 2002 2003 2004 1 Raznas 13809 16744 13390 6841 5461 5915 2793 2956 3021 2 Usmas 2272 2615 3041 1643 2300 2810 2018 1639 2462 3 Sivera 23 327 713 500 254 467 371 450 884 4 Alauksta 1657 2137 826 447 1202 848 454 784 748 5 Saukas 680 706 332 483 161 483 6 Kisezers 142 148 96 240 294 387 415 363 357 7 Ludza 811 485 1191 735 828 1197 448 258 334 8 Cirma 1567 1716 880 1240 688 525 324 301 275 9 Aluksnes 2114 2202 2137 1467 1333 2934 518 473 252 10 Liepajas 273 247 62 165 180 291 381 448 218 The others 1772 1432 1366 788 712 859 580 634 255 Total 24440 28053 24382 14772 13252 16565 8785 8467 9289
GMM. Final report (2004-2007). General part 0 20 40 60 80 100 120 19 20 19 25 19 30 19 35 19 40 19 45 19 50 19 55 19 60 19 65 19 70 19 75 19 80 19 85 19 90 19 95 20 00 20 05 Year t
Coastal areas of the Baltic sea and the Gulf of Riga Inland waters
Fig. 7. Eel landings in Latvia (t) in inland waters and the Baltic Sea (landing statistics of eel in inland waters during 1920-1960 is incomplete and recreational fishing of eel is not taken into account)
Recruitment of the European eel has declined markedly in the past few decades as well as eel landings in almost all Europe. According to ICES (2001, The International Council for the Exploration of the Sea), a steep decline in recruitment has occurred over most of the continent since the early 1980s, to about 10 % of the former levels in 2001. In 2002 ICES/EIFAC Working Group on Eel (ICES C.M. 2003/ACFM:06; EIFAC - European Inland Fisheries Advisory Commission) considered that the stock remains outside safe biological limits. Recent recruitments of A. anguilla glass eel were estimated to be only 1% of the level before the 1980s (Dekker, 2004). At the end of 2003 the Commission of the European Communities taking into consideration a critical stock state declared in the Communication “Development of a Community Action Plan for the Management of European Eel” (COM(2003) 573) the first steps of the Development of the Community Action Plan for management of the European Eel. More recently, the Commission proposed “Council regulation establishing measures for the recovery of the stock of European Eel” (COM(2005) 472). Among other management instruments restocking glass eels from river estuaries or yellow eels from aquaculture production should be used. Incoming natural recruitment as well as silver eel migration for spawning should be one of the important research subjects and might contribute to the management of stock and fisheries. Re-stocking is traditional practice carried out in most Community Member States, in some cases dating back to the 19th century. Re-stocking is based on capture of eels from the wild for their release in other areas. Re-stocking in Lithuania has taken place since the first decades of the 20th century up to date. In the period after the early fifties Lithuania stocked to the fresh water bodies (inland lakes mainly) about 50 million young eels, while Latvia – 31 million. However, natural recruitment is unknown due to specific natural conditions in the main recruitment areas, i.e. Curonian Lagoon and coastal waters of the Baltic Sea in Lithuania and Gulf of Riga in Latvia due to limited possibilities for recruitment monitoring. Do to similar reasons little is known about migrating silver eel escapement in Lithuania and Latvia as well. Consequently, natural recruitment,
GMM. Final report (2004-2007). General part
unexplored in Lithuania and Latvia waters. Moreover, natural recruitment remains unexplored not only in Lithuania and Latvia, but also in the overall South-Eastern Baltic Sea basin area. Knowledge of this kind is important from both fundamental and management points of view at all levels - local, national or international scale. Knowledge obtained within the GMM project on the genetic stock structure, the migrating behavior of stocked and naturally recruited eels, growth of naturally recruited and restocked eels as one of the best indicators for population strength and potential to contribute to stock reproduction cycle could contribute to the attempts made by the European Community to rebuilt European eel stocks.
1.4 Fish collection and sampling sites
Lithuania.
Perch and pikeperch were collected by gill netting in the Curonian Lagoon and Baltic Sea coastal waters (Fig. 8). During the spawning time and growing phase in mid-summer. Perch were collected during the spawning time close to the Vente cape, which is located in the North-eastern part of the freshwater Curonian Lagoon. Pikeperch were collected during the spawning time in the delta of Nemunas River, which flows to the Curonian Lagoon. Spawning of pikeperch in the research region (Lithuania) is identified and observed only in Nemunas river delta. Pikeperch were also sampled in spring time or early summer in the Northern part of the Curonian Lagoon just before emigration to the Baltic Sea. There was not observed pikeperch spawning in this area. In mid summer during the active growth phase perch and pikeperch were collected in the Curonian Lagoon close to Vente cape in the Curonian Lagoon and Lithuania coastal waters of the Baltic Sea.
The total length (LT) and weight (W) of each perch and pikeperch was measured to the nearest 5.0 mm and 1.0 g. Sexes were determined macroscopically from the gross morphology of the gonads.
Silver and yellow-stage European eels A. anguilla were collected by fyke nets and long lining from Baltic coastal waters, the Curonian Lagoon in western Lithuania and the freshwater Lakes Baluošai and Dringis in eastern Lithuania The lake is about 300 km from the Curonian Lagoon and about 350 km from the Baltic Sea, to which it is connected via a system of small streams, lakes, the river Nemunas and the Curonian Lagoon. Natural recruitment to these lakes has never been reported and may not occur; however, the possibility cannot be excluded. Elvers have been regularly stocked since 1960 into the system of lakes in the Baluošai Lake region.
The total length (LT) and weight (W) of each eel was measured to the nearest 1.0 mm and 1.0 g. Sexes were determined macroscopically from the gross morphology of the gonads, where eels with thin, regularly lobed organs (Syrski’s organ) were considered males, while individuals with more broad and folded curtain-like gonads were females (Tesch, 2003). The eels were classified as yellow and silver eels, by their external colour, fin shape and eye size.
The Baltic Sea is the largest brackish water body in the world, with an area of 412,000 km2. Surface salinity varies from less then 1 psu in the upper Bothnian bay to more then 34 psu in the outer Skagerrak. Water salinity in the Gulf of Bothnia and Gulf of Finland varies between 2-6 psu; Northern Baltic proper (including the Archipelago Sea, the Åland Sea and the Gulf of Riga) between 6-8 psu; Southern Baltic (including the Arkona Basin, the Bornholm Basin and the Gdansk Bay) salinity ranges between 7-10 psu; Western Baltic (German coast, the Belt area) between 7-10 ; Southern Kattegat 12-34 psu (Bonsdorff & Pearson, 1999).
The salinity in the Lithuania coastal waters (depths to 20 m) of the Baltic Sea is influenced by inflow of fresh inland water from the Curonian Lagoon in some areas depending on wind direction and varies from about 1 psu in the area of inflow to 7 psu in some kilometers distance from the inflow area, which is typical salinity for Lithuania coastal and open sea waters (Vyšniauskas 2003). Water transparency (Secchi-disc depth) in the coastal waters varies from 1 m at the Klaipeda Strait where fresh inland water inflows to the sea to 14 m in open areas (Vyšniauskas & Lesys, 1998).
The Curonian Lagoon is 1584 km2 in area, with a mean depth of 3.7 m and seasonal water transparency fluctuating in the range 0.35-2.0 m (I. Prochorova, pers. commun.); the Lagoon is separated by a narrow sand spit (0.5 – 4.0 km) from the Baltic Sea and is connected to it
seawater the salinity may episodically increase up to 5-6 psu in the northern areas (Olenin 1996). The average water level in the Lagoon is 15 cm higher than sea level, thus the seawater penetration into the Lagoon is rare.
Lakes Dringis and Baluošai are located in the eastern part of Lithuania in about 300 km distance from the Curonian Lagoon and the Baltic Sea. Both lakes are of glacial origin. The area of Dringis Lake is 731 ha, with maximum depth 24 m, mean – 8.4 m, water transparency fluctuates from 1.8 to 6.0 m (Kavaliauskienė, 1996). Four streams inflows to the lake, while one flows out and connects the lake to some other lakes and Nemunas river basin which is the biggest Lithuania river and flows to the Curonian Lagoon.
The area of Baluošai Lake is 250 ha, maximum depth is 37.5 m, average – 12.5 m, typical water transparency in summer is 2.8 m. Two streams inflow to the lake, while one flows out to the nearby bigger lake Asveja through which connects to Nemunas river basin which connects the lake to the Curonian Lagoon and Baltic Sea.
) )) ) ∋ Kaliningrad region (Russia) Poland Curonian Lagoon Lithuania Latvia Baltic Sea Baluošas Lake Belarus Klaipėda VILNIUS RIGA ) Baltic Sea Curonian Lagoon Location of sampling sites in coastal zone
Northern Part of the Curonian Lagoon
Delta of Nemunas River
Location of sampling sites in the Curonian Lagoon Klaipėda
Fig. 8. Sampling locations in the Baltic Sea, Curonian Lagoon and Lake Baluošai (Lithuania).
Latvia.
Gulf of Riga is located in the eastern part of the Baltic. From the Baltic Proper it is separated Kurzemes peninsula and by Estonian islands: Saaremaa, Hiiumaa, Muhu and Vormsi. Irbe strait connects Gulf of Riga with Baltic proper in the west and Muhu basin - in north. Mean depth of the gulf is about 26m; maximum depth is in the central part and is about 60 m. Gulf of Riga is a brackish water body with low water salinity, only 2-7 ‰ depending on region and season and can be considered as highly eutrophic.
Length of the Latvian coastline of the Gulf of Riga is about 250 km. Average depth in the coastal (2 mile) zone is about 10 m. In the Eastern part the bottom is covered mainly by sandy gravel and sandy gravel with pebbles and boulders (Stiebrins and Väling 1996). In southern and western part of the coastal zone the bottom is covered mainly by sand and in some places also by sandy gravel with pebbles and boulders (Stiebrins and Väling 1996). Bottom vegetation in the coastal waters is unevenly distributed. Brown algae Fucus vesiculosus is the dominating species in the Latvian coastal zone. Less abundant are filamentous green algae Cladophora spp. and red algae Ceramium spp., Furcellaria lumbricalis (A. Minde, unpub. data). Other species of different algae are present in very low densities.
Lake Ķīšezers is located close to the coast and is connected to the Baltic Sea through lower reach of river Daugava. It is freshwater lake but during strong Western winds brackish water from Gulf of Riga can enter the lake for short time period. The area of this lake is 1730 ha. It has average depth of 2,4 m and maximum depth 4,5 m, which is found only in one small area in the central part of it. Lake Ķīšezers is also characterised by brown colour of water and low transparency – in the summer only 0,5 m.
The river Daugava is largest river in Latvia with the largest river basin as well. There are 3 big hydroelectric plants constructed on Daugava, the last one located just 28 km from the river mouth and has not equipped with a fishpass. The lower reach flows through Riga city and therefore has diverse significant anthropogenic impact. The width of Daugava in the lower reach is around 500 m and the depth of 15 m.
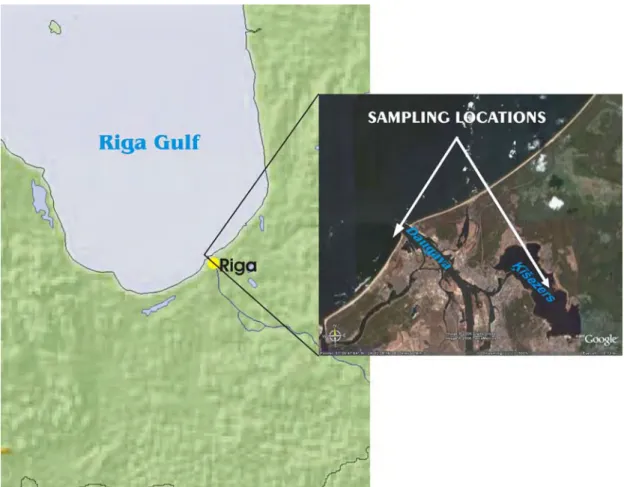
According to the project work plan eels were sampled in Southern Gulf of Riga, near the Daugava river mouth (Fig. 9) in August – September 2005. In total 31 specimens were caught, 16 of them were yellow eels, 15 – have already reached silver eel stage. All fish have been measured to the nearest mm and weighted; also sex determination and eye measurements were made. From each specimen both sagitta otolyths were taken for microchemical analyses and age determination and blood and flesh samples were taken for genetical studies.
Fig. 9. Eel sampling location in Riga Gulf, summer 2005
Pikeperch were sampled during spawning time in river Daugava (Fig.10) in spring from May till end of June. According to project proposal and work plan in total 30 pikeperch were sampled. Each fish was measured to the nearest mm, weighted and also sex determination was made. Sagitta otolyths were extracted for microchemistry analyses and age determination and blood and tissue samples were taken for genetic studies.
Pikeperch sampling in coastal waters according to project proposal is planned in summer 2006 in the Eastern part of Riga Gulf.
Figure 10. Pikeperch sampling location in Daugava river, spring 2005
Perch were sampled once during spawning time in lake Ķīšezers and twice - in spawning time and summer – in coastal zone near Daugava river mouth (Fig. 11). Sampling was carried out in spring from May till end of June and in summer from August till beginning of September. According to project proposal and work plan in total 100 perch were sampled. Each fish was measured to the nearest mm, weighted and also sex determination was made. Sagitta otolyths were extracted for microchemistry analyses and age determination and blood and tissue samples were taken for genetic studies.
Perch sampling in coastal waters according to project proposal is planned also in summer 2006 at the coast of Baltic Proper.
Fig. 11. Perch sampling locations in lake Ķīšezers and coastal zone in 2005 Sampling areas of eel in Latvia in 2006
According to the project work plan eels were sampled in lake Ķīšezers, which has close connection to Daugava river mouth and Riga Gulf (Fig. 12) and Mērsrags in Western part of Riga Gulf in August – September 2006. In total 46 specimens were caught, all of them were yellow eels. All fish have been measured to the nearest mm and weighted; also sex
determination and eye measurements were made. From each specimen both sagitta otolyths were taken for microchemical analyses and age determination and blood and flesh samples were taken for genetical studies.
Figure 12. Eel sampling sites in 2006 – Mērsrags (blue dot) and Ķīšezers (yellow dot).
Perch were sampled in summer in coastal zone of Open Baltic Sea (Fig.13). Sampling was carried out in August. According to project proposal and work plan in total 30 perch were sampled. Each fish was measured to the nearest mm, weighted and also sex determination was made. Sagitta otolyths were extracted for microchemistry analyses and age determination and blood and tissue samples were taken for genetic studies.
II. DESCRIPTION OF THE RESULTS
2.1 MICROCHEMICAL ANALYSIS OF FISH OTOLITHS
Summary
• The first year report about the eel migration, movement and identification of stocked and naturally-recruited eels in Lithuania has been written into a scientific paper and has been accepted for publication by a prestigious journal, Journal of Fish Biology. This paper “Migratory patterns and contribution of stocking to the population of European eel in Lithuanian waters as indicated by otolith Sr:Ca ratios” was included in this report as an appendix I.
• Based on the outcomes of the first year, we further evaluate the effects of stocking, migratory histories and habitat on eel growth. The full paper is almost finished and will be submitted to a journal for publication soon. The draft “Effects of habitat and stocking programs on the growth rate of European eel Anguilla anguilla ” is also included in the report as an appendix II.
• During the second year period of this project, we analyzed 33 eels and 31 eels from Lithuania and Latvia, respectively. We found higher proportion of stocked eels in Latvia than in Lithuania. Different migratory behaviors of the eels were also identified. Detailed data and results were discussed in the report.
• We also analyzed otolith Sr:Ca ratios from 22 perch and 53 pikeperch individuals collected in Lithuania. For the first time, both resident and migratory individuals were disclosed in this study.
Materials and Methods
Otolith preparation and Sr:Ca analysis
The largest pair of otoliths (sagittae) from eel, perch and pikeperch was removed, dried in air, embedded in Epofix resin, ground and polished until the core was exposed. For electron probe microanalysis, the polished otoliths were coated with carbon under a high-vacuum evaporator. Sr and Ca concentrations in the otolith were measured from the otolith core to the edge at 10 µm intervals for eel otolith and at 10 µm or 25 µm for perch and pikeperch otoliths. Quantitative analyses were conducted with an electron probe microanalyzer (JEOL JXA-8900R), using beam conditions of 15 kV for the acceleration voltage, 3 nA for the current, a 5 × 4 µm rectangular scanning beam with interval of the 10 µm for each analysis or 5 nA for the current, 10 µm beam size with interval of 25 µm for each analysis. The quantitative data were corrected by the PRZ (phi-rho-z) method to calculate oxide compositions (e.g., Goldstein et al., 1984; Reed, 1993). The peak concentration of Sr Lα was counted for 80 s with background measurements for 20 s on each side. The peak concentration of Ca Kα was counted for 20 s and each background for 10 s. A synthesized aragonite (CaCO3) and strontianite ([Sr0.95Ca0.05]CO3; NMNH R10065) were used as calibration standards. Since aragonite-structure carbonates are similar to otoliths, the standards have smaller matrix corrections than other types of standards such as oxide or silicate (Jarosewich & White, 1987). The standards were mounted in epoxy resin and polished. The carbon coating for the standards and otoliths had the same thickness (25-35 nm). After microchemical analysis, the otolith was polished to remove the carbon layer, then etched with 5% EDTA for 1 to 2 min to reveal the annual rings for age determination. The duration of the fish in freshwaters and sea/brackish waters was estimated by relating the otolith Sr:Ca ratio profile to the otolith annuli. The criteria for the discrimination between freshwater- and sea/brackish water-residents are defined in the results.
Results
Otolith Sr:Ca ratios of the eels collected in the Baltic Sea (Lithuanian territorial waters)
According to the finding in the first year project (Shiao et al., 2006), 32 eels collected in the Baltic Sea of Lithuania territorial waters can be classified into 30 naturally-recruited eels and 2 stocked eels after the analysis of otolith Sr:Ca ratios (Table 2). The mean otolith Sr:Ca ratios of 30 naturally-recruited eels show (Fig. 12) a gradually decline from approximately 6 × 10⁻³ after the glass eel stage to approximately 3 × 10⁻³ at catch. This pattern is consistent to the decreasing profile of salinity from North Sea, Baltic Sea to the Lithuanian coasts. The 30 naturally-recruited eels may invade the freshwater once to several times in their life (so called inter-habitat shifter, n = 15) or merely reside in the brackish/sea waters (so called sea eels, n = 15). The diversified migratory patterns of the naturally-recruited eels were described in the first year project report and published in the Journal of Fish Biology (Shiao et al., 2006).
Stocked eels always show a period of lower otolith Sr:Ca ratios (so called freshwater signature) after the glass eels stage, as shown in Fig. 13-14. Stocked eels (No. 13 and 24) occupied approximately 6.25% of the 32 eels collected in the Baltic Sea of Lithuanian territorial waters. The proportion of stocked eel is higher than that (2%) collected in 2004. However, the proportion of stocked eel in 2005 might be over-estimated due to the smaller sample size examined. If the samples of 2004 and 2005 were pooled, the proportion of stocked eel in Baltic Sea of Lithuanian territorial waters was approximately 3.75%; that was 3 stocked eels found in total 80 eels. This indicated that the out-migrant stocked eel from the freshwater lagoon or rivers into the Baltic Sea was not predominant.
Table 2. Biological characteristics (mean ± SD) of the European eels collected in the Baltic Sea of the Lithuanian territorial waters. N: sample size.
Mean (±SD) and range Origin of the eels Sampling period Developmental stage N
Total length (cm) Body weight (g) Age (year) Naturally-recruited eel June-August Yellow eel 31 61.8 ± 11.0
(36.5 - 79.0)
556.6 ± 348.9 (79.0 - 1207.0)
10.0 ± 2.2 (5 – 15) Stocked eel June-August Yellow eel 2
(No. 13 and 24) 60.5 for No. 13 77.5 for No. 24 437 for No. 13 1169 for No. 24 10 for No. 13 9 for No. 24
0 4 8 12 16 20 0 150 300 450 600 750 900 1050 1200 1350 1500 1650
Distance from core (μm)
Sr/C
a (× 10
-3 )
Fig. 12. Temporal changes of mean otolith Sr:Ca ratios from 30 naturally-recruited European eels (Anguilla anguilla) collected in the Baltic Sea of Lithuanian territorial waters. Y error bar represents the standard error of mean.
0 4 8 12 16 20 0 150 300 450 600 750 900 1050 1200 1350 1500 1650
Distanc from core (μm)
Sr/
Ca (×
10
-3 )
Freshwater signature due to the stocking program
Out migration to the Baltic Sea
Fig. 13. Temporal changes of otolith Sr:Ca ratios from a stocked European eel (Anguilla anguilla) No. 13 collected in the Baltic Sea of Lithuanian territorial waters. Y error bar represents the standard error of mean.
0 4 8 12 16 20 24 0 150 300 450 600 750 900 1050 1200 1350
Distance from core (μm)
Sr/
Ca (×
10
-3 )
Freshwater signature due
to the stocking program Out migration to the Baltic Sea
Fig. 14. Temporal changes of otolith Sr:Ca ratios from a stocked European eel (Anguilla anguilla) No. 24 collected in the Baltic Sea of Lithuanian territorial waters. Y error bar represents the standard error of mean.
Otolith Sr:Ca ratios of the eels collected in Latvian waters
Thirty-one eels collected in Latvian rivers were analyzed for otolyth Sr:Ca ratios. Among them 19 eels showed the pattern of naturally-recruited eel and 12 eels showed the pattern of stocked eels (Table 3). The mean otolyth Sr:Ca ratios of the naturally-recruited eels and stocked eels were shown in the Figs. 15 and 16, respectively. The mean otolyth Sr:Ca ratios of 19 naturally-recruited eels gradually decrease from approximately 6 × 10⁻³ (around 200μm from the otolyth core) after the glass eel stage to approximately 3 × 10⁻³ at catch. The profiles of otolyth Sr:Ca ratios of naturally-recruited eels collected in Latvia were very similar to that found in Lithuania since the naturally-recruited eels all experienced the same migrating routes from high saline North Sea, semi-saline Baltic Sea to very low saline Latvian coasts. The naturally-recruited eels collected in Latvia, as that collected in Lithuania, also showed diversified migratory patterns. All the 19 naturally-recruited eels except maybe only one specimen evidently invaded the freshwater once to several times in their life (so called inter-habitat shifter) and there be no sea eel observed. The most evident example of inter-inter-habitat shifting can be observed for specimen No. 158 (Fig.18). In this example specimen has entered freshwater shortly after arriving in Baltic Sea, spent there around 3 years and then returned in the sea. After 3-4 years spent in the sea, this individual repeated similar habitat shift one more time.
The eels were collected very close to the river delta and thus had continuous opportunity to enter freshwater. It has to be mentioned also that great amount of freshwater continuously flows in the sampling area from the inlets of two biggest Latvian rivers Daugava and Lielupe periodically (depending on weather conditions) lowering water salinity. This factor can also lead to absence of truly “sea eel” pattern in the sample. Therefore, it was reasonable to see that no sea eel was found in the sampling area, however the existence of see eels in the are can not be fully excluded. The eel No.146 can arguably be see eel (Fig.19). Although in the previous study in Lithuania the Sr:Ca ratio for seawater residents was >3.23 × 10⁻³ in Riga Gulf salinity is lower so the ratio also could be lower. In this respect additional sampling is needed in area that is not so influenced by freshwater to reveal or deny existence of sea eels in Latvian coastal waters.
In addition, the 12 stocked eels all showed consistent low otolyth Sr:Ca ratio from the elver stage to yellow or silver eel stage (Fig. 16 and 17), which was different from that found in the eels collected in the Baltic Sea of Lithuanian territorial waters. The consistent low otolyth Sr:Ca ratios without any higher otolyth Sr:Ca ratios indicates that the stocked eels completely reside in the freshwater environments and no indication for the out-migration to the Baltic Sea. The stocked eels were released probably in some midland lakes, which are far from the sea coast and connected to sea with rivers. However, downstream migration from lakes where eels has been stocked is restricted by eel weirs or hydroelectric power station dams. Therefore, the high proportions of stocked eels (39%) observed in the southern part of the Gulf of Riga only can be explained by escapement of certain portion of yellow or silver eel from Daugava basin upstream lakes via eel weirs during non traditional sea dwelling migration timing or even possibly trough hydroelectric power station turbines. Although the last one possibility is considered to be dependent from turbine characteristics and the mode of operation of power plant as well as from size of eel (EPRI, 2001; Hadderingh & Baker, 1998) there is no investigations and evidences of such migration in Daugava River. Additionally the possibility of eel migration along the sea coastline from other river basins should be considered. The possible origins of the stocked eels could be revealed only after careful studies of restocking activities performed in Latvia during previous decades.
Table 3. Biological characteristics (mean ± SD) of the European eels collected in the area of Latvian river. N: sample size.
Mean (±SD) and range Origin of the eels Sampling period Developmental stage N
Total length (cm) Body weight (g) Age (year)
Naturally-recruited eel August –
September Yellow eel 15
60.6 ± 10.7 (43.9 - 77.4) 670 ± 356.1 (179 – 1161) 12 ± 3.2 (5 – 19) Naturally-recruited eel August –
September Silver eel 5
61.3 ± 2.2 (58.9 – 63.6) 446 ± 79.6 (371 – 521) 12 ± 1.9 (10 – 14) Stocked eel August –
September Yellow eel 1 60.9 for No.142 499 for No. 142
16 for No. 142
Stocked eel August – September Silver eel
10 68.15 ± 10.0 (55.9 - 91.0) 866.5 ± 370.4 (368 – 1365) 21.5 ± 5.7 (13 – 30)
0 4 8 12 16 20 0 150 300 450 600 750 900 1050 1200 1350 1500 1650
Distance from core (μm)
Sr/C
a (× 10
-3 )
Fig. 15. Temporal changes of mean otolith Sr:Ca ratios from 19 naturally-recruited European eels (Anguilla anguilla) collected in the Latvian waters. Y error bar represents the standard error of mean.
0 4 8 12 16 20 0 150 300 450 600 750 900 1050 1200 1350 1500 1650 1800
Distance from core (μm)
Sr/C
a (× 10
-3 )
Fig. 16. Temporal changes of mean otolith Sr:Ca ratios from 12 stocked European eels (Anguilla anguilla) collected in the Latvian waters. Y error bar represents the standard error of mean.
0 4 8 12 16 20 24 0 200 400 600 800 1000 1200 1400 1600 1800
Distance from core (μm)
10
00
(Sr/Ca)
Freshwater signature due to the stocking program
Fig. 17. Temporal changes of the otolith Sr:Ca ratios from a typical stocked European eels (Anguilla anguilla) (No. 156) collected in the Latvian waters. The consistent low otolith Sr:Ca ratios without relative high otolith Sr:Ca ratio indicated that the eel completely reside in the freshwater environment and did not out migrate to the Baltic Sea. Y error bar represents the standard error of mean.
0 4 8 12 16 20 0 200 400 600 800 1000 1200 1400
Distance from core (μm)
1000 (Sr/Ca) 1
2
3
4
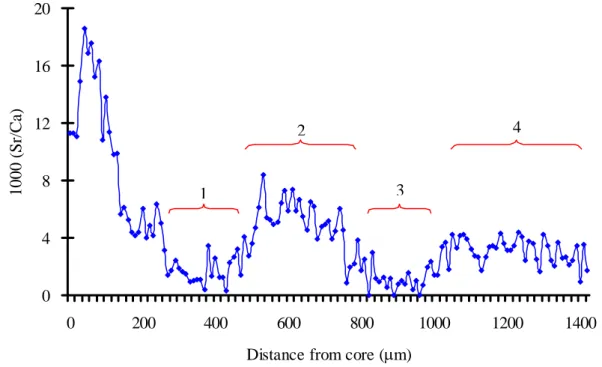
Figure Fig. 18. Temporal changes of Sr:Ca ratio for a typical inter-habitat shifter, 1 and 3 indicating freshwater residence, 2 and 4 – sea residence
0 4 8 12 16 20 24 0 150 300 450 600 750 900 1050
Distance from core (μm)
1000 (Sr/Ca)
Fig. 19. Temporal changes of Sr:Ca ratio for possible sea eel, specimen from Latvian sample No.146
Otolith Sr:Ca ratios of the perch and pikeperch collected from the inland lake
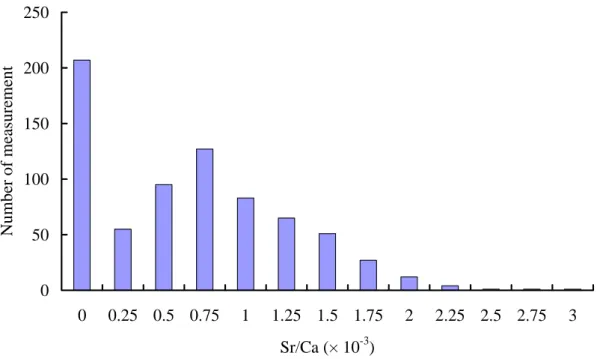
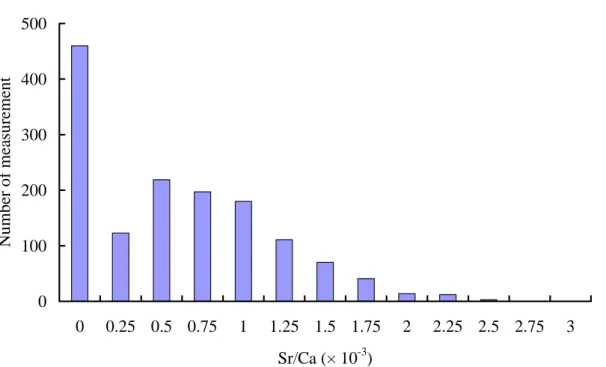
Seven perch and ten pikeperch individuals were collected from inland freshwater lake. These fish never experience saline water in their life so that their otolith Sr:Ca ratios shall represent the freshwater signature of these two species. The otolith Sr:Ca ratios of these 17 fish were very small and range from 0 to 2.87 × 10⁻³ (Figs. 20-21). The mean values (± SD) were 0.58 ± 0.53 × 10⁻³ and 0.51 ± 0.51 × 10⁻³ for the perch and pikeperch, respectively. The frequent distribution of all otolith Sr:Ca ratios were shown in Fig 22-23. About 90% of the values are less than 2.0 × 10⁻³. Therefore the value of 2.0 × 10⁻³ was used as a criterion to separate the freshwater residency from brackish/seawater residency. Furthermore, the values between 2.0 – 2.5 × 10⁻³ was regarded as the transition between freshwater and brackish/seawater environments in the follow sections.
0 1 2 3 4 0 250 500 750 1000 1250 1500 1750 2000 2250 2500
Distance from core (μm)
Sr/C
a (× 10
-3 )
Fig. 20. Temporal changes of mean otolith Sr:Ca ratios from 7 perch collected in the lake. Y error bar represents the standard error of mean.
0 1 2 3 4 0 500 1000 1500 2000 2500 3000 3500 4000 4500
Distance from core (μm)
Sr/C
a (× 10
-3 )
Fig. 21. Temporal changes of mean otolith Sr:Ca ratios from 10 pikeperch collected in the lake. Y error bar represents the standard error of mean.
0 50 100 150 200 250 0 0.25 0.5 0.75 1 1.25 1.5 1.75 2 2.25 2.5 2.75 3 Sr/Ca (× 10-3) Nu mb er o f measu remen t
0 100 200 300 400 500 0 0.25 0.5 0.75 1 1.25 1.5 1.75 2 2.25 2.5 2.75 3 Sr/Ca (× 10-3) Nu mb er o f measu remen t
Otolith Sr:Ca ratios of the pikeperch collected from the Curonian Lagoon
Sr:Ca ratio analysis were conducted on 24 pikeperch individuals collected in the Curonian Lagoon, 2004. Otolith Sr:Ca ratios were measured each 10 μm or 25 μm interval from the core. Both beam conditions indicated very low Sr:Ca ratios along the life history transect analysis (Fig. 24-25). The consistent low otolith Sr:Ca ratios indicated that these 24 pikeperches only resided in the freshwater Curonian Lagoon and did not move to the Baltic Sea during their life span. The otolith Sr:Ca ratios of these 24 pikeperches ranged from 0 to 3.66 × 10⁻³, with a mean value of 0.69 ± 0.66 × 10⁻³. Some fish show a single measurement larger than 3.0 × 10⁻³, which is not regarded as a habitat transition from freshwater to seawater environment. These unusual signals were considered as the analytic artifacts due to the uneven otolith surface.
0 1 2 3 4 0 400 800 1200 1600 2000 2400 2800 3200 3600 4000 4400
Distance from core (10 μm interval)
Sr/C
a (× 10
-3 )
Fig. 24. Temporal changes of mean otolith Sr:Ca ratios from 9 pikeperch collected in the Curonian Lagoon in year 2004. Analysis was conducted each 10 μm from the core. Y error bar represents the standard error of mean.
0 1 2 3 4 0 375 750 1125 1500 1875 2250 2625 3000 3375
Distance from core (25μm interval)
Sr/C
a (× 10
-3 )
Fig. 25. Temporal changes of mean otolith Sr:Ca ratios from 15 pikeperch collected in the Curonian Lagoon in year 2004. Analysis was conducted each 25 μm from the core. Y error bar represents the standard error of mean.
Otolith Sr:Ca ratios of the pikeperch collected from the Baltic Sea
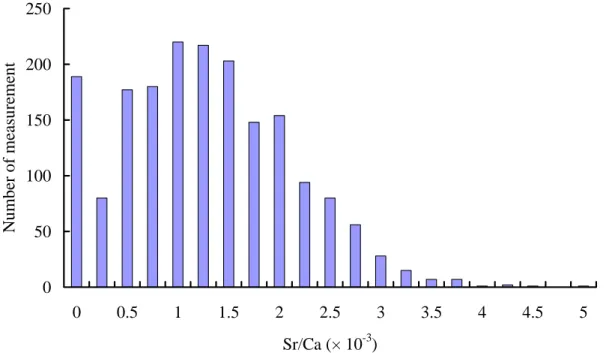
Otoliths from 19 pikeperch individuals collected in the Baltic Sea coastal waters were analyzed for Sr:Ca ratios. Otolith Sr:Ca ratios ranged from 0 to 4.76 × 10⁻³ with a mean value of 1.17 ± 0.81 × 10⁻³. More than 20% of the measurements exceed 2.0 × 10⁻³ (Fig. 26). The mean values of the temporal changes of all samples were evidently larger than the counter parts collected from the inland freshwater lake (Fig. 27). According to the temporal changes of otolith Sr:Ca ratios, several migratory behaviors were identified. Most fish show freshwater to brackish/seawater movement after a period of freshwater residence. The movements between freshwater and brackish/seawater environments are seasonal or regularly (Fig. 28). There are three fish (No. 56, 57, 58) that show freshwater residence although they were collected from the Baltic Sea (Fig. 29). These three fish might reside in the freshwater environments (Curonian Lagoon?) and moved to the Baltic Sea ultimately. The residence in the Baltic Sea might be too short to imprint the brackish/seawater signature of higher Sr contents in the otoliths.
0 50 100 150 200 250 0 0.5 1 1.5 2 2.5 3 3.5 4 4.5 5 Sr/Ca (× 10-3) Nu mb er o f measu remen t
Fig. 26. Frequency distribution of otolith Sr:Ca ratios from 19 pikeperch collected in the Baltic Sea in the year 2005.
0 1 2 3 4 0 250 500 750 1000 1250 1500 1750 2000 2250 2500 2750
Distance from core (μm)
Sr/C
a (× 10
-3 )
Fig. 27. Temporal changes of mean otolith Sr:Ca ratios from 19 pikeperch collected in the Baltic Sea in the year 2005. Y error bar represents the standard error of mean.
0 1 2 3 4 0 250 500 750 1000 1250 1500 1750 2000
Distance from core (μm)
Sr/C
a (× 10
-3 )
Fig. 28. Temporal changes of otolith Sr:Ca ratios of pikeperch no. 53 collected in the Baltic Sea in the year 2005. This fish reside in freshwater environment for a period of time (before 1000μm) then move to brackish Baltic Sea until being caught.
0 1 2 3 4 0 375 750 1125 1500 1875 2250 2625 3000 3375
Distance from core (μm)
Sr/C
a (× 10
-3 )
Fig. 29. Temporal changes of otolith Sr:Ca ratios of pikeperch no. 58 collected in the Baltic Sea in the year 2005. No evident movement between freshwater and brackish water was observed in this fish.
Otolith Sr:Ca ratios of the perch collected from the Baltic Sea in 2005
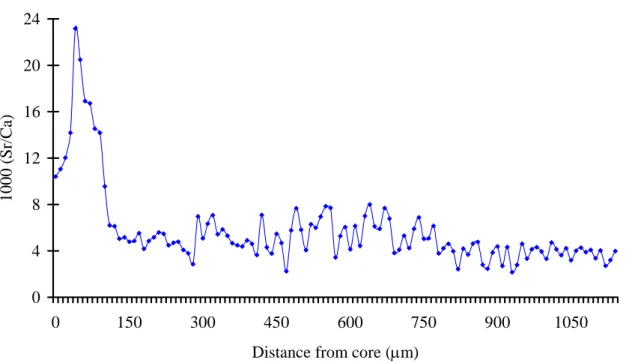
Otoliths from 15 perch collected in the Baltic Sea were analyzed for Sr:Ca ratios. Otolith Sr:Ca ratios ranged from 0 to 7.31 × 10⁻³ with a mean value of 1.91 ± 1.37 × 10⁻³. Approximately 50% of the measurements exceed 2.0 × 10⁻³ (Fig. 30). The mean values of the temporal changes of all samples show gradual increase from around 1.0 × 10⁻³ to around 3.0 × 10⁻³ (Fig. 31). According to the temporal changes of otolith Sr:Ca ratios, several migratory behaviors were also identified. Most fish show movement from freshwater to brackish water after an initial residency in freshwater environment. The movements between freshwater and brackish waters are seasonal or irregularly (Fig. 32-33). There is no freshwater-residence fish found in these samples. The perch evidently have larger otolith Sr:Ca ratios than that of pikerperch. This may indicate that perch resided in more saline water or the perch has more efficient Sr-uptake ability than the pikeperch.
Biological information of the perch and pikeperch collected for otolith Sr:Ca ratio analysis in Lithuania is presented in the Table 4.
0 100 200 300 400 0 1 2 3 4 5 6 7 8 Sr/Ca (× 10-3) Nu mb er o f measu remen t
Fig. 30. Frequency distribution of otolith Sr:Ca ratios from 15 perch collected in the Baltic Sea in the year 2005.
0 1 2 3 4 5 0 250 500 750 1000 1250 1500 1750 2000 2250 2500 2750 3000 Distance from core (μm)
Sr/C
a (× 10
-3 )
Fig. 31. Temporal changes of mean otolith Sr:Ca ratios from 15 perch collected in the Baltic Sea in the year 2005. Y error bar represents the standard error of mean.
0 1 2 3 4 5 6 7 8 0 200 400 600 800 1000 1200 1400 1600
Distance from core (μm)
Sr/C
a (× 10
-3 )
Fig. 32. Temporal changes of otolith Sr:Ca ratios of perch no. 10 collected in the Baltic Sea in the year 2005. This fish reside in freshwater environment for a period of time (before 400μm) then move to brackish Baltic Sea for another period of time and move to freshwater again.
0 1 2 3 4 5 6 7 8 0 250 500 750 1000 1250 1500 1730 1980 2230 2480 2730 2980 Distance from core (μm)
Sr/C
a (× 10
-3 )
Fig. 33. Temporal changes of otolith Sr:Ca ratios of perch no. 12 collected in the Baltic Sea in the year 2005. This fish reside in freshwater environment for a period of time (before 1900μm) then move to brackish Baltic Sea until being caught.
Table 4. Biological information of the perch and pikeperch collected for otolith Sr:Ca ratio analysis. Species Location Sampling date Mean Sr:Ca
ratios of freshwater contingent Mean Sr:Ca ratios of diadromous contingent Total length (cm) Weight (g)
Pikeperch Inland lake 2005 0.51±0.51×10⁻³ (n=10) (n=0) 43.5±11.5 823.0±738.6 Pikeperch Curonian Lagoon 2004 0.69±0.66×10⁻³ (n=24) (n=0) 48.7±8.7 1208±737.6 Pikeperch Baltic Sea 2005 0.71±0.54×10⁻³
(n=3)
1.32±0.83×10⁻³ (n=19)
42.0±6.7 746.5±493.1 Perch Inland lake 2005 0.58±0.53×10⁻³
(n=7)
(n=0) 23.7±2.9 195.3±64.7 Perch Baltic Sea 2005 (n=0) 1.91±1.37×10⁻³
(n=15)
Otolyth Sr:Ca ratios of the eels collected in Latvian waters in 2006.
In total 46 eels were sampled in August – September 2006. All eels were sampled with eel fykenet. All specimens were determined as females. Average total length and weight for caught eels differed by site. In lake Ķīšezers it was 81,3 cm (69,4-91,7 cm) and 979,8 g (521-1330 g), in Mērsrags – 77,9 cm (60,3-90,7 cm) and 1009,8 g (416-1560 g). All of them were yellow eels (Table _ and _). 40 of the sampled fish were naturally recruited, 6 were restocked eels that came from some freshwater bodies.
In summer 2006 30 perch were sampled in Jūrkalne on Open Baltic Sea coast. The average length and weight of the sampled fish was 27,5 ± 2,6 cm (24,4-34,3 cm) and 312,2 ± 96,1 g (198-567 g) (Table _). 19 perch in the sample were femailes, 11 were males making the sex ratio approximately 2:1.
Results
In total 46 eels collected in Latvian waters in 2006 were analyzed for otolyth Sr:Ca ratios. Among them 40 eels showed the pattern of naturally-recruited eel and 6 eels showed the pattern of stocked eels. The mean otolyth Sr:Ca ratios of the naturally-recruited eels and stocked eels were shown in the Fig. 1 and 2, respectively. The mean otolyth Sr:Ca ratios of 40 naturally-recruited eels gradually decrease from approximately 6 × 10⁻³ (around 200 m from the otolyth core) after the glass eel stage to approximately 3 × 10⁻³ at catch. The profiles of otolyth Sr:Ca ratios of naturally-recruited eels collected in Latvia were very similar to that found in Lithuania since the naturally-recruited eels all experienced the same migrating routes from high saline North Sea, semi-saline Baltic Sea to very low saline Latvian coasts. The naturally-recruited eels collected in Latvia, as that collected in Lithuania, also showed diversified migratory patterns. 30 naturally-recruited eels evidently invaded the freshwater once to several times in their life (so called inter-habitat shifters). Typical Sr:Ca ratio pattern of such specimens is shown in Figure 4. 15 eels were collected in lake Ķīšezers which is connected to river Daugava and thus has short connection with Riga Gulf. Therefore it is reasonable that no “sea eel” pattern was evident in the sample from this area. However 10 specimens from eels collected in Mērsrags could be considered as sea eels that have never entered freshwater at all. Typical Sr:Ca ratio for such specimens is shown in Fig.5. Although in the previous study in Lithuania the Sr:Ca ratio for seawater residents was >3.23 × 10⁻³ in Riga Gulf salinity is lower so the ratio also could be lower.
4 of the stocked eels, showed consistent low otolyth Sr:Ca ratio from the elver stage to yellow or silver eel stage (Fig. 2 and 3), which was different from that found in the eels collected in the Baltic Sea of Lithuanian territorial waters. The consistent low otolyth Sr:Ca ratios without any higher otolyth Sr:Ca ratios indicates that the stocked eels completely reside in the
freshwater environments and there is no indication for the out-migration to the Baltic Sea. However 2 specimens according to their Sr:Ca ratio, have entered coastal waters after their release. One of them was collected in Mērsrags, second one – in lake Ķīšezers. All of the stocked eels were released probably in some midland lakes, which are far from the sea coast and connected to sea with rivers. However, downstream migration from lakes where eels has been stocked is restricted by eel weirs or hydroelectric power station dams. Therefore
appearance of stocked eels observed in the sampling sites can be explained by escapement from Daugava basin upstream lakes via eel weirs during non traditional sea dwelling
migration timing or even possibly trough hydroelectric power station turbines. Although the last one possibility is considered to be dependent from turbine characteristics and the mode of operation of power plant as well as from size of eel (EPRI, 2001; Hadderingh and Baker, 1998) there is no investigations and evidences of such migration in Daugava River.
should be considered. The possible origins of the stocked eels could be revealed only after careful studies of restocking activities performed in Latvia during previous decades.
0 4 8 20 16 12 0 150 300 450 600 750 900 1050 1200 1350 1500 1650
Distance from core (μm)
Sr
/Ca (× 10
-3 )
Figure 1. Temporal changes of mean otolith Sr:Ca ratios from 19 naturally-recruited European eels (Anguilla anguilla) collected in the Latvian waters. Y error bar represents the standard error of mean.
0 4 8 20 16 12 0 150 300 450 600 750 900 1050 1200 1350 1500 1650 1800
Distance from core (μm)
Sr
/Ca (× 10
-3 )
Figure 2. Temporal changes of mean otolith Sr:Ca ratios from 12 stocked European eels (Anguilla anguilla) collected in the Latvian waters. Y error bar represents the standard error of mean.
0 4 8 12 16 20 24 0 200 400 600 800 1000 1200 1400 1600 1800
Distance from core (μm)
10
00 (Sr/Ca)
Freshwater signature due to the stocking program
Figure 3. Temporal changes of the otolyth Sr:Ca ratios from a typical stocked European eels (Anguilla anguilla) (No. 156) collected in the Latvian waters. The consistent low otolyth Sr:Ca ratios without relative high otolyth Sr:Ca ratio indicated that the eel completely reside in the freshwater environment and did not out migrate to the Baltic Sea. Y error bar represents the standard error of mean.
0 4 8 12 16 20 0 200 400 600 800 1000 1200 1400
Distance from core (μm)
1000 (Sr/Ca) 1
2
3
4
Figure 4. Temporal changes of Sr:Ca ratio for a typical inter-habitat shifter, 1 and 3 indicating freshwater residence, 2 and 4 – sea residence
0 4 8 12 16 20 0 150 300 450 600 750 900 1050 1200 1350 1500 1650 1800 Distance from core (μm)
Sr
/Ca × 1
0
-3
Table 5. Biological characteristics (mean ± SD) of the European eels collected in the lake Ķīšezers. N: sample size.
Mean (±SD) and range Origin of the eels Sampling period Developmental stage N
Total length (cm) Body weight (g) Age (year) Naturally-recruited eel September Yellow eel 12 81.1 ± 7.3
(69.4 - 91.7)
980.8 ± 250.9 (521 – 1330)
12.8 ± 1.4 (11 – 15) Stocked eel September Yellow eel 4 81.8 ± 6.7
(73.8 - 89.2) 976.8 ± 281.5 (712 – 1230) 14.3 ± 3.3 (11 – 18)
Table 6. Biological characteristics (mean ± SD) of the European eels collected in Mērsrags, Latvian coastal zone. N: sample size.
Mean (±SD) and range Origin of the eels Sampling period Developmental stage N
Total length (cm) Body weight (g) Age (year) Naturally-recruited eel August –
September Yellow eel 28
78.8 ± 6.2
(66.2 – 90.7) 1038.7 ± 258.3 (543 – 1560) 12.2 ± 1.8 (9 – 16) Stocked eel September August – Yellow eel 2 No.210 60,3 No.224 65,7 No.210 416 No.224 650 15 -
Table 7. Biological characteristics (mean ± SD) of the perch collected in Jūrkalne, open Baltic Sea coast. N: sample size
Mean (±SD) and range Sampling site Sampling period N
Total length (cm) Body weight (g) Jurkalne, Open Baltic Sea August 30 27.5 ± 2.6
(24.4 – 34.3)
312.2 ± 96.1 (198 – 567)