FMS patterns: Penetration vs. traffic substitution in
different groups of countries
Chi-Kuo Mao
a, Hsiang-Chih Tsai
b, Chun-Mei Chen
c,d,⁎a
Institute of Business and Management, National Chiao Tung University, Taipei, Taiwan
b
Department of International Business, Ming Hsin University of Science and Technology, Shin-Chu, Taiwan
c
Department of Business Administration, China University of Technology, Shin-Chu, Taiwan
d
Chunghwa Telecom, Taipei, Taiwan
Received 13 September 2006; received in revised form 10 January 2007; accepted 5 February 2007
Abstract
This paper studies the issue of fixed to mobile substitution, or FMS, which in recent years has become a significant trend. FMS occurs in two ways: one is the effect of a shift of traffic from fixed line to mobile; the other is the effect on fixed line penetration of the growth of mobile subscriptions. These two effects are called traffic substitution and penetration substitution, respectively. This paper, based on data from 1997 through 2004, finds that different substitution effects are taking place in different economies. In the more developed countries (G7 and NIE) FMS models mainly focus on ‘traffic substitution’. However, in the emerging economies (ASEAN and BRIC) FMS patterns mainly focus on ‘penetration substitution’ in association with the income effect. Policy implications on information economics are drawn from the above phenomena.
© 2007 Elsevier Inc. All rights reserved.
Keywords: FMS; Telecom; Substitution; Fixed line; Mobile; VoIP; Wireless; WiMax; G7; NIE; ASEAN; BRIC
1. Introduction
The history of new emerging communications technologies replacing old technologies keeps repeating itself. Since Alexander Graham Bell invented the telephone in 1876, the telephone co-existed with the
Technological Forecasting & Social Change 75 (2008) 356–384
⁎ Corresponding author. Department of Business Administration, China University of Technology, Shin-Chu, Taiwan. E-mail address:doris888@cute.edu.tw(C.-M. Chen).
0040-1625/$ - see front matter © 2007 Elsevier Inc. All rights reserved. doi:10.1016/j.techfore.2007.02.006
current main technology of the telegram for a long time (the naming of AT&T—American Telephone and Telegraph is historical evidence, the telegraph being the medium for sending telegrams). It took more than a hundred years for the telephone to replace the telegram. The function of the telegram–text transmission– has only recently been replaced by fax. Mobile communication technology, widely deployed in the 1990's, has now begun to take the place of conventional PSTN (Public Switching Telephone Network). This article studies FMS (Fixed to Mobile Substitution), to discover the differences in FMS patterns among the countries at different levels of economic development and to attempt to derive some basic rules for the evolution of the industry and markets.
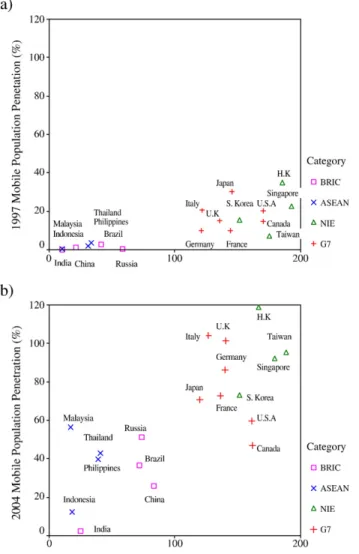
The object under study for this article is the four groups of regions/countries, namely, G7, NIE, ASEAN and BRIC. Russia has been removed from G8 due to the relative lower per capita GDP and reclassified with the BRIC group. Thailand, Malaysia, the Philippines and Indonesia have been selected as examples from among the ten ASEAN countries, while Singapore has been placed in the NIE (New Industry Economies) group due to similarities in economic development. The spread of fixed and mobile penetration of the four groups reveals significant differences among them during the period 1997–2004 [1,2]. The growth and decline of fixed household penetration and mobile population penetration among the four groups is clearly shown inFig. 1a and b where the horizontal axis represents fixed penetration and is based on households and the vertical axis represents mobile penetration and is based on population. The trends are very clear; mobile penetration universally increased.
This paper studies fixed penetration based on households, which more closely represents the actual situation of consumer use than that based on population, compares global relative fixed penetration through eight years and distinguishes the two FMS patterns of ‘traffic substitution’ and ‘penetration substitution’. We must here note that in the developed countries the telecom infrastructure is well developed and the investment of connecting lines to every household has already been made. In developing countries, however, the situation is different because the telecom infrastructure is less ubiquitous and therefore the deploying of mobile networks requires less capital and can be done more rapidly. Thus the FMS effect is fairly obvious–in developed countries with ‘built out’ fixed networks–‘traffic substitution’ is the dominant effect, while in developing countries with fewer fixed lines one sees ‘penetration substitution’. The result shows that ‘traffic substitution’ occurs mainly in G7 and NIE which have fixed line household penetration higher than 100%, while ‘penetration substitution’ occurs mainly in ASEAN and BRIC which have lower than 100% fixed line household penetration. This study also suggests the implications of different substitution models for a nation's future telecom infrastructure policy.
The following studies have examined from diverse viewpoints how mobile penetration, having spread widely over a short time, has affected fixed service. Rodini [3] investigated fixed line and mobile substitution. He did a market research of American households covering the years 2000–2001 and used cross-price elasticity to prove that mobile and second fixed lines substitute each other. He indicates that the degree to which mobile substitutes for fixed line has significant implications for the policy of fixed-line unbundling and the policy of fixed line and mobile vertical separation and universal service obligation (USO). Madden[4,5], based on data from 56 countries worldwide during the period 1995–2000, using a dynamic demand model verifies the significant substitution effect of mobile phones substituting for fixed telephony, and he proposes that the reduction of fixed service prices can slow the growth of mobile networks. Banerjee[6]indicates that, according to ITU data, the number of global mobile subscribers (1.15 billion) surpassed the number of fixed subscribers (1.13
billion) in 2002. Using cluster analysis he divided 61 countries into four clusters to discover that the expanded model for technology substitution and economic substitution explains that regional connections and economic development will influence the substitution of mobile for fixed telephony. Watanabe [7] indicates that successive innovation and diffusion of technology will bring about complementarities and substitution between the new technology and the existing technology, and he also proposes that the trend from fixed line to mobile phone to mobile Internet is the industry macro-evolutionary trend of the telecommunication ecosystem through competition and cooperation. Gruber
[8] studies the effect of competition and innovation on the diffusion of mobile communication in the middle and eastern European countries. Mao [9] indicates that the comparative efficiency of the full service telcos is more competitive than mobile-only and fixed-only telcos.
This study focuses on the nature and process of fixed to mobile substitution (FMS). Four groups of countries, G7, NIE, ASEAN and BRIC, are selected for studying the implications of the growth and
decline of the following indicators which are penetration, traffic volume, revenue and ARPU (average revenue per user) of the mobile and fixed-line services, and further to analyze the relationship between per capita income and these indicators. The structure of this paper is as follows. The topic of Section 2 is the data and hypotheses in which traffic substitution and penetration substitution are defined, and four hypotheses are proposed. Section 3 is the data analysis and testing of the three hypotheses. Section 4 proposes the concept of Income Effect. Section 5 presents the conclusions. Finally, Section 6 discusses topics for further study.
2. Data, measures, assumptions and hypotheses 2.1. Data
This paper covers the eight years from 1997 to 2004. The related data have been retrieved from telecom regulators as published on their websites (Appendix: A), from the telcos' Annual Reports and from ITU Telecommunication Indicators 2005 as reported by ITU (ITU, International Telecommunication Union) [2]. The penetration and subscriber data for fixed and mobile cover the years 1997–2004, while the revenue and ARPU cover the years 1997–2003, because worldwide this duration is the most significant period for FMS substitution effect. Beginning in the 2nd half of the year 2004 new technologies such as VoIP (Voice over Internet Protocol), Wi–Fi and WiMax started to emerge and thus affect the data for fixed revenue, therefore the data for fixed and mobile revenue stop at the year 2003. Because the overall situation becomes more complicated beginning in 2004, therefore the best observation period for studying the growth and decline of fixed and mobile service is from 1997 to 2004. One must remember that during the period of this study, Internet access was growing tremendously in developed nations. Especially in 1997–2000 the dominant access mode was via dial-up access, which caused both a large number of 2nd phone lines to be installed in residences and a significant increase in local call volume. New fixed carriers in Germany entered the market to compete [10], and Chunghwa Telecom in Taiwan provided a fixed line for new DSL subscribers, but both of these new services brought little growth in the number of the fixed lines since 2000. Besides Germany and Taiwan, the other developed countries had slight declines in the number of fixed lines by the year 2000 or 2001(please see Appendices B, C) [1,2]. Furthermore, after the year 2000 in the US, DSL and Cable Modem access came online thereby reducing network traffic, but this aspect is not part of the focus of our article about FMS.
2.2. Measures
To study FMS it is necessary to measure penetration. This study adopts total population, or per capita use, as a basis for measuring the mobile penetration for each country, and the penetration of mobile services into the total population we call mobile penetration. To measure fixed line penetration we use households as the basis for measuring, and the percentage, or penetration rate, of fixed line service reflects how many fixed lines the household has. We call this fixed line penetration. The number may be higher than the actual number of fixed lines in each household because the fixed lines include a small percentage of business customers.
2.3. Assumptions
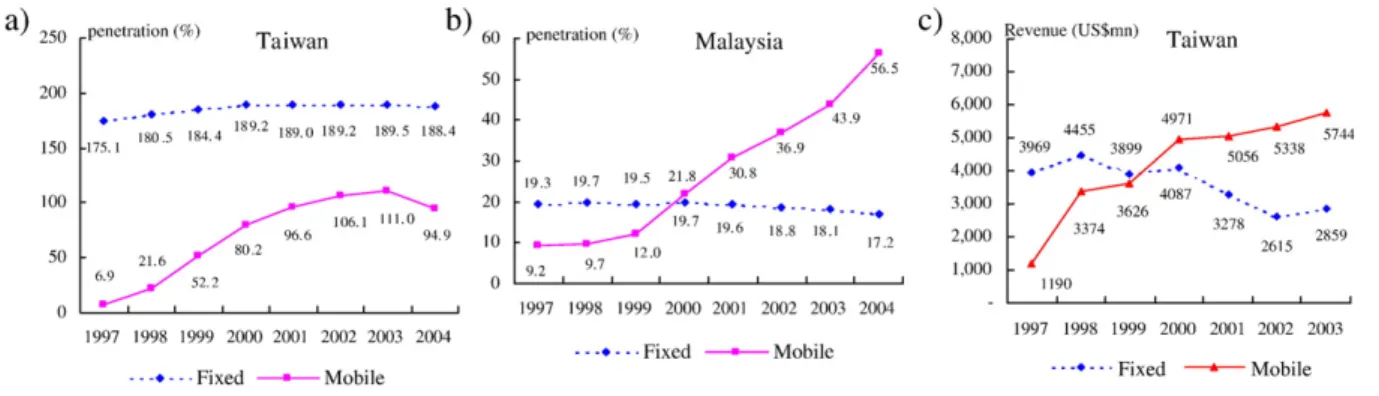
FMS patterns can be categorized into two types of substitution models. For example, the fixed line and mobile penetration development trend for Taiwan and Malaysia can be seen in Fig. 2a and b. Their similarities are the fast rise of mobile penetration (Taiwan declined in 2004 because mobile carriers were required to cancel invalid pre-subscribed accounts by the regulator-DGT). On the other hand, fixed-line penetration growth in both countries appears to stagnate which may reflect that the PSTN network has been‘built out’. The main difference between them, however, is in fixed line household penetration. In Taiwan it is over 180%, almost two lines per household, while in Malaysia it is only 18% (the data are retrieved from the published data of Malaysia regulator MCMC), and even this low level of penetration shows some decline.
Therefore, using the data from Malaysia as an example, we can infer an assumption with regard to the FMS pattern: for countries with low fixed line penetration (low means much lower than one fixed line per household), the rapid growth of mobile users will cause fixed line penetration to stop growing. In other words, because mobile penetration allows most families to be no longer dependent on fixed lines for communication, traditional telephone use stays at the current low penetration status or even experiences further decline. That is, they no longer apply for new lines, they cancel their fixed line service, or they can get service more rapidly by acquiring a mobile phone [11]. This situation we call ‘penetration substitution’, and once penetration substitution occurs, the traditional paradigm of fixed line as the universal service obligation (USO) is no longer valid, and the role of mobile communication must be redefined.
As for Taiwan, as mobile penetration grows rapidly, fixed-line penetration does not change to any significant degree, but the overall fixed voice revenue appears to decline when compared to the big increase in mobile revenue. For details see Fig. 2c. Therefore, for Taiwan, mobile penetration did not cause an instant decline of fixed line penetration, but rather replaced its revenue. Therefore, we have a second assumption with regard to the FMS pattern, which is, for countries with high traditional fixed line penetration (each household has more than one fixed line); the growth of mobile subscribers mostly involves replacing the usage of fixed line access. The effect on penetration is secondary. This usage substitution we call‘traffic substitution’.
Fig. 2. a) Taiwan fixed-line and mobile penetration growth trend (%). b) Malaysia fixed-line and mobile penetration growth trend (%). c) Taiwan fixed-line and mobile revenue growth trend.
2.4. Hypotheses
Based on the above discussion, we deduce the following hypotheses which are subject to testing. Hypothesis 1. During the years 1997–2004, for those countries with fixed-line penetration higher than 100%, the FMS is mostly traffic substitution.1
Hypothesis 2. During the years 1997–2004, for those countries with fixed-line penetration lower than 100%, the FMS is mostly penetration substitution.
In order to test Hypothesis 1, traffic substitution, we first have to solve the problem of measurement. From public sources we can obtain the number of minutes of fixed line use, but we are unable to obtain the number of minutes of mobile use from the relevant mobile businesses of each country. We can, however, obtain the data for revenue[2]. Therefore, in the above description of the effect of traffic substitution we use the growth and decline of revenue to replace traffic volume as a basis for discussion, but whether revenue is suitable to replace traffic volume, as the measurement for FMS analysis needs to be further clarified.
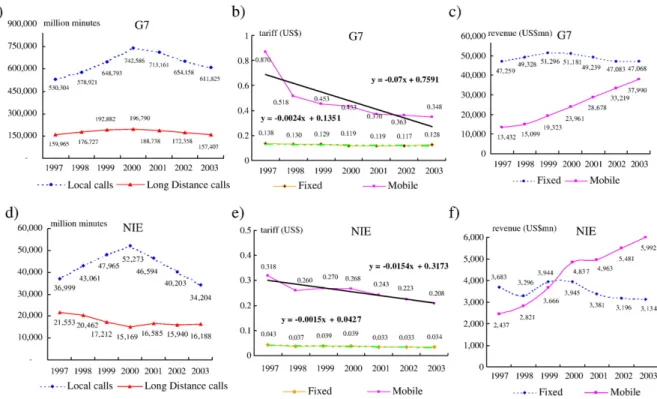
FromFig. 3a–c and d–f we can deduce the following: fixed traffic is composed of local, long distance and international traffic. Because international traffic volume statistics have never separated delivery by fixed phone sets or mobile handsets for the various countries, and also because the mobile phone substitutes for fixed line in making long distance calls, therefore, fixed traffic volume has in fact been influenced by local traffic volume. The following views could be drawn from the two groups ofFig. 3a–c and d–f.
(1) Local traffic volume shows a rapid decline in the year 2000 in G7 and NIE countries. SeeFig. 3a and d. There are no data for Canada; therefore the data for G7 include only six countries. There are also no data for Singapore; therefore the data for NIE include only three countries. The local call rate is basically the same, but overall fixed line revenue, including long distance and international, shows a clear loss starting in the year 2000. In NIE countries, fixed line revenue declined overall in 1998 because local call rates and household monthly fees were lowered quite a bit compared to 1997. In effect, around 2000 some countries within these two groups opened up the fixed line market2 and considerably reduced long distance and international call rates, but the overall trend of the changes in fixed line total revenue and local traffic volume are relatively flat and consistent. From this phenomenon we can conclude that the effect of lowering long-distance and international tariffs to cause a decline in revenue cancels out the effect of pricing elasticity from increased traffic volume and its resulting revenue increase.
Because of incremental reduced fixed line tariff (see Figs. 3b, e and 4b, e), fixed telephony revenue started to decline since the year 1999 or 2000 for G7 countries including US, Canada, Japan, France, Italy and U.K. (see Appendices D, E)[2]. In the US, local calls are most often at a
1
Since the dial-up traffic were included in the local calls, it is difficult to calculate the Internet access effect for the earlier dial-up years.
2 The liberalized schedule of fixed markets around the year 2000 has included Germany in Jan. 2000 and France in 2002 for
flat rate (revenue is not traffic sensitive), and long distance calling began a trend to flat rate service during this time. In addition, the statistical data of international calls have not separated fixed-terminal calls from mobile-terminal calls. The relationship of revenue to traffic for the two groups of G7 and NIE has been made according to the study data. In conclusion, the correlation between the variables of revenue and of fixed line traffic volume (including local and long distance calls) are 0.6430 for G7 and 0.7258 for NIE, both displaying a strong relationship as shown inTable 1a and b. In other words, using the trend of changes in revenue as a replacement for using changes in traffic volume is valid.
(2) Mobile tariff clearly declined for both G7 and NIE, but mobile revenue rose substantially. There are three possible reasons: a) the natural growth of mobile demand; b) the price elasticity for mobile demand; and c) fixed traffic substitution. From the large decline in fixed line local and long-distance calls since the year 2000 we can deduce that based on global economic trends there is no reason for overall communication demand to decline significantly since 2000. For mobile service to be so attractive arises from the synergistic effect of the above items a), b), and c).
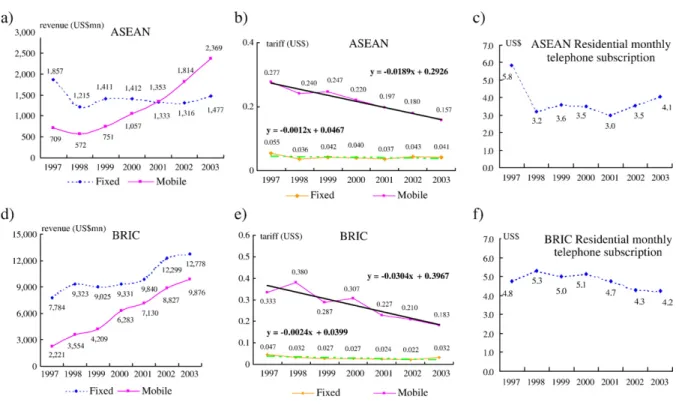
For ASEAN and BRIC countries we can summarize as shown in Fig. 4a, b, c, d, e, and f. First, ASEAN mobile revenue increased considerably since 1998, but mobile tariff has been declining which implies that the growth of mobile traffic volume is very strong. The decline of fixed line revenue in 1998 is because monthly fees and local call tariffs were much lower when compared to 1997. During the study period 1997–2003 ASEAN fixed line tariffs basically remained flat.
Fig. 3. a) G7 domestic calls growth trend. b) G7 local and mobile cost for a 3-minute call. c) G7 revenue growth trend. d) NIE domestic calls growth trend. e) NIE local and mobile cost for a 3-minute call. f) NIE revenue growth trend.
Interestingly, the changes in fixed line revenue and fixed line monthly fees show a parallel up and down movement. This indicates two points: a) In ASEAN countries basic fixed line monthly fees compared to their traffic fees may be too high. Therefore the trend of fixed line revenue depends mainly on the up and down movement of their fixed line basic monthly fee. b) Because fixed line traffic volume in ASEAN countries is relatively low, therefore the main focus of FMS substitution is
Fig. 4. a) ASEAN revenue growth trend. b) ASEAN local and mobile cost for a 3-minute call. c) ASEAN residential telephony monthly rental. d) BRIC revenue growth trend. e) BRIC local and mobile cost for a 3-minute call. f) BRIC residential telephony monthly rental.
Table 1a
G7 correlation between fixed traffic and revenue (1997–2003)
G7 Local + long distance (mn minutes) Revenue (US$ mn)
690,269 47,259 755,648 49,328 841,675 51,296 939,376 51,181 901,899 49,239 826,516 47,083 769,232 47,068 Correlation 0.6430
not fixed line traffic volume but fixed line penetration. This in effect indirectly supports the above Hypothesis 2.
Second, both fixed line and mobile revenue for BRIC countries have been growing continuously. For example, the Brazilian government's mandated program to improve‘teledensity’ probably had a major effect on fixed line growth. In addition, the PHS (Personal Handyphone System) lines offered by China Telecom with a limited wireless service in major cities may have also had an effect on the growth of total local fixed lines. There are two points worth mentioning: a) mobile tariff is declining while fixed line tariff remains the same. Fixed line monthly fees declined but the scale is very small. Therefore we can deduce that the growth of mobile traffic volume should be faster than fixed line growth. This situation does not exclude possible FMS traffic substitution in BRIC countries. b) In BRIC countries fixed line monthly fees do not dominate fixed line revenue.
Based on the above discussions this study assumes that for FMS analysis fixed line and mobile revenue are suitable measurements to replace traffic volume. In order to establish a basis for cross-country comparison and analysis, this study further converts the absolute value of each country's fixed line and mobile revenue into annual average revenue per user, ARPU. Fixed line ARPU is calculated by dividing the total annual revenue by total number of fixed lines, and mobile ARPU is calculated by dividing the total annual revenue by total number of mobile users. Because the four groups of countries or regions studied in this paper have great inter-group differences as well as intra-group differences in level of economic development, therefore we propose a third hypothesis.
Hypothesis 3. There exists an‘income effect’ in telecom penetration, i.e., when the ratio of fixed line and mobile expenditure (combined or separate) to annual personal income (abbreviated as T/I ratio) is high, then fixed line or mobile penetration is not easily increased.
Telecommunication satisfies a basic need in daily life, but if the cost of this basic need takes a higher percentage of the users' disposable income so as to reduce the satisfaction of other basic needs such as food, clothing, or housing, then this telecommunication need will not necessarily have a high priority among users. Therefore, when the ratio of the expense of fixed line or mobile communication to annual income (can be measured by ARPU) is too high, then neither fixed line nor mobile penetration can increase easily. In addition, mobile service when first available was priced relatively much higher compared to fixed line service, especially for those countries with lower per capita income, and this unavoidably became an obstacle for the growth of telecommunication penetration.
Table 1b
NIE correlation between fixed traffic and revenue (1997–2003)
NIE Local + long distance (mn minutes) Revenue (US$ mn)
58,552 3683 63,523 3296 65,177 3944 67,442 3945 63,179 3381 56,143 3196 50,392 3134 Correlation 0.7258
3. Analyses and verification
The growth of local traffic during 1997–2000 comes in part from the increase in local dial-up calls, while the decline of local traffic during 2001–2004 comes in part from the shift in fixed traffic from dial-up to high-speed access. One must note that, Internet dial-dial-up traffic has been combined with local calls and it is difficult to separate the two for accounting purposes by the telcos. Additionally, the data of Internet revenue for most countries are insufficient to be used according to ITU Telecommunication indicators. One may assume that the loss of fixed line traffic can be attributed to a transfer of that traffic to the mobile market. Therefore, this study to explore FMS effect for both elements of fixed line and mobile are inferred to be appropriate to address the validity of the linear lines and their slopes. Now we shall use the relative data from the four groups of countries to analyze and verify the above three hypotheses. 3.1. G7 substitution pattern
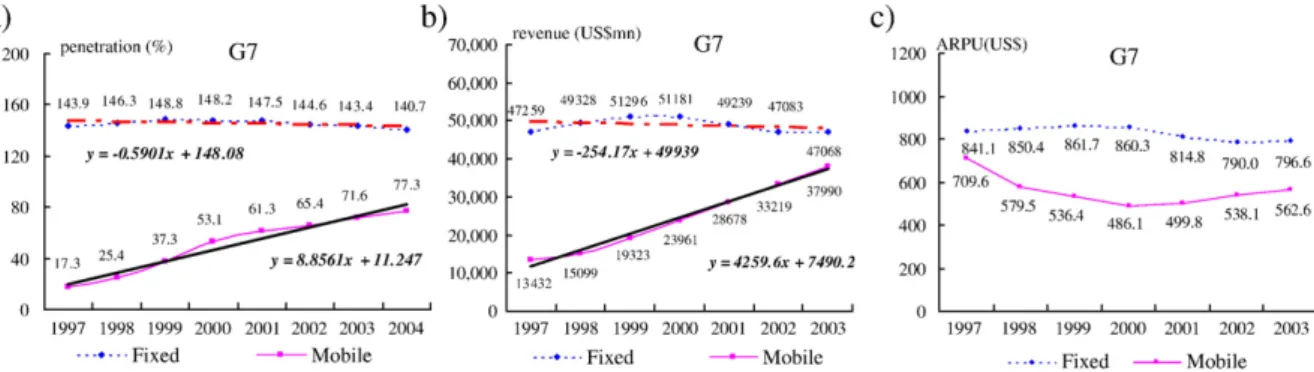
During the years 1997 to 2004 the average fixed line penetration in the G7 countries is higher than 140%. The basic trend is a slight increase from 1997 to 1999 and a slight decrease from 1999 on, making the overall trend flat. Mobile penetration shows rapid growth from 1997 to 2004 with the average penetration rising from 17% to 77% (Fig. 5a). As for revenue during the same period, fixed line service revenue is similar to its penetration curve, peaking in 1999. Mobile revenue grew similarly to mobile penetration (Fig. 5b). In analyzing their ARPU, fixed line ARPU in G7 countries has been higher than mobile ARPU. Fixed line ARPU shows the same tendencies as fixed line penetration and revenue with 1999 as a turning point. Mobile ARPU shows first a decline and then a rise (Fig. 5c). Now we look at the relationship between these curves.
First, the relationship among the three curves of fixed line penetration, fixed line revenue and ARPU is explored. From 2000 to 2003 fixed line tariff remained basically the same, averaging 0.12 USD (Fig. 3b). Residential monthly fees increased about 12% (the available data for four countries among G7 countries averaged from US$ 13.2 to US$ 14.8), but during this period fixed line revenue declined 8% (Fig. 3c), and ARPU dropped 7.4% (Fig. 5c). This clearly shows a big loss of fixed line traffic volume, consistent with the data shown inFig. 3a. The year 2000 is a turning point with local traffic volume dropping 17.6% and long distance traffic volume dropping 20%.
Next, the relationship among the three curves of mobile penetration, total revenue and ARPU. Mobile tariff dropped 60% (Fig. 3b) from 1997 to 2003, and mobile annual ARPU dropped 20.7% (Fig. 5c). During this period mobile tariff dropped more than the ARPU dropped. Therefore, the growth of mobile traffic volume is very significant. This tariff drop not only increased mobile penetration from 17.3% in 1997 to 61.3% in 2001 but also further increased it to 71.6% in 2003 (Fig. 5a). The decline in tariff rates not only enabled mobile penetration to increase but also enabled mobile total revenue to have a 183% growth rate from 1997 to 2003 (Fig. 3c). This reflects the price elasticity of mobile demand. It also indicates a huge growth of mobile traffic volume during this period. Therefore, we may infer that some of this traffic volume was originally carried by conventional PSTN, but because of the decline of mobile tariff, and because of mobile convenience, the use of mobile took away the conventional PSTN voice market. This phenomenon is what this paper calls FMS‘traffic substitution’ and this is consistent with the statement of Hypothesis 1. SeeFig. 5a–c.
Finally for G7 countries, the growth slope of fixed line penetration is−0.5901 and that of fixed line revenue is −254.17, both showing a linear downward trend. The growth slope of mobile penetration growth is 8.8561 and that of the mobile revenue is a high value of 4259.6, both showing a linear growth trend. The trend of fixed penetration clearly shows a small decline, while the trend of mobile penetration displays obvious growth. The decline of fixed line revenue is much more than the decline of fixed line penetration; it is obvious that the loss of the fixed traffic has resulted in a dramatic decline of fixed revenue. In the meantime mobile revenue shows very strong growth; in addition to the traffic shift from fixed to mobile, mobile service itself also has very high growth. Because the penetration of mobile phone has not resulted in an immediate decline of the fixed penetration, the phenomenon of FMS is mainly centered on traffic substitution. This conforms to Hypothesis 1. Please seeFig. 5a–b.
3.2. NIE substitution pattern
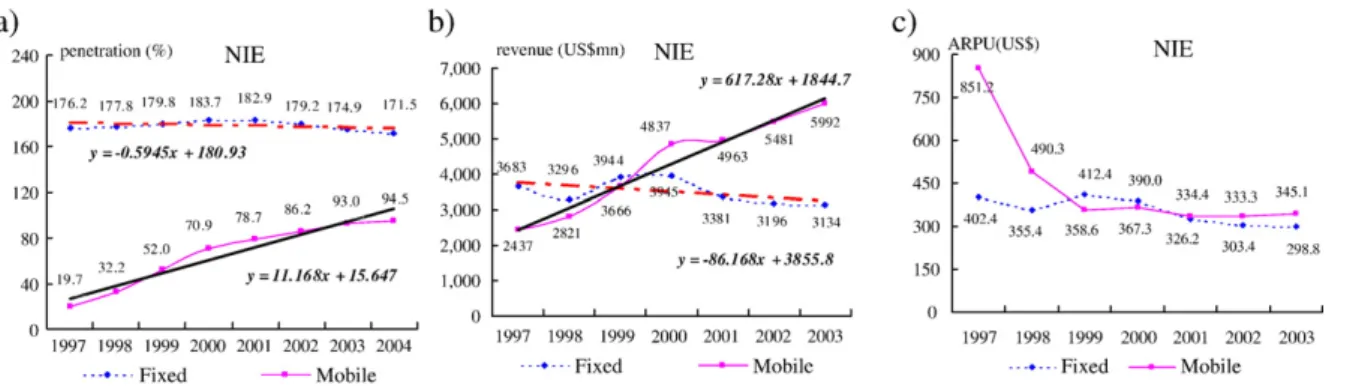
During the years 1997 to 2004 the average fixed line penetration in NIE countries is higher than 170%. The basic fixed line growth curve is flat, showing a slight decline beginning in the year 2000. During the same period the mobile penetration rate grew rapidly from 19.7% in 1997 to 94.5% in 2004 (Fig. 6a). Mobile revenue exceeded fixed line revenue beginning in 1999, and the growth trends of fixed line revenue and fixed line penetration and ARPU are similar. Mobile ARPU falls below fixed line ARPU from 1999 on (Fig. 6c), and the mobile penetration rate shows a large increase (Fig. 6a). Following is a discussion of the relationship among these trends.
First, the relationship among the three trends of fixed line penetration, revenue and ARPU is examined. Fixed line penetration declined from its peak at 183.7% in 2000 to 171.5% in 2004 (Fig. 6a), a 6.6% decline. Local traffic also started to decline drastically beginning in 2000. By 2003 it had dropped by 34.6%. From its peak in 1997 long-distance traffic had dropped 33% by 2003 (Fig. 3d). Fixed line traffic volume loss is much higher than its penetration loss. Therefore, the loss of NIE fixed line traffic cannot be attributed to penetration decline but to mobile use taking away the voice market. Furthermore, fixed line residential monthly fees increased 18.8% from 2000 to 2003. The local tariff declined slightly, by 1.7% (Fig. 3e), but fixed line revenue declined 20.6% (Fig. 3f), and fixed line ARPU declined 23.4% (Fig. 6c). Therefore, the average increase of fixed line fees did not increase fixed line revenue and ARPU (Fig. 6c). The loss of fixed line traffic volume is obvious.
Next, the relationship among the three trends of mobile penetration, revenue and ARPU is examined. During the time when mobile penetration increased rapidly there was no obvious change
of fixed line penetration. The average increase of fixed line residential monthly fees was not sufficient reason to cause fixed line revenue to drop drastically. But, from the years 2000 to 2003, mobile tariff dropped 22% (US$0.268 to US$0.208 per 3-minute call). Price elasticity caused the increase of mobile traffic volume. During this same period mobile revenue growth increased 23.9% while mobile ARPU declined about 6%. The reason for the increase of mobile traffic volume is the growth of mobile penetration and also, clearly, fixed line traffic substitution. Therefore, by the end of 2004 FMS substitution is mostly traffic substitution. The influence on penetration (cancellation of fixed line subscriptions) is secondary. This FMS pattern of ‘traffic substitution’ is consistent with Hypothesis 1.
Finally, for NIE countries, the growth slope of fixed line penetration is−0.5945 and that of fixed line revenue is−86.168, both showing a linear downward trend. The growth slope of mobile penetration is 11.168 and that of mobile revenue is a high value of 617.28, both showing a linear growth trend. In contrast to the jump in mobile revenue, fixed line revenue shows an obvious decline. Although fixed line penetration declines only slightly, fixed line revenue has a considerable loss. Obviously the shift of fixed line traffic has resulted in the decline of fixed line revenue. The spread of mobile service has not caused an immediate decline of fixed line penetration. Therefore, the FMS phenomenon is mainly centered on traffic substitution. This conforms to Hypothesis 1. Please seeFig. 6a–b.
3.3. ASEAN substitution pattern
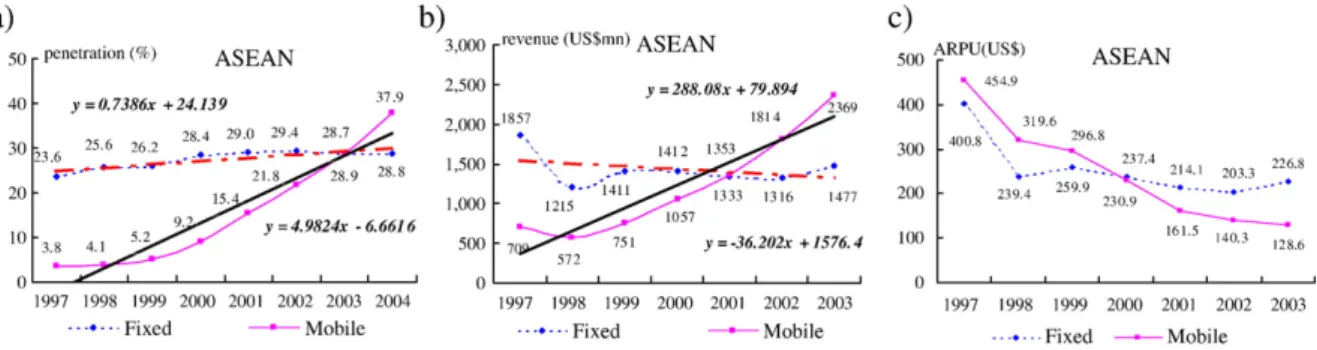
For the years 2000 to 2004 the average fixed household penetration for ASEAN countries is about 28%. Except for Thailand with a slightly higher penetration at 40.5% the other countries all have very low penetration relative to the G7 or NIE countries. The growth trends of fixed line revenue and ARPU are similar, both being basically stagnant since 1999. The growth trend of mobile revenue is similar to that of mobile penetration, both showing a significant increase. Mobile revenue exceeded fixed line revenue during the period 2000–2001. Following is a discussion of the relationship of these trends.
First, the relationship among these three trends of fixed line penetration, revenue and ARPU is examined. The basic growth trend of fixed line penetration increased slightly from 1997 to 2002, and declined slightly after 2002. Fixed line revenue showed an obvious decline in 1998. In 1998 local
tariff declined 13.4% and monthly fees declined 25.5% compared to the previous year (Fig. 4b–c). As a result, fixed revenue dropped 34.6% in 1998 (Fig. 4a). During the period 2000 to 2003 fixed line tariff remained essentially the same (Fig. 4b), but monthly residential fees increased 17% (Fig. 4c) while fixed revenue declined 6.7% and fixed ARPU also declined 4.5% (Fig. 7c). The increase of fixed line monthly fees did not much change fixed line penetration, but fixed line revenue and ARPU declined. This shows that in ASEAN countries when fixed line penetration is still much lower than one line per household, an increase in mobile penetration not only stops the growth of their fixed line penetration but also causes a certain degree of traffic substitution. One special thing worth noting about ASEAN countries is that without strong growth of mobile services each household in these countries may eventually connect to a fixed line, but use of mobile services causes the substitution effect for those families without a fixed line because there is then no need to subscribe to a fixed line. Therefore, even though there is a certain degree of traffic substitution, relatively speaking, the growth trend of fixed line penetration has been replaced by mobile penetration. Penetration substitution is the main FMS pattern for these countries.
Next, the relationship among the three trends of mobile penetration is examined, total mobile revenue and mobile ARPU. Mobile ARPU initially was higher than fixed ARPU, but mobile penetration had no obvious growth. Only in the year 2000 was mobile ARPU lower than fixed line ARPU (Fig. 7c). Mobile penetration began to grow considerably from 9.2% in 2000 to 37.9% in 2004 (Fig. 7a). The mobile revenue of ASEAN countries had a big increase since 1998, but tariffs have been decreasing. Compared to the year 2000 mobile tariff in 2003 dropped 28.6%, but mobile revenue grew 124% (Fig. 4a). This indicates that mobile traffic growth is very strong. Fixed line growth during the same time was only 4.6%. One may say that mobile penetration, besides inhibiting the growth of fixed line penetration, also has to a certain degree traffic substitution effect. This resulted in the mobile penetration rate of 37.9% exceeding the fixed line penetration rate of 28.8% in the year 2004. In sum, because of the fast growth of mobile penetration in ASEAN countries the growth of fixed penetration was obviously being suppressed. This verifies Hypothesis 2: for the countries with fixed household penetration much less than 100% the FMS pattern is mainly‘penetration substitution’.
Finally, for ASEAN countries, the growth slope of fixed line penetration is 0.7386 showing a linear growth trend and that of fixed line revenue is −36.202 showing a linear downward trend. The growth slope of mobile penetration is 4.9824 and that of mobile revenue is a high value of 288.08 both showing a
Fig. 7. a) ASEAN average penetration growth trend. b) ASEAN annual average revenue growth slope. c) ASEAN average ARPU growth trend.
linear growth trend. The growth of mobile penetration is higher than that of fixed-line penetration; therefore FMS penetration substitution has happened. Even the slope of fixed penetration shows a slight growth, while the slope of fixed line revenue shows an obvious decline. Therefore, the FMS model also includes some traffic substitution. Please seeFig. 7a and b.
3.4. BRIC substitution pattern
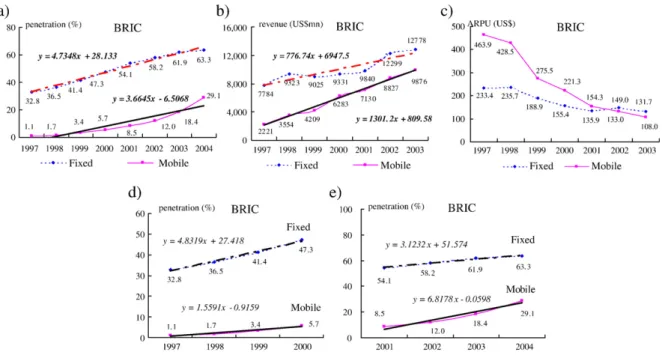
The group of BRIC countries is the most diversified among the four groups in the study, and the intra-group differences are significant. Therefore, the following discussion is about average tendencies. Implementation of USO is far from ideal in the BRIC countries as, for example, telecom penetration in China occurs mostly in metropolitan areas or in the coastal provinces which are like developed countries, but in the inner agricultural areas penetration is very low. There is a significant difference in the penetration in BRIC countries divided by the year 2001. Mobile ARPU initially was much higher than fixed line ARPU, but it became lower starting in 2002. The following is a discussion of the relationship among these growth trends. The mobile growth rate is thus much faster than fixed line. This is without taking into account the possibility of FMS traffic substitution in BRIC countries. This is consistent with Hypothesis 2. For details seeFig. 8a–c.
For BRIC countries, over the entire 1997–2004 periods, the linear slope of fixed line penetration is 4.7348 and that of mobile penetration is 3.6645 (Fig. 8a). The growth of fixed line penetration has surpassed mobile penetration. But when the eight years are divided into the periods 1997–2000 and 2001–2004, then there are obviously different results which will be discussed in the next paragraph
Fig. 8. a) BRIC average penetration growth slope. b) BRIC average revenue growth slope. c) BRIC average ARPU growth trend. d) BRIC average penetration growth slope (1997–2000). e) BRIC average penetration growth slope (2001–2004).
(Fig. 8d, e). The slope for fixed line revenue during the period 1997–2003 is 776.74 and the slope for mobile revenue reaches a high of 1301.2. Both fixed line and mobile revenue grow rapidly with the growth rate of mobile revenue being much higher than that of fixed line revenue.
In summary, during the years 1997–2004 the FMS pattern in G7 and NIE countries is mainly traffic substitution. For ASEAN the pattern is penetration substitution. In BRIC countries the tendency toward penetration substitution begins to become obvious from 2001. But the difference between fixed line and mobile tariffs is much smaller in ASEAN countries than in BRIC. This makes ASEAN mobile penetration exceed BRIC. In BRIC countries because fixed line revenue is not heavily dependent on monthly fees and also because fixed line tariff is much lower than mobile tariff, BRIC countries are heavily dependent on fixed line, and this makes fixed line penetration much higher than in ASEAN countries.
Reexamining the slopes after dividing the entire study period into the two separate time periods finds that for the 2001–2004 periods there is penetration substitution which thus conforms to Hypothesis 2. For the 1997–2000 periods, the fixed penetration slope is 4.8319 and the mobile penetration slope is 1.5591, the growth rate of fixed penetration is faster than that of mobile penetration. But for the 2001–2004 periods, the slope of mobile penetration is 6.8178 which are greater than the 3.1232 of fixed penetration. The growth rate of mobile penetration has exceeded that of fixed penetration during 2001–2004. This conforms to Hypothesis 2. Please see Fig. 8d and e.
3.5. Comparison of the slopes
For the two groups of G7 and NIE, the decline of fixed line penetration is small and about the same for both, but the decline of fixed line revenue is more significant for both groups with G7 (−254.170) declining much more than NIE (−86.168). In other words, the trend of traffic substitution for G7 is more significant. The growth rate of mobile penetration for NIE is higher than that of G7; however, the growth of mobile revenue for G7 is much higher than NIE. This indicates the strong growth of G7 mobile service. For ASEAN countries, the growth slope for mobile penetration (4.9824) is much greater than the slope of fixed penetration (0.7386) and thus FMS penetration substitution exists. But fixed line revenue declines in spite of the increase of fixed line penetration; therefore the FMS model also contains some traffic substitution. For BRIC countries, there is a difference between the two time periods, and penetration substitution exists in the later period. Please see Table 2.
Table 2
The penetration and revenue growth slope for four groups Group/
service
Penetration (1997–2004) Revenue (1997–2003)
Fixed growth slope Mobile growth slope Fixed growth slope Mobile growth slope
G7 −0.5901 8.8561 −254.170 4259.60
NIE −0.5945 11.1680 −86.168 617.28
ASEAN 0.7386 4.9824 −36.202 288.08
Penetration (1997–2000) Penetration (2001–2004)
Fixed growth slope Mobile growth slope Fixed growth slope Mobile growth slope
3.6. Substitution rates as a function of price differences
Substitution rates as a function of price differences are estimated from three aspects and summarized in
Table 3.
(1) The effect of reduced fixed tariff on the growth of fixed penetration (1997–2004)
Reducing the three-minute local call tariff by USD$0.001, the rate of fixed line penetration increase is−0.25% for G7,−0.40% for NIE, 0.62% for ASEAN and 1.97% for BRIC. Because of the FMS effect, both G7 and NIE's fixed penetration decreased despite the reduced tariff. Growth of fixed penetration in BRIC group is most affected by reduced fixed tariff.
(2) The effect of reduced mobile tariff on the growth of mobile penetration (1997–2004)
Reducing the three-minute local call tariff by USD$0.001, the rate of mobile penetration growth is 0.13% for G7, 0.73% for NIE, 0.26% for ASEAN, and 0.12% for BRIC. The reduced mobile tariff has helped the growth of mobile penetration of all four groups with the NIE group being most affected. (3) Substitution rates as a function of price differences between mobile and fixed tariffs (1997–2003)
The substitution rate as a function of price difference is calculated by reducing the three-minute local call tariff by USD$0.001 and dividing the slope of mobile tariff by the slope of fixed tariff. The results are 2.92% for G7, 1.03% for NIE, 1.58% for ASEAN, and 1.27% for BRIC. G7 has the highest substitution rate among the four groups. This suggests that the telecom market for G7 is the most competitive among the four groups. NIE has the highest penetration of mobile and fixed line with both service markets having reached saturation, and thus the substitution rate for the price difference is least significant.
4. Income effect
In economics the concept of disposable income means that for each household the portion of their disposable income that they spend on food, housing, clothing and transportation, the basic needs, will normally be adjusted according to the urgency of need and the actual cost. When income level is low
Table 3
Substitution ratio for the function of price difference (1997–2004)
Substitution ratio for four groups G7 NIE ASEAN BRIC
Fixed Tariff slope −0.0024 −0.0015 −0.0012 −0.0024
Absolute value for tariff slope 0.0024 0.0015 0.0012 0.0024
Penetration slope −0.5901 −0.5945 0.7386 4.7348
Penetration/tariff slope (per reduced US$ 0.001) −0.25% −0.40% 0.62% 1.97%
Mobile Tariff slope −0.07 −0.0154 −0.0189 −0.0304
Absolute value for tariff slope −0.07 −0.0154 −0.0189 −0.0304
Penetration slope 8.8561 11.168 4.9824 3.6645
Penetration/tariff slope (per reduced US$ 0.001) 0.13% 0.73% 0.26% 0.12%
and disposable income is limited and there is difficulty in meeting even the basic needs of food, housing, etc., then for the relatively higher cost and lower urgency of telecommunication, the need for it will be delayed or given up. In other words, when communication expense occupies a high proportion of disposable income then only higher income people will use this modern communication tool. In this circumstance telecommunication penetration will be difficult to expand. Only when the ratio of communication expense to disposable income is lower than a certain threshold will telecommunication service be widely used. This paper uses fixed line and mobile expenditure (excluding ARPU data) as a measurement of each individual's annual fixed line or mobile expenditure, then finds the ratio of this to annual per capita income as T/I ratio and uses these indicators to analyze the relationship among income level, telecom expenditure and telecom penetration. The effect that only when the T/I ratio is lower than a certain level will telecom penetration start to increase considerably is called ‘Income effect’.
In G7 and NIE countries each household already had more than one fixed line before 1997. Therefore, fixed line service for these two groups of countries has no such thing as an income effect, and mobile markets began to be developed after 1997. For example in G7, the T/I ratio (combined fixed line and mobile expenditure to per capita income) dropped from 5.8% in 1997 to 4.6% in 1999 and 3.7% in 2003. For NIE this ratio dropped from 8.6% in 1997 to 4.8% in 2000 and to 4.3% in 2003. Overall, in both G7 and NIE, beginning in 1999 and 2000 respectively, the T/I ratio dropped below 5%. Mobile penetration turned around and increased considerably. Within a four or five year, by 2004 mobile penetration in both groups of countries reached 77.3% and 94.5% respectively. Based on these data, we therefore deduce that for G7 and NIE 5% is the upper threshold for income effect. In other words, when the T/I ratio is lower than 5% mobile penetration will rapidly display significant growth. For details seeTables 4 and 5.
For the G7 and NIE countries, France and U.K. were the first to cross that threshold point for income effect, and mobile penetration began to take off in 1998, followed by Canada, Germany and Taiwan in 1999, then Italy, HK and Singapore in 2000, and, last, the U.S.A. in 2001. Taiwan was the first NIE country to cross the income effect threshold, and had the highest mobile penetration in the world during 2000–2003. In 2003 the T/I ratio of Japan was 5.6% and South Korea was 5.4%, still slightly higher than the upper threshold. Therefore, mobile penetration rate in Japan is low among G7 countries, only higher than that of U.S.A. and Canada. South Korea has the lowest mobile penetration of the NIE countries.
The same criteria are used to examine the relationship of income level, telecom expenditure and telecom penetration among the ASEAN and BRIC countries. In 1997 for ASEAN and BRIC countries only a few households had fixed line services, and mobile communication was even more limited. This situation caused users to make a choice between the two rather than subscribe to both. Therefore, either fixed line ARPU or mobile ARPU can be used to compare to per capita income as the reference point for the growth of penetration. Thus the T/I ratio for these countries is either fixed line expenditure to per capita income or mobile expenditure to per capita income. Then we use this ratio to find the starting point of the penetration growth, followed by a discussion of the upper threshold of income effect. For details see Tables 4 and 5. The data show that during 1997–2003, except for Russia's fixed line service, in ASEAN and BRIC countries T/I ratios are higher than 5%. This study also concludes that for ASEAN and BRIC countries one can use the 5% T/I ratio as an indicator of income effect. The turning point of income effect for ASEAN and BRIC countries is described below.
(1) The turning point of Income effect for ASEAN countries. During the period 1997 to 2003 the fixed line penetration rate for Malaysia, Thailand and the Philippines stagnated and even declined. Only Indonesia was still growing. The turning point for mobile T/I ratio decline is the year 2000 for the Philippines, Malaysia and Thailand and 2001 for Indonesia. After these years the mobile penetration rate grew considerably. The turning point for each country is further analyzed below (details see
Table 6).
Table 4
G7 Penetrations vs. ARPU/per capita GDP
G7 Service ARPU/GDP/year 1997 1998 1999 2000 2001 2002 2003
France Fixed Penetration (%) 143.8 144.0 141.4 140.5 138.7 138.5 136.7
ARPU/GDP (%) 2.1 1.9 1.9 1.8 1.7 1.6 1.1
Mobile Penetration (%) 10.0 19.2 35.5 48.9 58.4 61.6 66.5
ARPU/GDP (%) 2.6 1.6 1.1 1.1 1.2 1.2 1.1
Total ARPU/GDP 4.7 3.5 3.0 2.9 2.9 2.8 2.2
U.K Fixed Penetration (%) 135.7 137.4 141.3 144.6 146.1 140.9 138.7
ARPU/GDP (%) 2.9 2.6 2.5 2.2 2.0 1.9 1.9
Mobile Penetration (%) 15.0 25.1 45.7 72.7 77.2 83.6 90.8
ARPU/GDP (%) 2.7 1.8 1.3 0.9 1.0 1.0 1.2
Total ARPU/GDP 5.6 4.4 3.8 3.1 3.0 2.9 3.1
Germany Fixed Penetration (%) 120.7 124.0 127.6 131.7 136.4 138.9 139.5
ARPU/GDP (%) 2.2 2.1 1.9 1.7 1.6 1.6 1.7
Mobile Penetration (%) 10.1 17.0 28.5 58.6 68.1 71.6 78.5
ARPU/GDP (%) 4.7 2.9 2.3 1.8 1.6 1.6 1.5
Total ARPU/GDP 6.9 5.0 4.2 3.5 3.2 3.2 3.2
Canada Fixed Penetration (%) 170.2 173.6 178.1 182.6 177.6 171.5 169.4
ARPU/GDP (%) 2.2 2.3 2.1 2.1 2.0 2.0 1.7
Mobile Penetration (%) 14.7 18.3 22.7 28.4 34.3 38.0 42.3
ARPU/GDP (%) 2.6 2.7 2.2 2.0 1.8 1.9 1.9
Total ARPU/GDP 4.8 5.0 4.3 4.1 3.8 3.9 3.6
Italy Fixed Penetration (%) 121.3 122.6 125.1 128.9 127.3 136.2 132.3
ARPU/GDP (%) 3.3 3.9 3.6 3.1 3.0 2.7 2.6
Mobile Penetration (%) 20.5 35.7 52.4 74.2 88.8 91.6 101.8
ARPU/GDP (%) 2.8 2.1 1.5 1.3 1.3 1.3 1.3
Total ARPU/GDP 6.1 6.0 5.1 4.4 4.3 4.0 3.9
U.S.A Fixed Penetration (%) 170.3 175.2 176.4 177.3 178.6 170.9 165.1
ARPU/GDP (%) 3.8 3.7 3.6 3.5 3.4 3.1 3.0
Mobile Penetration (%) 20.4 25.2 31.6 38.9 45.1 49.1 54.7
ARPU/GDP (%) 2.0 1.7 1.7 1.6 1.6 1.6 1.5
Total ARPU/GDP 5.8 5.4 5.3 5.1 5.0 4.7 4.5
Japan Fixed Penetration (%) 145.3 147.2 151.9 131.7 127.7 125.3 122.4
ARPU/GDP (%) 3.1 3.0 3.0 2.6 2.5 2.3 2.2
Mobile Penetration (%) 30.3 37.4 44.9 50.3 57.2 62.1 66.9
ARPU/GDP (%) 3.9 3.6 3.6 3.5 3.4 3.4 3.4
Total ARPU/GDP 7.0 6.6 6.6 6.1 5.9 5.7 5.6
Average Fixed ARPU/GDP 2.8 2.8 2.7 2.4 2.3 2.2 2.0
Mobile ARPU/GDP 3.0 2.3 2.0 1.7 1.7 1.7 1.7
Fixed + Mobile ARPU/GDP 5.8 5.1 4.6 4.2 4.0 3.9 3.7
✧ Malaysia: the fixed line T/I ratio declined from 9.5% in 1999 to 8.9% in 2000. At the same time fixed line penetration grew from 19.5% to its peak of 19.7%. Without crossing the income effect threshold fixed penetration growth already showed a tendency toward stagnation. In 2003 the fixed line T/I ratio was even higher than in 1997, and the fixed line penetration rate declined to 18.1% in 2003. This conforms to the statement of Hypothesis 3. The mobile T/I ratio dropped from 12% in 1999 to 8.3% in 2000 at which time the turning point of mobile growth appears, and the mobile penetration rate increased from 12% to 21.8%. By 2003 mobile T/I ratio is 5.5%, which is close to the upper threshold, and the mobile penetration rate grew considerably to 43.9%. This is the highest penetration rate among ASEAN countries, and it conforms to the statement of Hypothesis 3.
✧ Thailand: The fixed line T/I ratio dropped from 15.9% in 2001 to 12.5% in 2002. At the same time fixed line penetration grew from 38.5% to its peak of 41.3%. This conforms to the statement of Hypothesis 3. The mobile T/I ratio dropped from 17% in 2000 to 10% in 2001, at which time the growth of mobile penetration appeared to reach a turning point when penetration increased from 4.9% to 12.1%. Both the fixed line and mobile T/I ratios are too high, and therefore penetration growth is difficult. This conforms to Hypothesis 3.
✧ Philippines: The fixed line T/I ratio dropped from 17.2% in 1999 to 13.6% in 2000. Fixed line penetration increased from 39.9% to its peak of 45.2%. The mobile T/I ratio dropped from 11.3% in
Table 5
NIE penetrations vs. ARPU/ per capita GDP
NIE Service ARPU/GDP/year 1997 1998 1999 2000 2001 2002 2003
Taiwan Fixed Penetration (%) 175.1 180.5 184.4 189.2 189.0 189.2 189.5
ARPU/GDP (%) 3.1 3.1 2.4 2.3 2.0 1.6 1.7
Mobile Penetration (%) 6.9 21.6 52.2 80.2 96.6 106.1 111.0
ARPU/GDP (%) 6.8 5.6 2.3 2.0 1.9 1.8 1.8
Total ARPU/GDP 9.9 8.7 4.7 4.3 3.9 3.4 3.5
Singapore Fixed Penetration (%) 192.6 196.5 198.0 200.8 198.0 193.2 186.0
ARPU/GDP (%) 4.1 3.8 3.4 2.3 2.3 2.3 2.2 Mobile Penetration (%) 22.4 27.9 40.9 68.4 72.4 79.6 85.5 ARPU/GDP (%) 3.5 3.4 2.2 1.4 1.6 1.7 1.6 Total ARPU/GDP 7.6 7.2 5.6 3.7 3.9 4.0 3.8 H.K Fixed Penetration (%) 185.7 188.0 190.5 191.6 189.1 178.0 171.3 ARPU/GDP (%) 3.2 3.8 3.4 2.3 2.3 2.3 2.2 Mobile Penetration (%) 34.4 48.5 64.4 78.0 84.4 91.2 105.6 ARPU/GDP (%) 4.4 3.0 2.4 2.3 2.3 2.2 2.1 Total ARPU/GDP 7.6 6.8 5.8 4.6 4.6 4.5 4.3
S. Korea Fixed Penetration (%) 151.4 146.0 146.2 153.2 155.7 156.6 152.7
ARPU/GDP (%) 2.5 2.4 3.6 3.1 2.8 2.4 2.2
Mobile Penetration (%) 15.2 30.9 50.3 57.0 61.4 67.9 70.1
ARPU/GDP (%) 6.6 4.4 3.4 3.5 3.6 3.3 3.2
Total ARPU/GDP 9.1 6.8 7.0 6.6 6.4 5.7 5.4
Average Fixed ARPU/GDP 3.2 3.3 3.2 2.5 2.4 2.2 2.1
Mobile ARPU/GDP 5.3 4.1 2.6 2.3 2.4 2.3 2.2
Fixed + Mobile ARPU/GDP 8.6 7.4 5.8 4.8 4.7 4.4 4.3
2000 to 9.8% in 2001. The growth of mobile penetration reached a turning point, and mobile penetration increased from 8.5% to 15.6%. Both the fixed line and mobile T/I ratios are too high, and therefore penetration growth is difficult. This conforms to Hypothesis 3.
✧ Indonesia: The fixed line T/I ratio was 39.5% in 1997 and fixed line penetration only 10.3%. The fixed line T/I ratio dropped to 27.5% in 1998 and fixed line penetration grew slightly to 11.3%. In 2003 the fixed line T/I ratio dropped to 15.1% and the fixed line penetration rate grew to 15.6%. The mobile T/I ratio dropped from 30.1% in 2000 to 17.3% in 2001, and mobile penetration increased from 1.7% to 2.9%. Both the fixed line and mobile T/I ratios are too high, and therefore penetration growth is difficult. This conforms to Hypothesis 3.
(2) The turning point of Income effect for BRIC. During the years 1997 to 2003 all BRIC countries, except for fixed line service in Russia, have fixed or mobile T/I ratios that are higher than the upper threshold. The turning point of each country's income effect is analyzed below (details seeTable 7). ✧ Russia: Russia's fixed line service is the only one in the BRIC countries to have income effect. During the period 1997 to 2003 the fixed line T/I ratio was lower than 5%, and fixed line penetration grew from 58.6% in 1997 to 71.3% in 2003. The mobile T/I ratio dropped from 23.8% in 2000 to 11.6% in 2001, at which time the turning point for mobile growth appeared and mobile penetration grew from 2.4% to 5.5%. But the T/I ratio is still too high and therefore penetration is still low. This conforms to statement of Hypothesis 3.
Table 6
ASEAN Penetrations vs. ARPU/per capita GDP
ASEAN Service ARPU/GDP/year 1997 1998 1999 2000 2001 2002 2003
Malaysia Fixed Penetration (%) 19.3 19.7 19.5 19.7 19.6 18.8 18.1
ARPU/GDP (%) 10.7 10.9 9.5 8.9 9.6 9.4 12.3
Mobile Penetration (%) 9.2 9.7 12.0 21.8 30.8 36.9 43.9
ARPU/GDP (%) 13.6 13.9 12.0 8.3 7.8 7.0 5.5
Total ARPU/GDP 24.3 24.8 21.5 17.2 17.4 16.4 17.8
Thailand Fixed Penetration (%) 33.5 35.0 33.4 35.7 38.5 41.3 39.6
ARPU/GDP (%) 16.4 16.1 18.6 17.4 15.9 12.5 11.0
Mobile Penetration (%) 3.4 3.7 3.8 4.9 12.1 25.7 36.2
ARPU/GDP (%) 17.4 17.2 16.8 17.0 10.0 6.4 5.6
Total ARPU/GDP 33.8 33.3 35.4 34.4 25.9 18.9 16.6
Philippines Fixed Penetration (%) 31.3 36.6 39.9 45.2 44.4 43.3 41.3
ARPU/GDP (%) 23.4 21.6 17.2 13.6 12.6 11.3 11.2
Mobile Penetration (%) 1.9 2.4 3.9 8.5 15.6 19.4 27.8
ARPU/GDP (%) 26.0 23.4 16.6 11.3 9.8 9.0 8.1
Total ARPU/GDP 49.4 45.0 33.8 24.9 22.4 20.3 19.3
Indonesia Fixed Penetration (%) 10.3 11.3 11.9 12.8 13.6 14.4 15.6
ARPU/GDP (%) 39.5 27.5 25.9 23.6 21.0 17.0 15.1
Mobile Penetration (%) 0.5 0.5 1.1 1.7 2.9 5.0 7.5
ARPU/GDP (%) 30.1 44.2 35.0 30.1 17.3 14.2 12.8
Total ARPU/GDP 69.6 71.7 60.9 53.7 38.3 31.2 27.9
Average Fixed ARPU/GDP 22.5 19.0 17.8 15.9 14.8 12.6 12.4
Mobile ARPU/GDP 21.8 24.7 20.1 16.7 11.2 9.2 8.0
Fixed + Mobile ARPU/GDP 44.3 43.7 37.9 32.6 26.0 21.7 20.4
✧ China: The fixed line T/I ratio dropped from 22.2% in 1999 to 14.6% in 2000. The growth of fixed line service shows that it reached a turning point, and the fixed line penetration rate grew from 32% to 41.6%. The mobile T/I ratio dropped from 21.4% in 2000 to 14.3% in 2001, at which time mobile growth showed a turning point, and its penetration rate grew from 6.7% to 11.3%. But the T/I ratio is still high and penetration is still low. This conforms to the statement of Hypothesis 3.
✧ Brazil: The fixed line T/I ratio dropped from 12.6% in 1999 to 10.7% in 2001. During the same period fixed penetration grew from 58.3% to 82.2%. During 2002 to 2003 instead of declining, the fixed line T/I ratio increased, and fixed line penetration dropped to 81.6% in 2002. The mobile T/I ratio declined from 12.3% in 1999 to 9.9% in 2000, at which time the growth of mobile showed a turning point, and mobile penetration increased from 9.0% to 13.6%. Because the T/I ratio is still too high therefore the penetration rate is still low. This conforms to the statement of Hypothesis 3.
✧ India: The fixed line T/I ratio was as high as 55.6% in 1998, and fixed line penetration rate was only 12.1%. In 1999 the T/I ratio dropped to 42.6% and penetration grew to 14.5%. The mobile T/I ratio dropped from 43.2% in 2002 to 25.1% in 2003, and mobile penetration increased from 0.6% to 1.2%. Because of the income effect it is difficult to grow either the fixed line or mobile penetration. This conforms to the statement of Hypothesis 3.
Table 7
BRIC penetrations vs. ARPU/per capita GDP
BRIC Service ARPU/GDP/year 1997 1998 1999 2000 2001 2002 2003
Russia Fixed Penetration (%) 58.6 60.8 60.7 61.7 63.5 68.3 71.3
ARPU/GDP (%) 1.9 3.1 4.8 3.6 2.9 2.8 4.0
Mobile Penetration (%) 0.3 0.5 0.9 2.4 5.5 12.4 25.2
ARPU/GDP (%) 13.7 32.7 49.8 23.8 11.6 7.1 6.9
Total ARPU/GDP 15.6 35.8 54.6 27.4 14.5 9.9 10.9
China Fixed Penetration (%) 21.1 26.1 32.0 41.6 50.8 61.7 72.7
ARPU/GDP (%) 26.8 26.7 22.2 14.6 12.1 10.9 8.3
Mobile Penetration (%) 1.1 1.9 3.4 6.7 11.3 16.1 20.9
ARPU/GDP (%) 59.0 40.3 27.1 21.4 14.3 12.5 8.9
Total ARPU/GDP 85.8 67.0 49.3 36.0 26.4 23.4 17.2
Brazil Fixed Penetration (%) 41.5 46.9 58.3 68.7 82.2 81.6 78.6
ARPU/GDP (%) 12.7 13.3 12.6 11.3 10.7 18.4 16.6
Mobile Penetration (%) 2.8 4.4 9.0 13.6 16.7 19.0 26.2
ARPU/GDP (%) 13.2 17.0 12.3 9.2 7.7 6.8 5.3
Total ARPU/GDP 25.9 30.3 24.9 20.5 18.4 25.2 21.9
India Fixed Penetration (%) 10.2 12.1 14.5 17.3 20.1 21.3 24.8
ARPU/GDP (%) 64.9 55.6 42.6 36.8 31.2 28.2 22.4
Mobile Penetration (%) 0.1 0.1 0.1 0.2 0.3 0.6 1.2
ARPU/GDP (%) – 98.4 124.8 120.2 79.9 43.2 25.1
Total ARPU/GDP 64.9 154.0 167.4 157.0 111.1 71.4 47.5
Average Fixed ARPU/GDP 26.6 24.7 20.6 16.6 14.2 15.1 12.8
Mobile ARPU/GDP 28.6 47.1 53.5 43.7 28.4 17.4 11.6
Fixed + Mobile ARPU/GDP 48.1 71.8 74.1 60.2 42.6 32.5 24.4
In summary, in 1997 mobile business was still in its initial stages globally, and mobile penetration in G7 and NIE, excluding HK at 34.4% and Japan and 30.3%, was between 10% and 20%. In 2003 each household in ASEAN and BRIC countries still had less than one fixed line, with the average in ASEAN being 28.7% and in BRIC 29.1%, and mobile penetration was still low, averaging 37.9% in ASEAN and 29.1% in BRIC. Over time because of market competition, decline in rates, and gradual increases in per capita income, the T/I ratios will gradually fall to less that 5%, and ASEAN and BRIC countries will cross the income effect threshold. For details seeTables 6 and 7.
The wide variation of T/I ratios and penetration indicates that Hypothesis 3 has proved to be true. Nevertheless, besides the T/I ratio, the deployment rate of fixed and mobile infrastructure most likely influences the mobile penetration. Additionally, when mobile ARPU is close to or lower than fixed line ARPU, mobile service will become affordable relative to fixed line for mass users, and mobile penetration will begin to grow considerably.
5. Results
Developed and developing economies in G7 and NIE are mostly traffic substitution whereas developing economies in ASEAN and BRIC are mostly penetration substitution. FMS patterns in developed and developing economies exhibit significant differences. This article has studied the fixed line and mobile communication growth trends of the four groups of countries and demonstrated that during the study period of 1997 to 2004 the FMS pattern for developed economies such as G7 and NIE countries which have fixed line penetration rate higher than 100% (more than one phone line per household) is mostly traffic substitution. This conforms to Hypothesis 1. For developing economies such as ASEAN and BRIC that have a lower than 100% fixed line penetration rate (less than one phone line per household) the FMS pattern is mostly penetration substitution. This conforms to Hypothesis 2. That is, when disposable income is very limited then telecom penetration will be low. Overall, G7 in the year 1999 and NIE in the year 2000 crossed the 5% income effect threshold, and mobile penetration increased rapidly. ASEAN and BRIC countries, except for fixed lines in Russia, all experienced the income effect. Therefore, any growth of telecom penetration is not easy. This conforms to Hypothesis 3. In addition, this study discovered when observing the four groups of countries that there is a tendency in FMS patterns such that the differences between G7 and NIE countries is slight, and that the basic trends of ASEAN and BRIC countries are essentially the same.
4C convergence will likely change the scope and scale of the telecom industry and influence the development of information economics of a country. Telecom policy regulators have the responsibility to think ahead, facing the trend of the convergence of fixed, mobile, wireless and broadcasting to create a fair, competitive win–win–win environment for the government, operators and subscribers. For ASEAN and BRIC countries, which mainly exhibit penetration substitution on FMS, the tradition of using fixed line network as the model for the basis of a national telecom policy has been changed.
Because most telecom regulators do not publish mobile traffic volume this study was not able to directly use the number of traffic minutes to analyze the FMS patterns. In addition, the 2004 revenue data of some of the countries cannot be obtained. These are the biggest restrictions of this study. The focus of this study is FMS patterns. In the second half of 2004 VoIP emerged and began to move into
the fixed line voice market. In the future, with possible 4C convergence, the relationship of substitution will become more complex. Diversified substitution relationships will be the direction of future research.
6. Discussion
In G7 and NIE countries FMS pattern is the substitution of second fixed lines by mobile, unlike ASEAN and BRIC countries in which first fixed lines are being substituted by mobile. Besides the diminishing price differences between mobile and fixed line services that will accelerate the mobile replacement of fixed line service, the investment patterns of the service providers and government policies can affect this too. Pure fixed line business operators facing traffic substitution may lose some traffic income but may still keep the income from the basic monthly rental fee of the basic line
[12]. But fixed line operators facing penetration substitution will lose both the basic monthly rental fees and traffic income to mobile businesses. Full-service telcos who own both fixed line and mobile business could benefit from operating synergy[9]. Telecom businesses, if they take into consideration the industry evolution in their investment planning, should have good opportunities for capturing markets.
Because broadband xDSL internet connections still rely on tradition phone lines, the newer Wi–Fi, WiMax, 3G Wireless network card, and cable modem all may create substitution for the xDSL internet connection, but the quality of wired communication is still superior to that of the wireless. Furthermore, when cable operators provide triple-play service and increase its penetration, then cable modem to fixed line substitution will be increased.
6.1. VoIP substitution
VoIP (Voice over Internet Protocal) may be divided into IP Domain VoIP (QoS) and best effort level of VoIP (no Qos), and has been introduced by the fixed operators or ISPs into the market. In addition, IP Backhaul and VoIP are also moving into mobile access. Because of the separation of the broadband network into infrastructure and application, VoIP (best effort) has become the most attractive value-added service. Free bandwidth upgrades indirectly help promote VoIP service. It is more than merely transforming the last miles; the core network must also be replaced. The IMS (IP Multimedia Subsystem) vision is one network that supports both mobile and fixed access [13]. It is foreseeable that one flat rate for unlimited calls will be the main voice service for the telcos. Around the world the major traditional telcos first introduced the enterprise of VoIP, then starting from the 2nd half of the year 2004, also introduced VoIP to the general public. American VoIP companies like Vonage (Voice Net Age) in less than two years had more than 1,200,000 subscribers by the end of 2005, and Times Warner's VoIP had 1,100,000 subscribers. Cable TV operators also joined the VoIP battle, bundling with the triple-play service of voice, data and video. The appearance of Skype in the 2nd half of the year 2004 has caused a great deal of change to the global fixed voice market. This study covers only to the end of 2004, but the 2004 revenue data cannot be obtained during the writing of this paper. We should know, however, that the fixed ARPU is not only affected by the mobile service, but also by VoIP during 2004, which is outside the scope of this study.
6.2. Wireless substitution
New Wireless technology and services are emerging. The application of wireless is blurring the distinction between fixed line and mobile, and in the future fixed line and mobile platforms may gradually converge over the IP network[14]. The FMWS (Wireless to Fixed and Mobile Substitution) are coming as evidenced by the extensively distributed Metropolis Wireless Local Area Network and the wide spread of hotspots in public places. The combination of Wi–Fi and VoIP with mobility will obviously affect fixed and mobile voice services. The maximum transfer rate of WiMax is 75 Mbit/s and the transmission range is 50 km[15]. It requires fewer base stations and the cost of base station construction is estimated to be lower that the construction of current 3G base stations. Wireless technology is one of many future visions. Others look more at the evolution to IMS networks using an evolution of CDMA (Code Division Multiple Access) and UMTS (Universal Mobile Telecommunications System) technology. Wireless replacing voice and data access are described below:
(1) Voice substitution: VoIP operators provide the integrated function of Wi–Fi and VoIP handsets and provide subscribers with unlimited VoIP calling at home and outdoors, and this will cause the obvious substitution effect for fixed and mobile voice services.
(2) Data substitution: WiMax is a new access technology which is expected to replace fixed DSL and mobile 3G data services[15]. If connection can be established using indoor Wi–Fi protocol and then connecting to outdoor WiMax stations via IEEE 802.16, this technology will potentially replace fixed DSL. Mobile WiMax supports the packet transmission ability, and some equipment manufacturers have embedded the WiMax technology in notebook, handset and PDA by implementing the IEEE 802.16e protocol. The Japan mobile operator KDDI has recently tested the video and image transit qualities of mobile WiMax and found that they are clearer than 3G W-CDMA. The maximum downward transit speed is 384 kbit/s for mobile base stations of W-CDMA, but the mobile WiMax has a higher transfer rate at 1 Mbit/s. Nevertheless, if the telcos can maintain their position by offering digitalized movie and music content service on 3G mobile, they can counter the inroad threats made by WiMax, and gradually meet the customers' demand for high-speed bandwidths by using Fiber-Optic network to replace DSL network and thus diminish the threat of being substituted by the technological development of WiMax.
6.3. Future infrastructure composition
Because broadband xDSL internet connections still rely on tradition phone lines, the newer Wi–Fi, WiMax, 3G Wireless network card, and cable modem all may create substitution for the xDSL internet connection, but the quality of wired communication is still superior to that of the wireless. Furthermore, when Cable operators provide triple-play service and increase its penetration, then cable modem to fixed line substitution will be increased. But if the fixed line monthly service fee is low enough, fixed line subscribers will still hold onto one phone line probably for‘lifeline’ emergency services.
FMS and FMWS (fixed mobile to wireless substitution) will influence the future composition of telecommunication infrastructure networks for every country. Because by means of mobile or wireless access the telecom operators could also meet the universal service of obligation (USO), the regulators
have the responsibility to use policies with the future in mind to guide not only the market opportunities created by the advancement of technology for the operators but also the development of national infrastructure networks. Wireless broadband may take advantage of lower cost and may also combine with IP network to substitute the utilization of voice and Internet access to a certain degree. The possible substitution patterns of FMS and FMWS will be similar to the Chinese proverb about the relationship of the mantis stalking the cicada, unaware of the oriole following behind. The role of the regulator making a policy decision is like a hunter deciding who will live or die in the struggle of telecom evolution. It is foreseeable that the distributed ratio for the composition of the future communication infrastructure will display a significant difference according to the level of per capita GDP per country. Because the G7 and NIE countries have mainly experienced traffic substitution, and their fixed and mobile infrastructure networks are already completed, therefore the allocation ratio of Wireless network is expected to be limited.
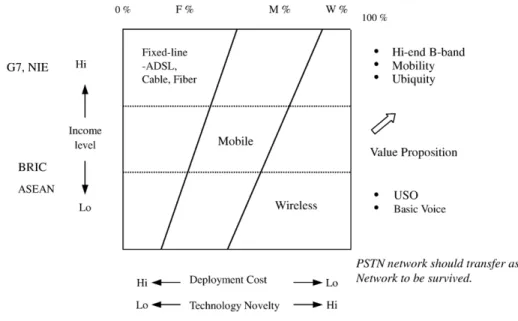
It is worth noting that the developing countries have mainly experienced penetration substitution, and if the demand for data besides voice arises in the future, the mobile data bandwidths will be inadequate to meet the demand for data transmission. When this moment arrives, will subscribers go back to using the fixed line IP network thus reviving the stagnant or dropping fixed penetration, or will they turn to new wireless technology? It is expected that the allocation cost for WiMax will be lower compared to the traditional PSTN network, but will the new wireless technology be extensively adopted by the developing countries which are still at a lower rate of fixed penetration? Or, if the allocation ratio for mobile and wireless infrastructure is higher than for fixed network, will that influence the composition of the basic communication infrastructure network and the dynamic for market competition? Please see Fig. 9. Separate data revenue should be used for the study of multi-element substitution. All of the above questions deserve further research.
Appendix A. Referred regulators websites
Countries Regulator websites
Brazil www.anatel.gov.br Canada www.ic.gc.ca China www.mii.gov.cn Finland www.mintc.fi France www.anfr.fr Germany www.regtp.de H.K www.ofta.gov.hk India www.trai.gov.in Indonesia www.depub.go.id Italy www.communicazioni.it Japan www.soumu.go.jp Malaysia www.mcmc.gov.my Philippines www.dotcmain.gov.ph Russia www.minsvyaz.ru S. Korea www.kcc.go.kr Singapore www.ida.gov.sg
Taiwan, R.O.C www.dgt.gov.tw
Thailand www.mict.go.th
U.K www.ofcom.org.uk
U.S.A www.fcc.gov
Appendix B. Fixed domestic exchanged lines (unit: 000)
Countries/year 1997 1998 1999 2000 2001 2002 2003 2004 U.S.A 172,452 179,822 183,521 187,002 190,994 186,232 181,600 180,102 Canada 18,660 19,294 20,051 20,840 21,126 20,622 20,664 20,068 Japan 65,735 67,488 70,530 61,960 61,330 60,770 60,575 59,610 Germany 45,200 46,530 48,210 50,220 52,450 53,780 54,250 54,550 France 33,700 34,099 33,888 34,081 34,084 34,124 33,905 33,910 Italy 25,698 25,986 26,502 27,300 27,353 27,142 28,500 26,596 U.K 31,879 32,829 34,021 35,047 35,660 34,517 34,121 33,700 H.K 3647 3729 3846 3946 3926 3842 3820 3780 Singapore 1685 1778 1851 1936 1948 1934 1897 1863 Taiwan 10,862 11,500 12,044 12,642 12,858 13,099 13,355 13,530 S. Korea 20,422 20,089 20,518 21,932 22,725 23,257 22,877 22,800 Malaysia 4223 4384 4423 4628 4710 4670 4572 4448 Thailand 4827 5038 5216 5591 6049 6566 6305 6478 Philippines 4500 5300 5987 6909 6939 6914 6693 6473 Indonesia 4982 5572 6080 6662 7219 7750 8479 9989 Brazil 17,039 19,987 24,985 30,926 37,430 38,800 39,200 37,188 China 70,310 87,421 108,715 144,829 180,368 214,420 263,000 316,000 India 17,802 21,594 26,511 32,436 38,536 41,420 48,917 50,385 Russia 28,250 29,246 30,949 32,070 33,278 35,500 36,993 39,196
Appendix C. Mobile subscribers year by year (unit: 000) Countries/year 1997 1998 1999 2000 2001 2002 2003 2004 U.S.A 55,312 69,209 86,047 109,478 128,375 140,767 158,722 175,000 Canada 4266 5365 6911 8727 10,862 11,861 13,222 14,984 Japan 38,254 47,308 56,846 63,883 72,797 79,082 85,381 90,187 Germany 8276 13,913 23,446 48,202 55,126 59,128 64,800 71,316 France 5817 11,210 21,434 29,052 36,997 38,585 41,683 43,831 Italy 11,738 20,489 30,296 42,246 51,246 53,003 55,918 57,171 U.K 8841 14,878 27,185 43,452 46,283 49,677 52,984 61,241 H.K 2230 3174 4275 5234 5702 6219 7194 8158 Singapore 849 1095 1631 2747 2992 3313 3578 3861 Taiwan 1492 4727 11,541 17,874 21,633 23,905 25,090 21,528 S. Korea 6879 14,019 23,443 26,816 29,046 32,342 33,592 35,050 Malaysia 2000 2150 2717 5122 7385 9053 11,124 14,611 Thailand 1977 2204 2339 3056 7550 16,117 22,825 27,625 Philippines 1344 1734 2850 6454 12,159 15,201 21,860 32,936 Indonesia 916 1066 2221 3687 6415 11,340 17,888 30,081 Brazil 4550 7368 15,033 23,188 28,746 34,881 46,373 65,606 China 13,233 23,863 43,296 85,260 144,820 206,620 269,953 334,824 India 882 1195 1400 1884 3557 6431 12,687 26,155 Russia 485 747 1371 3263 7750 17,609 36,890 74,350
Appendix D. Fixed telephony service revenue (US$ mn)
Countries/year 1997 1998 1999 2000 2001 2002 2003 U.S.A 198,000 210,000 220,010 230,762 227,113 210,820 205,863 Canada 8772 9051 8553 9207 8536 8231 8110 Japan 45,527 42,649 51,264 50,753 44,689 43,100 42,078 Germany 25,778 26,027 23,063 19,358 19,107 21,226 26,292 France 17,141 16,421 16,024 13,423 12,833 13,194 12,930 Italy 17,006 20,903 19,700 15,978 15,438 15,400 15,843 U.K 18,586 20,241 20,458 18,788 16,957 17,612 18,361 Average 47,259 49,328 51,296 51,181 49,239 47,083 47,068 H.K 3166 3564 3,400 3183 2,902 2,744 2,428 Singapore 1741 1428 1312 1041 934 926 894 Taiwan 3969 4455 3899 4087 3278 2615 2859 S. Korea 5858 3736 7166 7467 6411 6498 6354 Average 3683 3296 3944 3945 3381 3196 3134 Malaysia 2082 1592 1519 1588 1663 1692 2316 Thailand 2038 1528 1984 1966 1812 1676 1609 Philippines 1198 1025 1055 932 804 764 744 Indonesia 2110 715 1085 1163 1055 1133 1239 Average 1857 1215 1411 1412 1333 1316 1477