A Multilayer Data Copy Test Data Compression
Scheme for Reducing Shifting-in Power
for Multiple Scan Design
Shih-Ping Lin, Chung-Len Lee, Senior Member, IEEE, Jwu-E Chen, Ji-Jan Chen, Kun-Lun Luo, and
Wen-Ching Wu
Abstract—The random-like filling strategy pursuing high com-pression for today’s popular test comcom-pression schemes introduces large test power. To achieve high compression in conjunction with reducing test power for multiple-scan-chain designs is even harder and very few works were dedicated to solve this problem. This paper proposes and demonstrates a multilayer data copy (MDC) scheme for test compression as well as test power reduction for multiple-scan-chain designs. The scheme utilizes a decoding buffer, which supports fast loading using previous loaded data, to achieve test data compression and test power reduction at the same time. The scheme can be applied automatic test pattern gen-eration (ATPG)-independently or to be incorporated in an ATPG to generate highly compressible and power efficient test sets. Experiment results on benchmarks show that test sets generated by the scheme had large compression and power saving with only a small area design overhead.
Index Terms—Circuit testing, low-power testing, test data com-pression, test pattern generation.
I. INTRODUCTION
A
SYSTEM-ON-A-CHIP (SoC) chip, containing many modules and intellectual properties (IPs) on a single chip, has the advantage of reducing cost on fabrication, but suffers the disadvantage of increasing cost on testing due to increased complexity of test generation and large volume of test data. In addition, large amounts of switching activity of scan test beyond that of the normal operation leads to power problems. Therefore, energy, peak power, and average power during testing should be controlled to avoid causing chip malfunction and reducing reliability for circuit-under-test (CUT).To cope with the problem of huge test data, one can expand the capability of an automatic test pattern generation (ATPG) tool to generate a reduced number of test patterns or to em-ploy test compression techniques to compress patterns to re-duce the memory requirement on the automatic test equipment (ATE) and the test time. Many compression techniques and ar-chitectures have been proposed and developed. Among the re-search works, they can generally be classified into two cate-Manuscript received March 6, 2006; revised August 30, 2006 and January 11, 2007.
S.-P. Lin and C.-L. Lee are with the Department of Electronics Engineering, National Chiao Tung University, Hsinchu 30050, Taiwan, R.O.C. (e-mail: gis89583@cis.nctu.edu.tw; cllee@mail.nctu.edu.tw).
J.-E. Chen is with Department of Electrical Engineering, National Central University, Chung-li 32054, Taiwan, R.O.C.
J.-J. Chen, K.-L. Luo, and W.-C. Wu are with the SoC Technology Center, Industrial Technology Research Institute, Hsinchu 30050, Taiwan, R.O.C.
Digital Object Identifier 10.1109/TVLSI.2007.899232
gories: the ATPG-independent approach and the
ATPG-depen-dent approach. For the compression methods of the former
cat-egory, in the traditional design flow, they are applied after test patterns have been generated. This type of approaches usually encodes test pattern by utilizing don’t care bits or makes use of regularity of test patterns to reduce test data volume. One type of these compression methods is to use a codeword, for example, Golomb codes [1], selective Huffman codes [2], VIHC codes [3], and FDR codes [4], etc., to represent a data block. A com-prehensive study on these compression schemes was presented in [5] and the maximum achievable compression of the methods of this type is bounded by the entropy within test data [5]. An-other type of compression methods is to compress test data uti-lizing the bit correlation of test vectors to obtain minimum bit flips between consequent test patterns [6]–[8] to achieve test compression. Selective encoding compresses scan slices using slice codes, which mix of control and data codes, to reduce test data volume [9].
For the methods of the ATPG-dependent category, test com-pression procedure is incorporated during the stage of test gen-eration. As it was reported, test patterns for large designs have very low percentage of specified bits, and by exploiting that, high compression rate can be achieved. For example, the hy-brid test [10] approach generated both random and deterministic patterns for the tested chip while using an on-chip linear feed-back shift register (LFSR) to generate the random patterns. The broadcast (or Illinois) approach [11] used one pin to feed mul-tiple scan chains. In [12] and [13], a combinational network was used to compress test cubes to conceal large internal scan chains seen by the ATE. Also, several efficient methods such as recon-figurable interconnection network (RIN) [14], SoC built-in self test (BIST) [15], and embedded deterministic test (EDT) [16], etc., were proposed to achieve test data reduction by using an on-chip circuitry to expand compressed data to test patterns. Tang et al. [17] also proposed a scheme to use switch configura-tions to deliver test patterns and provided a method to determine the optimum switch configuration.
To cope with the problem of test power, two approaches, namely, using the design for testability (DFT) circuitry (scan ar-chitecture modification) [8], [18], [19] and reducing transitions during shift by filling unspecified bits of test cubes [20]–[23], are usually used to control test power. Reference [20] did a survey on this topic. For the scan architecture modification tech-niques, power reduction is achieved at the cost of area or routing overhead. Of the approaches, some works, for example, scan 1063-8210/$25.00 © 2007 IEEE
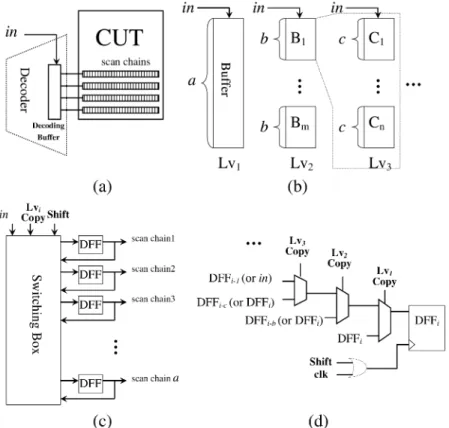
Fig. 1. (a) Proposed decoding architecture. (b) A decoding buffer witha DFFs and its multilayer organization. (c) A switch box is used to support the two operations of a decoding buffer. (d) The switching box implementation.
cells reorganization, adapting scan architecture [18], and gated clock [19], focused on reducing test power alone. However, those techniques are not suitable for protected IP cores. Some other works, for examples, low-power test using Golomb [21], FDR with minimum transition filling (MTF) [22], ARL [23], and mixed RL-Huffman [24] focused on reducing test power and test volume simultaneously. However, they all targeted at single-scan-chain designs and required heavy synchronization between decoders and the ATE. Besides, they are not really low-power test methods since they use a higher speed scan clock. In targeting at test compression for multiple-scan-chain designs with test power consideration, there were only a few works. Ref-erence [25] used the LFSR reseeding to hold flag shift register (HF-SR) to reduce test power and [26] proposed a flip configu-ration network (FCN) to inverse the scan cells when sending to CUTs.
In this paper, we propose a compression method, multilayer data copy (MDC), for multiple-scan-chain designs to reduce the test data volume and test power simultaneously. The scheme is simple and easy to be implemented without requiring any knowledge of coding theory. The scheme can be used in con-junction with an ATPG program to generate test patterns with high compression rate and good test power performance. In Section II, the proposed encoding scheme MDC and the ar-chitecture of the decoder are first described. In Section III, a complete analysis of achievable volume and power reduction for the proposed scheme with respect to different organizations of the decoding architecture is included. In Section IV, the pro-posed ATPG-dependent tool, which considers simultaneous test data and power reduction for multiple-scan-chain designs, is de-scribed. Experiment results on many benchmark and large-scale
circuits are shown in Section V to compare and evaluate the pro-posed scheme with other test compression methods. Finally, a conclusion is given in Section VI.
II. PROPOSEDMDC SCHEME
The proposed MDC scheme is shown in Fig. 1(a). A decoder, which has a decoding buffer to drive multiple scan chains, is used to decode compressed data. The decoding buffer is com-posed of a set of D flip-flops (DFFs) implicitly configured in a multilayer architecture of layers by way of a switching box. Take a decoding buffer of DFFs, which drive scan chains of a CUT, as an example. If the DFFs are able to be configured into three layers, i.e., , then for layer one, , configuration, DFFs are configured into one group. For layer two, DFFs are implicitly grouped into groups of which each group has DFFs so that . For layer three, , configuration, the DFFs of each group of are further grouped into groups of which each group has DFFs and . Fig. 1(b) con-ceptually shows such a multilayer structure. More layers can be continually constructed as necessary. The decoding buffer has two modes of operation: copy or shift. For the shift mode, the DFFs act as shift registers and data is loaded into DFFs serially bit by bit from the in pin. For the copy mode of each layer, data of DFFs of each group is “copied” into the DFFs of the next group in “block.” It is noted that during the decoding buffer is acting, the current layer is also changing with it operations. Only the last layer needs shift mode while other layers need only copy mode. The switching box shown in Fig. 1(c) is used to support these operations during the decoding process and its implemen-tation is shown in Fig. 1(d) for one of the DFFs. For the copy mode, data loading is fast and this reduces test time as well as
Fig. 2. Example to demonstrate shift and copy operations.
test volume. Once number of DFFs of the buffer are loaded with bits of test patterns, we say one slice is ready and the de-coder will shift the slice to the scan chains of the CUT.
In Fig. 2, there is a test cube of the length of 16 bits to be loaded into a scan design, which has eight scan chains. For this case, the shift length for shifting the test cube is two. Now, sup-pose that a three-layer buffer organization, that is: , and , is used. As the loading starts, for the first step, the first bit “0” is loaded into the first DFF of the buffer. At the second step, the following 1 is loaded. At the third step, copy operation is applied to since the following third and fourth bits are XX, which are compatible with the first two loaded bits 01. After the copy operation is done, the two don’t care bits be-come the same as the two prior bits 01. At the fourth step, the
copy operation is again applied to since the following four bits 0XX1, are compatible with the previously loaded four bits 0101. After this, we obtain a set of test data of 01010101 in DFFs. Now, we say that a slice of test data is resident in the buffers and this slice will be loaded to eight scan chains. Since the next 8-bit slice is also compatible with the current slice, a
copy operation is applied to to load the next 8-bit slice into the buffers. In this way, test data can be fast loaded into a CUT.
Encoding process for MDC is very simple. Starting from layer one, at each layer, the test data is checked if the copy operation is applicable. If yes, a control bit “1” is added to the encoded data; otherwise, a “0” is added to the data to indicate that there is no compatible data and current layer advances to the next layer. The previous action is repeated until the last layer is reached while no copy is applicable. At this moment, the shift operation is entered and the original raw test data of bits are appended to the encoded data, where is the number of bits of the last layer. After that, the current layer may change; and the previous encoding process then repeats iteratively. The example in Fig. 2 is used again to demonstrate this encoding process. In the beginning, we check if the copy operation can be applied to current layer . Since for this case, the buffer does not have any data, the copy operation cannot be applied to the first layer. Thus, we enter and then and copy operation still cannot be applied for them. Therefore, three 0’s are added to the encoded data. Following the two times of the
shift operation , the decoder loads the first two bits 01 into the buffer. After that, three times of the copy operation are applied and the test cube is completely loaded with all don’t
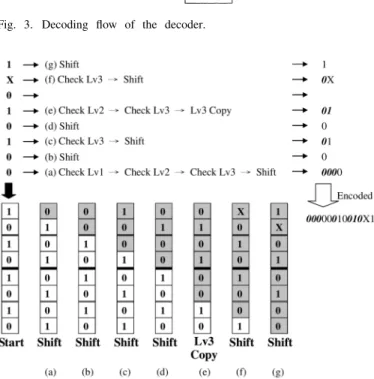
Fig. 3. Decoding flow of the decoder.
Fig. 4. Another example to show how to encode slices using shift and
copy operations.
care bits filled. The final encoded data is 00001111, where the first three control bits “000” mean no copy applicable, the forth bit “0” and the fifth bit “1” are raw data and the last three control bits are for the copy operation. Compared to the original 16-bit test data, a test data reduction of 50% is obtained.
The decoding flow of our decoder is shown in Fig. 3, where data is loaded from in. For this decoding flow, the following three notes are given: 1) Lv means “layer”; 2) After a copy or shift operation, the current layer may change to other layer; that is why the task “get current Lv” is included in the figure. For hardware implementation, only a counter is needed to trace the number of bits shifted into the buffer for the current slice and another counter to record the current layer; and 3) is the number of DFFs of the last layer, which is two for the example in Fig. 2.
Another example is shown in the following to explain the encoding and decoding process more clearly. In Fig. 4, a new slice having 8 bits 1X010100 is to be shifted into the decoder’s buffer which already has previous data 10101010. The checking operations according to the MDC encoding procedure for each bit are shown in Fig. 4. In Fig. 4, the encoded data after each checking operation are also shown where bits in italic are control bits and others are data bits. For the first bit 0, it is first checked if copy for is applicable. Since the answer is no, the layer
Fig. 4(e), the decoder first checks then and applies
copy operation since the following two bits “10” are compatible
with the last-shifted two bits 10, of the buffer. Finally, for the next two last bits, the decoder checks and applies the shift operations. The final encoded data is 00000010010X1 which consists of three shift and one copy operations.
It is noted that when one slice is ready, the decoder shifts the slice into scan chains by asserting the clock of scan flip-flops. Therefore, unlike [11]–[17], our decoding process does not load scan chains at every test cycle. Also, unlike [1]–[4], synchro-nization overhead does not exist in our approach since the ATE has not been stopped during the entire decoding process.
III. EFFICIENCYANALYSIS FORMDC
A. Compression Analysis
The compression of MDC relies on the copy operation to quickly load data to the buffer. The lower layer the copy oper-ation can be applied, the larger gain can be obtained. However, increasing the group size at layer does not necessarily obtain a high compression rate since the probability that a larger size group is compatible with another group decreases. Therefore, the relation between the size of groups, the number of layers and the achievable compression should be analyzed.
Before that, several terms are defined as follows: total number of bits in test sets;
total number of layers; th layer, where ;
group size (number of bits) at layer ;
number of groups that cannot be applied copy at layer ;
specified bit density of test set.
The total data volume DV can be derived as follows. For the first layer, it has groups and needs bits to present whether the copy operation is applicable or not for each group. Given groups are not copied at layer one, as for the second layer, it thus has groups and, therefore,
needs bits. Finally, DV is
In the formula, only is to be determined. To determine , we start from analyzing the probability that a group is compat-ible with its succeeding group, i.e., the probability that its suc-ceeding group can be applied copy operation. Given a specified bit density , the probability that two bits are incompatible is when the first bit is a 1 and the second bit is a 0 and vice versa.
Therefore, it is . So the
probability that two bits are compatible is . The probability that a group having bits can be applied copy
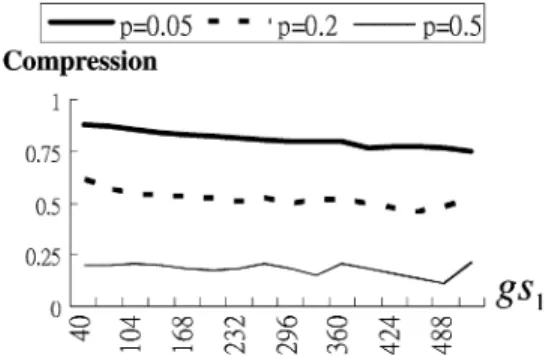
Fig. 5. Compression under two parameters:gs and p.
operation is . Thus, is given by
A larger results in large data volume DV. depends mostly on but their relationship is implicit. An experiment was then run to find their relationship: 500 random test patterns were generated for a scan design of 1024 scan cells. The compression is defined as
Compression
For a two-layer buffer and , Fig. 5 shows the com-pression result on different and . It can be seen that the fi-nally obtained compression is a strong function of the bit density probability but a weak function of . Also, for the number of times of applying copy to and , it was found that for a larger , it had fewer times of copy at (larger ), but more times of copy at , therefore, resulting in similar DV.
B. Scan-in Power Reduction Analysis
In this section, it is to investigate the test power reduction of this scheme.
In order to obtain large data reduction, we like to apply more
copy operations at each layer. Especially, if we apply more copy operations at layer one, we not only achieve data volume
compression but also obtain scan-in power reduction because no transition between the coping slice and the copied slide is involved. However, as shown in Section III-A, to increase the probability of applying the copy operation at layer one, the group size can not be too large. Again, an experiment was done to investigate the relationship between the group size and the achieved power reduction using the above randomly generated test set. The results are shown in Fig. 6, where (a) is the plot of WTC (weighted transition counts: the total number of transitions during scan test) [23] with in terms of and (b) is the plot of peak transitions with in terms of . From Fig. 6(a), it can be seen that a larger number of scan chains reduces the total energy (WTC). However, from Fig. 6(b), it is seen that for a larger group size of the first layer, for which less
Fig. 6. Plots of (a) weighted transition counts (WTC) and (b) peak transitions, with respect togs in terms of p.
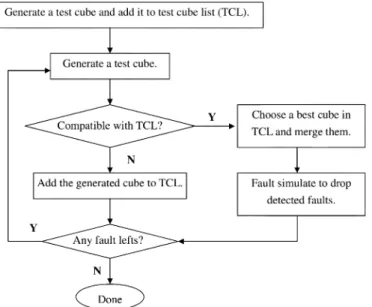
Fig. 7. Proposed flow of an ATPG, MDCGEN, incorporated with MDC strategy.
to simultaneously reduce DV and the peak power, a moderate group size for the first layer should be chosen.
Also, from Fig. 6(b), we can see that, for the MDC scheme, it can reduce test peak power for small (usually smaller than 5% for real designs). This is a good advantage over those of the con-ventional ATPG-dependent LFSR-based [15], [16],XOR-based decompression network [12], [13] methods and [17], etc., where don’t care bits of test patterns are essentially filled with random-like fillings, resulting in large test power [25], [27], [28]. For this type of filling, it was reported that average transitions are usu-ally about , where is the number of scan cells [27]. As for the MDC scheme, for instance, for a with 40 scan chains, the amount of peak power is about 200, which is only about 30% of that of the randomly generated test set.
IV. PATTERNGENERATORWITHMDC
The MDC strategy can be incorporated with an ATPG to gen-erate test patterns which are dedicated to be compressed with the MDC technique. The test patterns so obtained will provide high compression as well as test power reduction efficiency. Fig. 7 shows such an ATPG: MDCGEN. The ATPG starts with gen-erating a test cube and uses a test cube list (TCL) to store all generated test cubes. A test cube is generated targeting at one of remaining undetected faults. The generated cube is checked if it is compatible with cubes in the TCL. All compatible cubes will be compared and the best one is selected. That is, the num-bers of copy operations reduced for each compatible cube in the
TCL before and after merging it with the generated test cube is recorded. Then the cubes with the least reduced number of copy operations are chosen. These cubes are further checked to be se-lected and the cube that, after being merged with the generated cube, has the minimum resulting switching activity is selected. The selected best cube is then merged with the generated cube. After that, fault simulation is conducted and the faults detected by this merged cube are dropped from the fault list. If the gener-ated test cube is not compatible with any cube in the TCL, it is added to the TCL. This flow continues until all faults are tried.
In implementing the previous flow, to further reduce test data volume and test power, a special pattern generation strategy can be employed. That is, after the architecture of decoding buffer is decided, the pattern generation phase employs a random pat-tern generation step. For this step, a set of random bits is gen-erated for the first slice but for all following slices the patterns are copied from the previous slices, respectively. In this way, each random pattern has very high compressibility and low test power. For a scan design with scan cells and a two-layer de-coding buffer ( architecture), the maximum encoded data volume for each random pattern is only
bits and the peak power for each random pattern has no more than transitions and the average power is even lower. This is a great saving when compared with a traditionally generated pat-tern, for which the average transition is and the peak power is even higher [27].
As compared to other ATPG-dependent methods [12]–[17], MDCGEN has the following advantages which make it efficient in generating good test patterns for compression and power re-duction. First, it is not necessary to solve a set of linear equations to find the compressibility between the decoder and test cubes generated from ATPG. It only involves a procedure of compat-ibility checking and switching activity counting and this has a small computation overhead. Second, when some test cubes cannot be compressed by decoders/decompressors, ATPGs of conventional approaches have to iteratively try or change con-figuration of decompressors. For MDC, it is easy for the de-coder to apply any test cube and not necessary to change any configuration even with fully specified patterns. Third, the con-ventional ATPG-dependent methods fill unspecified bits only targeting test compression, and the fillings are basically of the random-like filling strategy, resulting in large test power [25], [27], [28]. However, for MDC, its intrinsic nature produces low power patterns since it adopts a low-power filling mechanism for multiple scan chains. This approach thus has the advantage of simultaneously targeting test data and test power reduction for multiple-scan-chain designs without CUT modification.
V. EXPERIMENTALRESULTS
A. Compression Comparison
To evaluate the efficiency of the proposed scheme, we have implemented the proposed MDC technique both in the
ATPG-independent way (denoted as MDC), i.e., Mintest test
sets were obtained first and then the MDC scheme was applied to compress the tests, and in the ATPG-dependent way (denoted as MDCGEN), i.e., the MDC was considered at the same time during the test generation process. The implementation
TABLE II
COMPRESSIONCOMPARISONBETWEEN THEMDC SCHEME ANDOTHERCOMPRESSIONMETHODS ONMINTESTTESTSETS
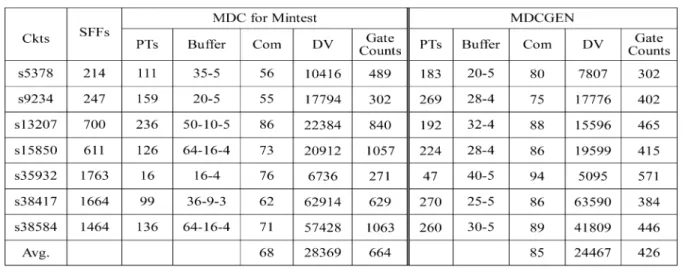
was in C++ and applied to several benchmark circuits. For the MDCGEN, test sets were generated with the same fault coverage as that of a commercial tool Syntest [29]. The com-pression results are shown in Table I. In the table, we present SFFs (number of scan cells), PTs (number of test patterns), buffer organization, Com (Compression), DV (compressed data volume) and Gate Counts (equivalent gate counts for hardware overhead) for each circuit. We see that, in general, the average DV of MDC and MDCGEN are quite comparable. However, as it can be seen later, MDCGEN is more efficient also on test power reduction since in an ATPG-independent way, test set tends to have higher specified bit density, consequently less flexibility for power reduction.
1) ATPG-Independent MDC for Mintest Test Sets: For the
MDC, we used the Mintest test sets and compressed them using the MDC strategy for the benchmark circuits and compared the results with some previously published results as shown in Table II. In the table, the compression percentages of each pub-lished method and the MDC scheme is listed and the bold num-bers are the best results among all the methods. It can be seen that our MDC obtained the best compression results in four out of six circuits and in the average of the six circuits.
2) ATPG-Independent MDC: For the MDCGEN, the
com-pressed results are compared with those of some published
ATPG-dependent methods as shown in Table III. In Table III,
switch configuration [17] has the best compression results. MDCGEN has slightly larger final compressed data volume than those of Unified Network but better results than those of SCC except for circuit s38584. However, it is to be mentioned that MDCGEN targets simultaneous test data and power reduc-tion. Even so, the test volume obtained by MDCGEN is still comparable with those of SCC and Unified Network.
B. Scan-in Power Comparison
In this section, we compare test power for the previous test sets. In the text which follows, the power estimation for av-erage power is the avav-erage number of transitions of all patterns; peak power is the maximum transition among all patterns; and total power is the total transitions during scan shift for all pat-terns. Total power or test energy is the same as WTC defined in [21]–[24]. However, average power and peak power use “tran-sition” rather than use WTC. More formally, and are the number of test patterns and scan chain length, respectively, and
( ) is the th test pattern , where
is the first bit, as defined in [24]. The number of transitions , for is
TABLE III
DATAVOLUMECOMPARISONBETWEENMDCGENANDOTHERATPG-DEPENDENTMETHODS
TABLE IV
NORMALIZED(A) AVERAGE, (B) PEAK,AND(C) TESTENERGYCOMPARISONSBETWEENDIFFERENTCOMPRESSIONMETHODS
TABLE V
NORMALIZED(A) AVERAGE, (B) PEAK,AND(C) TESTENERGYCOMPARISONSBETWEENMDCGEN ANDRANDOMPATTERNS[12]–[17]
Weighted transition counts , for is
Then
Average Power Peak Power
Total Power(Energy)
1) ATPG-Independent MDC for Mintest Test Sets: On test
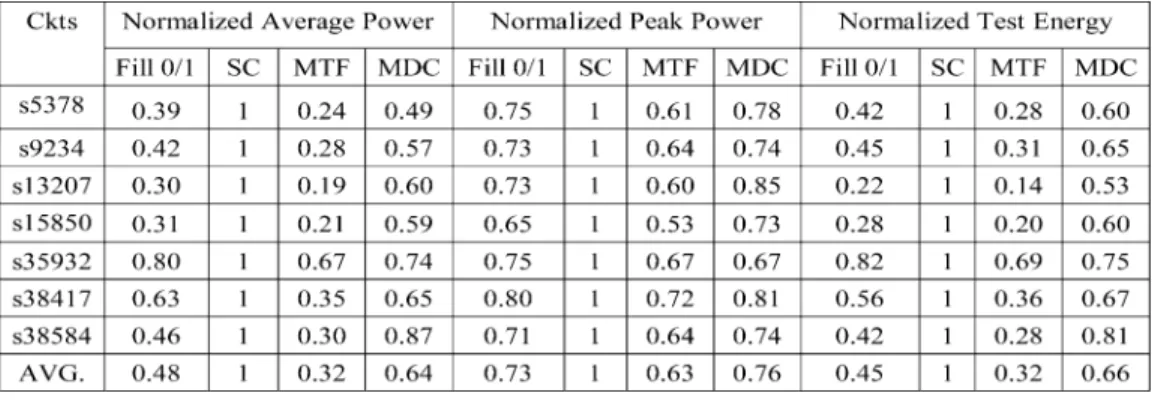
power, we first present results of the MDC for Mintest test sets. Table IV shows the results on average and peak power (average and peak transitions) during pattern scanning in and the total en-ergy consumption WTC, during test of the MDC strategy with those of three filling strategies, namely, fill (used in [1], [3],
[23], [24], [30]), SC filling [2], and MTF. All the values are nor-malized with respect to the maximum values, which are of the SC filling strategy, among those methods. For the experimental data, the same number of scan chains and test patterns are used for each method. In the table, MTF represents the achievable lowest power. It is seen that SC has the largest average/peak power and energy. For MDC, it is slightly higher than that of the “fill 0/1” strategy on the scan power and is higher than MTF, which is the lower bound. Overall, MDC has best compression with only little increased test power compared with “fill 0/1.”
2) ATPG-Independent MDC: Table V shows the similar plots
for the ATPG-dependent MDCGEN on scan-in average/peak power and the total test energy with respect to other
ATPG-de-pendent methods [12]–[17]. For those methods, the number of
TABLE VII
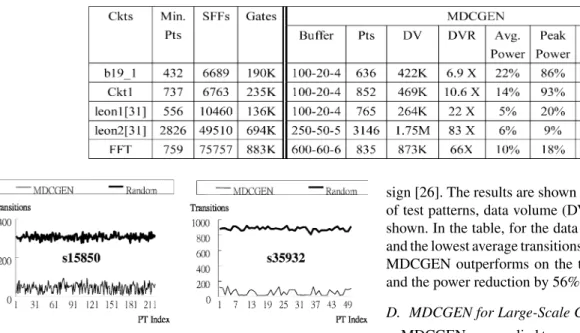
COMPARISON OFDATACOMPRESSION ANDTESTPOWER FORMDCGENONLARGE-SCALECIRCUITS
Fig. 8. Power profiles for each pattern of two circuits: s15850 and s35932 for MDCGEN and random-filling patterns.
to be the same with ours and, as mentioned in Section III-B, the “random-filling” strategy was used in generating test patterns. The table shows that MDCGEN is very efficient in reducing power. In average, it reduces average power, peak power, and test energy to only 14%, 35%, and 17% of those of the random fill. In Fig. 8, it is also shown the detailed simulated scan-in transitions for each pattern for circuits s15850 and s35932 for MDCGEN and random patterns, respectively. From that figure, it is seen that MDCGEN suppresses the scan-in power for all generated patterns for circuits.
C. Comparison of MDCGEN With Another Low-Power Test Compression Method
We also compare MDCGEN with a published work on the low-power test compression method for multiple-scan-chain
de-sign [26]. The results are shown in Table VI, where the number of test patterns, data volume (DV), and average transitions are shown. In the table, for the data of FCN, the best compression and the lowest average transitions of [26] are listed. It is seen that MDCGEN outperforms on the test data compression by 30% and the power reduction by 56% in average over those of FCN.
D. MDCGEN for Large-Scale Circuits
MDCGEN was applied to some larger circuits of higher com-plexity and the results are shown in Table VII. The SFFs, gate numbers and “Min. Pts” (the minimal number of patterns ob-tained from a commercial ATPG [29] with the largest com-paction) for each circuit are listed. For MDCGEN, Buffer is the buffer structure used, Pts are the number of patterns, DV is the data volume, DVR is the data volume reduction. Average power, Peak power, and Energy are the scan-in powers and energy for the Pts with respect to “Min. Pts,” respectively. Here, DVR is defined as
Significant data volume reduction was obtained for each circuit in the table. For example, for circuit leon2, 83 times of data volume reduction was obtained. For the test power and energy reduction, MDC exhibited very well except for Peak Power of b19_1 and Ckt1 for which we put more emphasis on DVR of MDCGEN instead of power reduction.
TABLE VIII
OVERALLCOMPARISONBETWEEN THEPROPOSEDSCHEME ANDOTHERSCHEMES
For the previous circuits, the Synopsys Design Compiler was used to evaluate the area overhead (Area % in Table VII) for the added decoders with decoding buffer for the MDC scheme and it was found that they all were about 1% of the original circuits.
VI. CONCLUSION
In this paper, we proposed and demonstrated a new simple yet efficient test encoding scheme: MDC, for test compression and power reduction for multiple-scan-chain designs. The scheme adopts a simple buffer which can be flexibly organized in a mul-tilayer structure in conjunction with a simple coding strategy to fill unspecified bits of test patterns to achieve power reduc-tion. A layer copying mechanism, which reduces transitions be-tween neighboring slices, makes the scheme inherently power efficient. The scheme can be incorporated into an ATPG pro-gram to generate test patterns both volume and power efficient. The scheme had been applied to some benchmark and large size circuits to show that it achieved not only high compression rate for test patterns but also low test power. In addition, only one scan-in pin is required to support large number of scan chains. This facilitates the use of a low-cost ATE for this scheme. Also, the scheme is very flexible to be used: either in an
ATPG-inde-pendent way or in an ATPG-deATPG-inde-pendent way.
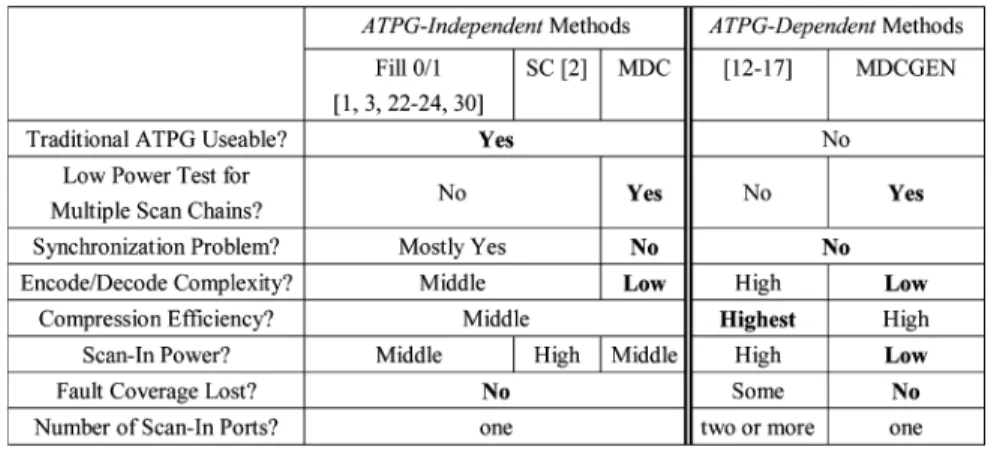
Finally, Table VIII compiles performance aspects on the MDC scheme with other published approaches and techniques. We could conclude that the scheme is a good scheme to reduce the shifting-in power for scan test for multiple-scan-chain designs.
REFERENCES
[1] A. Chandra and K. Chakrabarty, “System-on-a-chip test-data compres-sion and decomprescompres-sion architectures based on Golomb codes,” IEEE
Trans. Comput.-Aided Des. Integr. Circuits Syst., vol. 20, no. 3, pp.
355–368, Mar. 2001.
[2] A. Jas, J. Ghosh-Dastidar, Ng, and N. A. Touba, “An efficient test vector compression scheme using selective huffman coding,” IEEE
Comput.-Aided Des. Integr. Circuits Syst., vol. 22, no. 6, pp. 797–806,
Jun. 2003.
[3] P. T. Gonciari, B. M. Al-Hashimi, and N. Nicolici, “Variable-length input Huffman coding for system-on-a-chip test,” IEEE Comput-Aided
Des. Integr. Circuits Syst., vol. 22, no. 6, pp. 783–796, Jun. 2003.
[4] A. Chandra and K. Chakrabarty, “Frequency-directed run-length codes with application to system-on-a-chip test data compression,” in Proc.
VTS, 2001, pp. 42–47.
[5] K. J. Balakrishnan and N. A. Touba, “Relating entropy theory to test data compression,” in Proc. ETS, 2004, pp. 94–99.
[6] S. Reda and A. Orailoglu, “Reducing test application time through test data mutation encoding,” in Proc. DATE, 2002, pp. 387–393. [7] A. Jas and N. A. Touba, “Using an embedded processor for efficient
deterministic testing of systems-on-a-chip,” in Proc. ICCD, 1999, pp. 418–423.
[8] S. P. Lin, C. L. Lee, and J. E. Chen, “A cocktail approach on random ac-cess scan toward low power and high efficiency test,” in Proc. ICCAD, 2005, pp. 94–99.
[9] Z. Wang and K. Chakrabarty, “Test data compression for IP embedded cores using selective encoding of scan slices,” in Proc. ITC, 2005, pp. 581–590.
[10] A. Jas, B. Pouya, and N. A. Touba, “Test data compression technique for embedded cores using virtual scan chains,” IEEE Very Large Scale
Integr. (VLSI) Syst., vol. 12, no. 7, pp. 775–780, Jul. 2004.
[11] A. R. Pandey and J. H. Patel, “An incremental algorithm for test gener-ation in Illinois scan architecture based designs,” in Proc. DATE, 2002, pp. 368–375.
[12] I. Bayraktaroglu and A. Orailoglu, “Test volume and application time reduction through scan chain concealment,” in Proc. DAC, 2001, pp. 151–155.
[13] I. Bayraktaroglu and A. Orailoglu, “Decompression hardware determi-nation for test volume and time reduction through unified test pattern compaction and compression,” in Proc. VTS, 2003, pp. 113–120. [14] L. Li and K. Chakrabarty, “Deterministic BIST based on a
reconfig-urable interconnection network,” in Proc. ITC, 2003, pp. 460–469. [15] Synopsys Inc., Mountain View, CA, “SoC-BIST deterministic logic
BIST user guide,” (2004). [Online]. Available: http://www.synopsys. com/
[16] J. Rajski, “Embedded deterministic test,” IEEE Trans. Comput.-Aided
Des. Integr. Circuits Syst., vol. 23, no. 5, pp. 776–792, May 2004.
[17] H. Tang, S. M. Reddy, and I. Pomeranz, “On reducing test data volume and test application time for multiple scan chain designs,” in Proc. ITC, 2003, pp. 1079–1088.
[18] L. Whetsel, “Adapting scan architectures for low power operation,” in
Proc. ITC, 2000, pp. 863–872.
[19] Y. Bonhomme, P. Girard, L. Guiller, C. Landrault, and S. Pravos-soudovitch, “A gated clock scheme for low power scan-based BIST,” in Proc. IEEE 7th Int. On-Line Test. Workshop, 2001, pp. 87–89. [20] P. Girard, “Survey of low-power testing of VLSI circuits,” IEEE Des.
Test Comput., vol. 19, no. 3, pp. 82–92, May/Jun. 2002.
[21] A. Chandra and K. Chakrabarty, “Combining low-power scan testing and test data compression for system-on-a-chip,” in Proc. DAC, 2001, pp. 166–169.
[22] A. Chandra and K. Chakrabarty, “A unified approach to reduce SOC test data volume, scan power, and testing time,” IEEE Comput.-Aided
Des. Integr. Circuits Syst., vol. 22, no. 3, pp. 355–368, Mar. 2003.
[23] A. Chandra and K. Chakrabarty, “Reduction of SoC test data volume, scan power and testing time using alternating run-length codes,” in
Proc. DAC, 2002, pp. 673–678.
[24] M. Nourani and M. Tehranipour, “RL-Huffman encoding for test com-pression and power reduction in scan applications,” in Proc. IEEE
TO-DAES, 2005, pp. 91–115.
[25] J. Lee and N. A. Touba, “Low power test data compression based on LFSR reseeding,” in Proc. ICCD, 2004, pp. 180–185.
pp. 726–731.
[29] Syntest Inc., Sunnyvale, CA, “TurboScan user guide,” [Online]. Avail-able: http://www.syntest.com/
[30] A. El-Maleh and R. Al-Abaji, “Extended frequency-directed run-length codes with improved application to system-on-a-chip test data compression,” in Proc. ICECS, 2002, pp. 449–452. [31] M. H. Tehranipour, M. Nourani, and K. Chakrabarty, “Nine-coded
compression technique with application to reduced pin-count testing and flexible on-chip decompression,” in Proc. DATE, 2004, pp. 1284–1289.
[32] Gaisler Research Inc., Gothenburg, Sweden, “Leon,” (2000). [Online]. Available: http://www.gaisler.com
[33] T. Yoshida and M. Watari, “MD-scan method for low power scan testing,” in Proc. ITC, 2003, pp. 480–487.
[34] K. K. Saluja and K. Kinoshita, “On low-capture-power test generation for scan testing,” in Proc. VTS, 2005, pp. 265–270.
Shih-Ping Lin received the B.E. and M.S. degrees
in computer information science from National Chiao-Tung University, Hsinchu, Taiwan, R.O.C., in 2000 and 2002, respectively, where he is currently pursuing the Ph.D. degree in electronics engineering. He is currently working in the areas of test-set compression/decompression, low power testing, delay testing, and SoC testing. His research interests include the fields of VLSI design automation and digital testing.
Chung-Len Lee received the B.S. degree from
Na-tional Taiwan University, Taiwan, R.O.C., in 1968, and the M.S. and the Ph.D. degrees from Carnegie-Mellon University, Pittsburgh, PA, both in electrical engineering, in 1971 and 1975, respectively.
He joined the Department of Electronics Engi-neering, National Chiao-Tung University, Hsinchu, Taiwan, R.O.C., as a faculty member in 1975 and has since been active in teaching and research in the areas of optoelectronics, integrated circuits, and CAD/VLSI Testing. He has supervised over 100 Ph.D. and M.S. students to finish their theses and has published over 200 papers in the above areas. Presently, he is a Professor of the Department.
Dr. Lee is an Associate Editor of the Journal of Electronic Testing, Theory and
Applications. Presently, he is also a member of the Asia Test Sub-Committee,
IEEE Computer Society.
synthesis for testability, reliable computing, yield analysis, and test management.
Dr. Chen is a member of the IEEE Computer So-ciety.
Ji-Jan Chen received the Ph.D. degree in electrical
engineering from National Cheng-Kung University (NCKU), Tainan, Taiwan, R.O.C., in 2003.
He is currently a Department Manager in the SOC Technology Center (STC), ITRI, Hsinchu, Taiwan, R.O.C., where he led the design-flow development team to conduct the IC/IP development projects. His research interests include VLSI design, algorithms for CAD, low-power and SoC testing.
Kun-Lun Luo received the B.S. and M.S. degrees
from National Chiao Tung University, Hsinchu, Taiwan, R.O.C., in 1990 and 1998, respectively.
He is currently a Tech Deputy Manager in the SoC Technology Center, Industrial Technology Research Institute, Hsinchu. His research interests include low-power testing, memory testing, and SoC testing.
Wen-Ching Wu received the B.S., M.S., and Ph.D.
degrees in electronic engineering from National Chiao-Tung University, Hsinchu, Taiwan, R.O.C., in 1988, 1990, and 1997, respectively.
Presently, he is the Director of the Design Automa-tion Division, SoC Technology Center, Industrial Technology Research Institute, Hsinchu, Taiwan, R.O.C. His research interests include SoC/VLSI testing, AMS testing, design for testability, and EDA.