Oxide thinning percolation statistical model for soft breakdown in ultrathin gate oxides
Ming-Jer Chen, Ting-Kuo Kang, Chuan-Hsi Liu, Yih J. Chang, and Kuan-Yu Fu
Citation: Applied Physics Letters 77, 555 (2000); doi: 10.1063/1.127042 View online: http://dx.doi.org/10.1063/1.127042
View Table of Contents: http://scitation.aip.org/content/aip/journal/apl/77/4?ver=pdfcov
Published by the AIP Publishing
Articles you may be interested in
Characterization of breakdown in ultrathin oxides by hot carrier emission
Appl. Phys. Lett. 84, 4641 (2004); 10.1063/1.1759383
Unified model for breakdown in thin and ultrathin gate oxides (12–5 nm)
J. Appl. Phys. 86, 5131 (1999); 10.1063/1.371489
Non-Gaussian behavior and anticorrelations in ultrathin gate oxides after soft breakdown
Appl. Phys. Lett. 74, 1579 (1999); 10.1063/1.123622
Model for the current–voltage characteristics of ultrathin gate oxides after soft breakdown
J. Appl. Phys. 84, 4351 (1998); 10.1063/1.368654
Soft breakdown in ultrathin gate oxides: Correlation with the percolation theory of nonlinear conductors
Appl. Phys. Lett. 73, 514 (1998); 10.1063/1.121918
This article is copyrighted as indicated in the article. Reuse of AIP content is subject to the terms at: http://scitation.aip.org/termsconditions. Downloaded to IP: 140.113.38.11 On: Thu, 01 May 2014 07:46:44
Oxide thinning percolation statistical model for soft breakdown
in ultrathin gate oxides
Ming-Jer Chena)and Ting-Kuo Kang
Department of Electronics Engineering, National Chiao-Tung University, Hsin-Chu, Taiwan, Republic of China
Chuan-Hsi Liu, Yih J. Chang, and Kuan-Yu Fu
United Microelectronics Corporation (UMC), Science-Based Industrial Park, Hsin-Chu, Taiwan, Republic of China
共Received 3 February 2000; accepted for publication 31 May 2000兲
An existing cell-based percolation model with parameter correlation can find its potential applications in assessing soft-breakdown 共BD兲 statistics as long as the oxide thinning due to the localized physical damage near the SiO2/Si interface is accounted for. The resulting model is
expressed explicitly with the critical trap number per cell nBDand the remaining oxide thickness tox
⬘
both as parameters. Reproduction of time-to-bimodal 共soft- and hard-兲 breakdown statistical data from 3.3-nm-thick gate-oxide samples yields nBD of 3 and 4 for soft and hard breakdown,
respectively. The extracted tox
⬘
of 1.0 nm for soft breakdown, plus the transition layer thickness of 0.5 nm in the model, is fairly comparable with literature values from current–voltage fitting. The dimension and area of the localized physically damaged region or percolation path 共cell兲 are quantified as well. Based on the work, the origins of soft and hard breakdown are clarified in the following:共i兲 soft breakdown behaves intrinsically as hard breakdown, that is, they share the same defect 共neutral trap兲 generation process and follow Poisson random statistics; 共ii兲 both are independent events corresponding to different tox⬘
requirements; and共iii兲 hard breakdown takes place in a certain path located differently from that for the first soft breakdown. © 2000 AmericanInstitute of Physics.关S0003-6951共00兲02130-6兴
The time-dependent dielectric breakdown is one of the most issues of concern in scaled metal–oxide– semiconductor field-effect transistors 共MOSFETs兲. An anomalous phenomenon of soft breakdown 共SBD兲 共also called B-mode stress-induced leakage current1 and quasibreakdown兲,2 which behaves fundamentally differently from hard breakdown共HBD兲, has recently been observed in ultrathin共⬍5 nm兲 gate oxides.1–7The oxide thinning theory2 has originally been reported in explaining this phenomenon: the electrons injected from the polysilicon gate can travel through the ultrathin oxide ballistically and release most of their energy to physically damage the anode SiO2/Si
inter-face, thus effectively reducing the oxide thickness to the di-rect tunneling regime. This theory has been cited in many applications such as post-soft-breakdown current–voltage (I – V) models,2,8,9quantitative determination of the remain-ing oxide thickness by I – V fittremain-ing,2,9and physics basis for electron and hole direct tunneling conduction.10On the other hand, there have been published a series of percolation sta-tistical models each successfully dealing with dielectric breakdown.11–15 In this letter, we demonstrate that a cell-based percolation model with parameter correlation15 can find potential applications in assessing soft-breakdown statis-tics as long as the local oxide thinning2is accounted for. In such a way, current understandings regarding the origins of soft and hard breakdown, the dimension and area of the
lo-calized physically damaged region, and the remaining oxide thickness, can all be substantially improved.
The n-channel MOSFETs with two different gate-oxide areas of 50⫻50 and 80⫻100m2were fabricated in a 0.18 m process. In this process, the gate oxide was thermally grown in a dilute oxygen ambient, and the polysilicon gate was arsenic implanted at 50 keV and 2⫻1015cm⫺2,
fol-lowed by N2O annealing. The gate-oxide thickness tox was
determined to be 3.3 nm by polysilicon depletion and quantum-mechanical-corrected C – V method. Stressing gate oxide was carried out under gate electron injection with con-stant current JG of ⫺125 mA/cm2 and with source, drain,
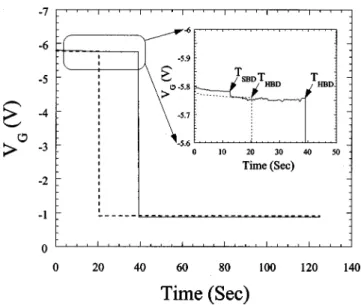
and substrate tied to ground. The variation of gate voltage with stress time was monitored, from which the two key time criteria were extracted, namely, the time to soft breakdown
TSBDand the time to hard breakdown THBD. Figure 1 depicts
the measured results by HP4145B for two typical samples, respectively, showing the presence of bimodal共both soft and hard兲 breakdown and the absence of soft breakdown. At
TSBD a first, small sudden drop of around 20 mV in gate
voltage occurred while a more drastic change down to around⫺1 V was observed at THBD. It was found that about
95% of the total samples exhibit bimodal characteristics, whereas the remaining show only hard breakdown, that is, no noticeable signal for soft breakdown can be detected, as ex-plained later. The inset of Fig. 2 shows the experimental
TSBD and THBD distributions from all samples in a Weibull
plot, revealing that as hard breakdown turns into soft break-down, the modal of the distributions moves to a lower time scale and the Weibull slope decreases. Also plotted in Fig. 2
a兲Electronic mail: [email protected]
APPLIED PHYSICS LETTERS VOLUME 77, NUMBER 4 24 JULY 2000
555
0003-6951/2000/77(4)/555/3/$17.00 © 2000 American Institute of Physics
This article is copyrighted as indicated in the article. Reuse of AIP content is subject to the terms at: http://scitation.aip.org/termsconditions. Downloaded to IP: 140.113.38.11 On: Thu, 01 May 2014 07:46:44
is the Weibull plot translated to the oxide area Aox of 80
⫻100m2 using Poisson area scaling,16 showing that both soft and hard breakdown indeed follow Poisson random statistics.17
The above time-to-breakdown parameters TSBD and
THBDwere defined in terms of different sudden drops in gate voltage. This definition is adequate since it was found that after TSBD the poststress gate I – V characteristic curve re-sembled the direct tunneling one of the fresh oxide with thinner thickness as reported earlier,2,3,9,10 while it became Ohmic after THBD. In addition, three relevant observations
were drawn from emission spectroscopy EMMI pictures共not shown here兲: 共i兲 the number of photoemission sites for soft breakdown increases with stress time; 共ii兲 these sites were randomly distributed; and 共iii兲 the first soft-breakdown site was different from the hard-breakdown site. Indeed, we mea-sured electrically several soft-breakdown events prior to the
final hard breakdown. Further evidence was found by plot-ting a scatter diagram 共not shown here兲 between the mea-sured TSBD and THBD from the above 95% of the samples,
exhibiting a very weak correlation between soft breakdown and hard breakdown. This suggests both events are statisti-cally independent of each other.
Dielectric breakdown can be regarded as a process of the neutral electron trap generation during stress, critically pro-ducing one percolation path or more. The gate-oxide area can be divided into many identical square cells with cell area
A0.11,12Figure 3 schematically shows two different percola-tion paths within the cell, respectively, representing soft and hard breakdown. In the hard-breakdown percolation path, the traps span the whole oxide to connect one plate to the other one, while for the soft-breakdown path such plate-to-plate connection is incomplete as characterized by the remaining oxide thickness tox
⬘
over the localized physically damaged region according to the theory.2Obviously, all the traps are randomly generated within the effective thickness oftox– 2t – tox
⬘
for soft breakdown. Here, t(⫽0.5 nm) 共Refs. 14 and 15兲 denotes the transition-layer thickness to account for the conductive nature in the vicinity of the interface between the polysilicon gate and oxide and that between the oxide and underlying silicon. The critical trap density Nt distribu-tion for the critical trap number per cell nBD satisfied in acertain soft-breakdown percolation path can be calculated by the existing cell-based percolation model11,12with the oxide thinning included: ln关⫺ln共1⫺F兲兴 ⫽ln Aox⫹ln
再
Nt共tox⫺2t⫺tox⬘
兲 ⫺A1 0 ln冋
兺
n⫽0 n⫽nBD⫺1 关A0共tox⫺2t⫺tox⬘
兲Nt兴n n!册冎
, 共1兲where F denotes the cumulative percentage of time to break-down. Prior to performing Eq. 共1兲, parameter correlation15 between nBDand A0 must be taken into account:
A0⫽0.3共tox⫺2t⫺tox
⬘
兲 2/冑
nBD. 共2兲
Equation共2兲 can readily quantify the area A0of the localized
physically damaged region or percolation path 共cell兲. Equa-tions 共1兲 and 共2兲 can also deal with hard breakdown for tox
⬘
FIG. 1. Measured gate voltage vs stress time under constant current stress-ing for two samples. The oxide area was 80⫻100m2and the stressing was
done in gate injection of⫺125 mA/cm2.
FIG. 2. Translated共with respect to 80⫻100m2兲 statistical distributions of
time to soft breakdown TSBDand time to hard breakdown THBD. Also
plot-ted are the lines from the model. The inset shows TSBDand THBD
distribu-tions for two oxide areas.
FIG. 3. Cross-sectional schematic showing a localized oxide thinning per-colation path and a hard-breakdown perper-colation path. The spheres represent the traps generated during stress. The figure is not to scale.
556 Appl. Phys. Lett., Vol. 77, No. 4, 24 July 2000 Chenet al.
This article is copyrighted as indicated in the article. Reuse of AIP content is subject to the terms at: http://scitation.aip.org/termsconditions. Downloaded to IP: 140.113.38.11 On: Thu, 01 May 2014 07:46:44
⫽0. A unique relationship13between the trap density N
tand
the electron stress fluence Qe was employed: Nt⫽B Qe
0.6
, where B is a constant to be fitted. Thus, the above model with Qe⫽JGTSBD or Qe⫽JGTHBD can practically handle
time-to-breakdown data with fitting parameters: B, tox
⬘
, andnBD.
Best-fitting the model to hard-breakdown data points in Fig. 2 yields nBD⫽4 and B⫽7⫻1017cm⫺1.8C⫺0.6 for two
different areas. With known B, next fitting soft-breakdown data leads to nBD⫽3 and tox
⬘
⫽1.0 nm. Adequatereproduc-tion, as shown in Fig. 2, evidences that the statistical distri-butions of soft breakdown behave intrinsically as hard breakdown.13,16 The extracted tox
⬘
is reasonable since its quantity plus the transition-layer thickness t of 0.5 nm is fairly comparable with literature values obtained by I – V fit-ting: 2.2 nm for the 4 nm gate oxide2and a constant of about 1.7 nm over 3.5–5.0 nm gate-oxide thicknesses.9 On the other hand, the area of the localized physically damaged re-gion was estimated based on Eq.共2兲 to be 0.3 nm2, far away from the reported values: i.e., 1.55⫻1.55 nm2 in Ref. 8 and 1⫻103– 6⫻103nm2in Ref. 9. One of the principal reasons for such order-of-the-magnitude differences is that the direct tunneling depends on the oxide thickness exponentially but on the area only linearly, that is, an adjustment of tox⬘
gives rise to an exponential change in tunneling area such as to maintain the same direct tunneling current.According to the above analysis, the origins of soft and hard breakdown can be clarified in the following: 共i兲 soft breakdown behaves intrinsically as hard breakdown, that is, they share the same defect 共neutral trap兲 generation process and follow Poisson random statistics; 共ii兲 both are indepen-dent events corresponding to different tox
⬘
requirements; and共iii兲 hard breakdown takes place in a certain path located
differently from that for the first soft breakdown. Therefore, hard breakdown can statistically compete with soft break-down, that is, hard breakdown could dominate making soft breakdown not easily detected. This effect, which can rea-sonably explain the above-mentioned 5% population for the absence of soft breakdown during stress measurement, has been well documented elsewhere.18 However, we disagree with the argument of the same citation18that soft-breakdown and hard-breakdown phenomena do not obey to the same defect generation kinetics. Instead, more and more evidences19,20tends to favor our opinion. Finally, the distinct
tox
⬘
for soft and hard breakdown indicates that theconduc-tance in the former percolation path is lower than the latter, consistent with the recent theory prediction21 that the upper and lower limits of the conductance stochastic values in the percolation path correspond to the occurrences of hard break-down and soft breakbreak-down, respectively.
In summary, an oxide thinning cell-based percolation model with parameter correlation has been established to as-sess soft-breakdown statistics in ultrathin gate oxides. It has
exhibited the ability of reproducing the statistical distribu-tions of time to soft breakdown from 3.3-nm-thick oxide samples. Current understandings regarding the origins of soft and hard breakdown, the dimension and area of the localized physically damaged region, and the remaining oxide thick-ness, have all been substantially improved based on the model.
The authors would like to thank the Advanced Reliabil-ity Engineering Department/UMC for the EMMI analysis. Special thanks are devoted to M. J. Chang for performing
C – V fitting, and Dr. H. T. Huang and K. N. Yang,
Reliabil-ity Physics Laboratory, for their stimulating discussions. This work was supported by the National Science Council under Contract No. 89-2215-009-049.
1K. Okada, S. Kawasaki, and Y. Hirofuji, Extended Abstracts of the 1994 International Conference on Solid State Devices and Materials共SSDM兲
共1994兲, p. 565 共unpublished兲.
2S. H. Lee, B. J. Cho, J. C. Kim, and S. H. Choi, Tech. Dig. Int. Electron Devices Meet. 605共1994兲.
3T. Yoshida, S. Miyazaki, and M. Hirose, Extended Abstracts of the 1996 International Conference on Solid State Devices and Materials共SSDM兲
共1996兲, p. 539 共unpublished兲.
4M. Depas, T. Nigam, and M. M. Heyns, IEEE Trans. Electron Devices 43, 1499共1996兲.
5B. E. Weir, P. J. Silverman, D. Monroe, K. S. Krisch, M. A. Alam, G. B. Alers, T. W. Sorsch, G. L. Timp, F. Baumann, C. T. Liu, Y. Ma, and D. Hwang, Tech. Dig. Int. Electron Devices Meet. 73共1997兲.
6E. Miranda, J. Sun˜e´, R. Rodriguez, M. Nafria, and X. Aymerich, Appl. Phys. Lett. 73, 490共1998兲.
7
T. Sakura, H. Utsunomiya, Y. Kamakura, and K. Taniguchi, Tech. Dig. Int. Electron Devices Meet. 183共1998兲.
8D. Z. Y. Ting, Appl. Phys. Lett. 74, 585共1999兲.
9W. Mizubayashi, H. Itokawa, S. Miyazaki, and M. Hirose, Extended Ab-stracts of the 1999 International Conference on Solid State Devices and Materials共SSDM兲 共1999兲, p. 318 共unpublished兲.
10Y. D. He, H. Guan, M. F. Li, B. J. Cho, and Z. Dong, Appl. Phys. Lett. 75, 2432共1999兲.
11J. Sun˜e´, I. Placencia, N. Barniol, E. Farres, F. Martin, and X. Aymerich, Thin Solid Films 185, 347共1990兲.
12
D. J. Dumin, J. R. Maddux, R. S. Scott, and R. Subramoniam, IEEE Trans. Electron Devices 41, 1570共1994兲.
13R. Degraeve, G. Groeseneken, R. Bellens, M. Depas, and H. E. Maes, Tech. Dig. Int. Electron Devices Meet. 863共1995兲.
14
H. T. Huang, M. J. Chen, J. H. Chen, C. W. Su, C. S. Hou, and M. S. Liang, IEEE International Symposium on VLSI Technology, Systems and Applications, Proceedings of Technical Papers 共1999兲, p. 70 共unpub-lished兲.
15
M. J. Chen, H. T. Huang, J. H. Chen, C. W. Su, C. S. Hou, and M. S. Liang, IEEE Electron Device Lett. 20, 523共1999兲.
16E. Y. Wu, E. Nowak, L. K. Han, D. Dufresne, and W. W. Abadeer, Tech. Dig. Int. Electron Devices Meet. 441共1999兲.
17D. R. Wolters and J. F. Verwey, Instabilities in Silicon Devices共Elsevier, Amsterdam, The Netherlands, 1986兲, p. 332.
18S. Bruyere, D. Roy, E. Vincent, and G. Ghibaudo, Microelectron. Reliab. 39, 815共1999兲.
19E. Wu, E. Nowak, J. Aitken, W. Abadeer, L. K. Han, and S. Lo, Tech. Dig. Int. Electron Devices Meet. 187共1998兲.
20
J. Sun˜e´, G. Mura, and E. Miranda, IEEE Electron Device Lett. 21, 167
共2000兲.
21M. A. Alam, B. Weir, J. Bude, P. Silverman, and Don Monroe, Tech. Dig. Int. Electron Devices Meet. 449共1999兲.
557
Appl. Phys. Lett., Vol. 77, No. 4, 24 July 2000 Chenet al.
This article is copyrighted as indicated in the article. Reuse of AIP content is subject to the terms at: http://scitation.aip.org/termsconditions. Downloaded to IP: 140.113.38.11 On: Thu, 01 May 2014 07:46:44