探討技術分析在臺灣股票市場的獲利性:以臺灣中型100成分股為例 - 政大學術集成
45
0
0
全文
(2) 謝辭 不敢相信自己可以走到這一步,回想起兩年前還戰戰兢兢地擔心自己是否可 以獨立完成畢業論文,一轉眼就到了寫謝辭的時候了,這一路走來有艱辛、有沮 喪,能夠順利完成都歸功於在我身邊幫助我的大家! 首先最要感謝的就是我的指導教授,郭維裕老師及鄭鴻章老師,老師一直以 來給予我很多方向與指導,不僅是這份論文的研究方向,還有許多人生道路上的 指點,真的很高興自己能遇到一位這麼關心學生的老師!再來,感謝抽空前來幫. 政 治 大. 忙口試的陳威光老師及徐政義老師,有你們的意見和指導才能讓這份論文更完整。. 立. 除此之外,當然還要感謝一路以來一起打拚的同門師兄妹,佑舟、玫吟、心儀、. ‧ 國. 學. 佩蓉,因為有你們實質上的建議與精神上的陪伴,我才能度過這段艱辛的時光。 還有,感謝一直相互支持、相互勉勵的國貿所同學們,很高興自己能參與如. ‧. 此溫暖的這屆,尤其是偉瑱、士俊、育歆、姿嫻、瑋凌,感謝你們在我完成論文. y. Nat. n. al. er. io. 鼓勵,以及幫助我完成一些繁雜的程序,辛苦你了!. sit. 的過程中,給予我大大小小的幫助,特別是偉瑱,真的很謝謝你一路以來的支持、. i n U. v. 最後也要感謝我的家人,有你們我才能無後顧之憂地完成這份論文,然後順. Ch. engchi. 利畢業。謝謝你們,在此將這份榮耀與喜悅與你們一同分享,感謝大家!. I.
(3) 摘要 技術分析一直是許多研究的熱門主題,也被眾多市場參與者廣泛運用在市場 交易,而最普遍且最受歡迎的技術分析工具即為移動平均法。 本研究設計三種移動平均交易方法(一種只考慮收盤價,一種考慮收盤價及 交易量,而另一種則將交易量作為收盤價的權重),每種交易方法皆使用五天為 短期移動平均天數,十天、五十天、一百天、一百五十天、兩百天為長期移動平 均天數,總計十五種移動平均交易規則,運用在臺灣中型 100 成分股以產生買進. 政 治 大 次交易的平均報酬、平均持有天數,以及 Hit ratio(正報酬的交易次數占總交易 立. 與賣出訊號,並依訊號進行交易動作,進而在未考慮交易成本的假設下計算出單. ‧ 國. 學. 次數的比例),藉以探討移動平均法在此種股票的獲利性。而以交易量為價格權 重來產生移動平均交易方法是基於相信帶有較高交易量的價格較有意義,盼藉以. ‧. 測試此種方法是否正如預期,相較於一般傳統的價格移動平均法有更好的績效。. sit. y. Nat. 本研究雖然未考慮交易成本,但呈現的單次交易平均報酬可以提供讀者與實. al. er. io. 際臺灣股票市場交易成本作比較,藉以了解考慮交易成本後的情況。而本研究除. v. n. 了呈現所有成分股單次交易的平均報酬、平均持有天數及 Hit ratio 的平均值,也. Ch. engchi. i n U. 將成分股依照 ICB 行業分類指標分成幾個主要產業,並呈現各產業內成分股的 平均值,企圖了解特定交易方法是否在特定產業有較好的績效。 結果顯示,產生最好績效的移動平均交易方法也僅能有一半的交易次數得到 正報酬,而就整體而言,將交易量作為價格權重的移動平均方法,也沒有產生相 較於傳統價格移動平均法更好的績效,因此可以說,這類的技術分析對於這些股 票無法有較好的績效。. 關鍵字:技術分析、移動平均、臺灣中型 100、Hit ratio. II.
(4) Abstract Technical analysis has been widely studied and used by many researchers and market participants. The most common and popular technical trading rule is moving average since it is mathematically well defined and used by many analysts. This article examines the profitability of technical analysis for FTSE TWSE Mid-Cap Taiwan 100 Index constituents under the hypothesis of no transaction costs. It uses three strategies (Price Strategy, Price and Volume Strategy, and PV Strategy). 政 治 大 average returns per trading,立 average holding days per trading, and hit ratios to see the and fifteen moving average rules to generate buy and sell signals, and then compute. ‧ 國. 學. profitability. It is believed that prices come with high volumes are more meaningful than those with low volumes. All of these strategies and trading rules are not only. ‧. used for all constituents of FTSE TWSE Mid-Cap Taiwan 100 Index without consid-. sit. y. Nat. ering industry classifications but also for each major industry classifications of these. n. al. performances for specific industries of these stocks.. Ch. engchi. er. io. constituents. Therefore, we can understand whether specific trading rules have better. i n U. v. The results are not that optimistic. Overall Price and Volume Strategy has the best results of hit ratio, however, the highest value is barely 50%, which means it can only have a half trading times positive returns. As for PV Strategy which uses weighted price moving average to trade, the performance has no significantly better than using simple price moving average rule. It can say that Technical Analysis like moving average can hardly have good performances on these stocks.. Key Words: Technical Analysis, Moving Average, FTSE TWSE Mid-Cap Taiwan 100 Index, Hit Ratio. III.
(5) Contents 謝辭 ................................................................................................................................. I 摘要 ................................................................................................................................ II ABSTRACT................................................................................................................... III CONTENTS .................................................................................................................. IV FIGURE CONTENTS .................................................................................................... V 1.. INTRODUCTION .................................................................................................. 1. 2.. LITERATURE REVIEW ....................................................................................... 3. 3.. DATA AND METHODOLOGY .............................................................................. 4. 3.2. TRADING RULES. EMPIRICAL RESULTS ......................................................................................... 8. 學. ALL CONSTITUENTS ................................................................................................ 8. 4.2. BASIC MATERIALS ................................................................................................ 12. 4.3. INDUSTRIALS ......................................................................................................... 16. 4.4. CONSUMER GOODS ............................................................................................... 19. 4.5. CONSUMER SERVICES........................................................................................... 23. 4.6. FINANCIALS ........................................................................................................... 26. 4.7. TECHNOLOGY ....................................................................................................... 29. ‧. 4.1. n. al. er. io. sit. y. Nat. 5.. DATA ........................................................................................................................ 4. ‧ 國. 4.. 政 治 大 ..................................................................................................... 5 立. 3.1. Ch. i n U. v. CONCLUSIONS................................................................................................... 33. engchi. REFERENCES ............................................................................................................. 35 APPENDIX A:FTSE TWSE MID-CAP TAIWAN 100 INDEX CONSTITUENTS ..... 36. IV.
(6) Figure Contents FIGURE 3.2.1. TRADING RULE ....................................................................................................... 7. FIGURE 4.1.1. AVERAGE RETURNS PER BUY TIMES OF ALL CONSTITUENTS ............... 9. FIGURE 4.1.2. AVERAGE RETURNS PER SELL TIMES OF ALL CONSTITUENTS ............. 9. FIGURE 4.1.3. AVERAGE HOLDING DAYS PER BUY TIMES OF ALL CONSTITUENTS.. 10. FIGURE 4.1.4. AVERAGE HOLDING DAYS PER SELL TIMES OF ALL CONSTITUENTS 10. FIGURE 4.1.5. HIT RATIOS OF BUY ACTIONS OF ALL CONSTITUENTS ........................... 11. FIGURE 4.1.6. HIT RATIOS OF SELL ACTIONS OF ALL CONSTITUENTS ......................... 11. FIGURE 4.2.1. AVERAGE RETURNS PER BUY TIMES OF BASIC MATERIALS ................ 13. FIGURE 4.2.2. AVERAGE RETURNS PER SELL TIMES OF BASIC MATERIALS .............. 13. FIGURE 4.2.3. AVERAGE HOLDING DAYS PER BUY TIMES OF BASIC MATERIALS .... 14. FIGURE 4.2.4. AVERAGE HOLDING DAYS PER SELL TIMES OF BASIC MATERIALS ... 14. FIGURE 4.2.5. HIT RATIOS OF BUY ACTIONS OF BASIC MATERIALS .............................. 15. FIGURE 4.2.6. HIT RATIOS OF SELL ACTIONS OF BASIC MATERIALS ............................ 15. FIGURE 4.3.1. AVERAGE RETURNS PER BUY TIMES OF INDUSTRIALS .......................... 16. FIGURE 4.3.2. AVERAGE RETURNS PER SELL TIMES OF INDUSTRIALS ........................ 16. FIGURE 4.3.3. AVERAGE HOLDING DAYS PER BUY TIMES OF INDUSTRIALS .............. 17. FIGURE 4.3.4. AVERAGE HOLDING DAYS PER SELL TIMES OF INDUSTRIALS ............ 18. FIGURE 4.3.5. HIT RATIOS OF BUY ACTIONS OF INDUSTRIALS ....................................... 18. FIGURE 4.3.5. HIT RATIOS OF SELL ACTIONS OF INDUSTRIALS ...................................... 19. FIGURE 4.4.1. AVERAGE RETURNS PER BUY TIMES OF CONSUMER GOODS .............. 20. FIGURE 4.4.2. AVERAGE RETURNS PER SELL TIMES OF CONSUMER GOODS ............. 20. FIGURE 4.4.3. AVERAGE HOLDING DAYS PER BUY TIMES OF CONSUMER GOODS ... 21. FIGURE 4.4.4. AVERAGE HOLDING DAYS PER SELL TIMES OF CONSUMER GOODS . 21. FIGURE 4.4.5. HIT RATIOS OF BUY ACTIONS OF CONSUMER GOODS ............................ 22. FIGURE 4.4.6. HIT RATIOS OF SELL ACTIONS OF CONSUMER GOODS .......................... 22. FIGURE 4.5.1. AVERAGE RETURNS PER BUY TIMES OF CONSUMER SERVICES ......... 23. 立. 政 治 大. ‧. ‧ 國. 學. n. er. io. sit. y. Nat. al. Ch. engchi. V. i n U. v.
(7) FIGURE 4.5.2. AVERAGE RETURNS PER SELL TIMES OF CONSUMER SERVICES ....... 23. FIGURE 4.5.3. AVERAGE HOLDING DAYS PER BUY TIMES OF CONSUMER SERVICES. ................................................................................................................................................................ 24 FIGURE 4.5.4. AVERAGE HOLDING DAYS PER SELL TIMES OF CONSUMER SERVICES. ................................................................................................................................................................ 24 FIGURE 4.5.5. HIT RATIOS OF BUY ACTIONS OF CONSUMER SERVICES ....................... 25. FIGURE 4.5.6. HIT RATIOS OF SELL ACTIONS OF CONSUMER SERVICES ..................... 25. FIGURE 4.6.1. AVERAGE RETURNS PER BUY TIMES OF FINANCIALS ............................ 26. FIGURE 4.6.2. AVERAGE RETURNS PER SELL TIMES OF FINANCIALS........................... 26. FIGURE 4.6.3. AVERAGE HOLDING DAYS PER BUY TIMES OF FINANCIALS ................. 27. FIGURE 4.6.4. AVERAGE HOLDING DAYS PER SELL TIMES OF FINANCIALS ............... 27. FIGURE 4.6.5. HIT RATIOS OF BUY ACTIONS OF FINANCIALS .......................................... 28. FIGURE 4.6.6. HIT RATIOS OF SELL ACTIONS OF FINANCIALS ........................................ 28. FIGURE 4.7.1. AVERAGE RETURNS PER BUY TIMES OF TECHNOLOGY ........................ 29. FIGURE 4.7.2. AVERAGE RETURNS PER SELL TIMES OF TECHNOLOGY ...................... 30. FIGURE 4.7.3. AVERAGE HOLDING DAYS PER BUY TIMES OF TECHNOLOGY............. 31. FIGURE 4.7.4. AVERAGE HOLDING DAYS PER SELL TIMES OF TECHNOLOGY ........... 31. FIGURE 4.7.5. HIT RATIOS OF BUY ACTIONS OF TECHNOLOGY ...................................... 32. FIGURE 4.7.6. HIT RATIOS OF SELL ACTIONS OF TECHNOLOGY .................................... 32. 立. 政 治 大. ‧. ‧ 國. 學. n. er. io. sit. y. Nat. al. Ch. engchi. VI. i n U. v.
(8) 1. Introduction As we know, Fama (1970) defines an efficient financial market as a market in which available information is always fully reflected by security prices. He distinguished three forms of market efficiency: a weak form, a semi-strong form, and a strong form. The weak form efficiency claims that past prices are useless in predicting future prices. The semi-strong form efficiency implies all public information is calculated into current prices, and only information that is not publicly available can benefit investors seeking to earn abnormal returns on investments. The strong form effi-. 政 治 大 prices, and not even insider 立information could give an investor the advantage(Bodie, ciency states all information in a market, whether public or private, is accounted for in. ‧ 國. 學. Kane et al. 2005).. A completely efficient financial market seems like an ideal market since there are. ‧. many factors like the degree of national development, cultures, or the maturity of fi-. sit. y. Nat. nancial market could affect the efficiency of financial market. Investors never stop to. n. al. er. io. find ways to catch a trend and earn profits from that. Once we can exactly predict the. i n U. v. future, we can make lots of money! This is why there continually have lots of re-. Ch. engchi. searches discussing whether we can profit from some active tools. Since Charles H. Dow first introduced the Dow Theory in the late 1800s, Technical analysis has been extensively used by market participants. Technical analysis is a method of forecasting price movements by analyzing generated by market activities, such as past prices and volumes. The foundation of this kind of analysis is based on the sluggish reaction of stock prices on the coming of new market information which is also the key to successful technical analysis, and therefore it is possible to earn abnormal returns by observing past price trends. Lots of researches have tried to find the evidence on the profitability of technical analysis. If technical analysis can truly prof-. 1.
(9) itable, this means that whatever fundamental reasons for a change in stock price, investors can predict future price and obtain abnormal returns by using only past information, and this is against the weak form efficiency hypothesis. There are several popular technical analysis tools like moving averages (MA henceforth), channels, and momentum. Compare to other technical trading rules, MA is mathematically well defined, easily defined, and it is used by the most analysts. This paper uses fifteen MA rules on FTSE TWSE Mid-Cap 100 Index constituents individually for the period from 2005 to April 2011 since FTSE and TWSE created. 政 治 大 umes can make the performance better than only using prices as factors of moving 立. this kind of index at the end of 2004. Since there are lots of researches believe vol-. average trading rules, I will not only use the classical moving average rule which only. ‧ 國. 學. considers prices but also take volumes into account to make trading rules. The vol-. ‧. umes will be added into trading rules in two different ways. One is like the simple. sit. y. Nat. price moving average but taking volumes instead of prices to make a simple volume. io. er. moving average. The other one is to take volumes as weights of prices to bring out a weighted price moving average rule. The reason why making this kind of trading rule. al. n. v i n C hvolumes may be more is that the prices come with high meaningful than those with engchi U. low volumes. Therefore, this paper tries to find out whether this kind of trading rules has better results. When using those trading rules, there will be buy actions and sell actions for each constituent. Then I will compute hit ratios, average returns and average holding days per trading times without considering transaction costs to examine whether using these trading rules for all constituents without considering industries or for specific industries can have good results. Although I didn’t take transaction costs into account, the average returns per trading times that I show may let readers to compare those values with the transaction. 2.
(10) costs in Taiwan stock market which is 0.585%1 to see what the returns may be after considering transaction costs. The organization of this paper is as follows: Section 2 is the literature review on the profitability of technical analysis, and most of them are about the profitability of moving average; Section 3 describes the data and methodology I use in this paper; Section 4 presents the empirical results; Section 5 is the conclusion.. 2. Literature Review. 政 治 大 analysis, including survey立 studies, theoretical and empirical studies(Park and Irwin There are lots of studies trying to find the evidence on the profitability of technical. ‧ 國. 學. 2004). The empirical studies can even be divided into early studies and modern studies. Early studies indicated that technical trading strategies were profitable in foreign. ‧. exchange markets and futures markets, but not in stock markets. Since the early-1990s,. sit. y. Nat. several papers have presented evidence that some simple trading rules are useful for. n. al. er. io. predicting stock market returns.. i n U. v. Brock, Lakonishock and LeBaron (1992) analyzed moving averages and trading. Ch. engchi. range breaks on the Dow Jones Industrials Index from 1897 to 1985. In their study, they used various short and long moving averages of prices to generate buy and sell signals and used t-tests to test whether buy-sell differences are significant. The conclusion of this study is that buy signals consistently generate higher returns than sell signals, t-tests are significant and technical rules have predictive power. After that, several studies used simple trading rules like MA to test in different markets. Bessembinder and Chan (1995) find that the trading rules from Brock et al. can be profitable in some Asian countries when trading costs are considered. Mitchell 1. Each of buying and selling stocks needs to pay transaction fees of 0.1425%, and it has to pay 0.3% transaction taxes when selling stocks. Totally it has to pay 0.585% transaction costs per trading times. 3.
(11) R. and Ricardo P.C. Leal (1999) used ten Variable Length Moving Average (VMA) technical trading rules in ten emerging equity markets in Latin America and Asia from January 1982 through April 1995. They used inflation adjusted returns instead of normal returns and apply a trading band that accounts for differences in volatility between markets. They compared these trading rules to a buy and hold strategy and fined that Taiwan, Thailand and Mexico where technical trading strategies may be profitable. At the same time, there are several studies add “volumes” to make trading rules to. 政 治 大 O’Hara (1994) present a model in which both past price and volume provide valuable 立. see if it can have better predictive power than only using prices. Blume, Easley and. information. Volume contains information regarding the quality of information in past. ‧ 國. 學. price movements, which perhaps should be more useful for smaller, less widely fol-. ‧. lowed firms. Ramazan G. and Thanasis S. (1998) used the daily Dow Jones Industri-. sit. y. Nat. als Average Index from 1963 to 1988 to examine the linear and non-linear predictabil-. io. er. ity of stock market returns with some simple technical trading rules. They found that past information on volume improves the forecast accuracy of current returns.. n. al. Ch. engchi. i n U. v. 3. Data and Methodology 3.1 Data The database used in this research are the daily closing prices and trading volumes of the constituent stocks of FTSE TWSE Mid-Cap Taiwan 100 Index from TEJ2 for the period from the first trading day of 2005 to the last trading day of April 2011. The constituents are those published by TWSE at the end of April 2011. FTSE TWSE Taiwan Mid-Cap 100 Index consists of the next 100 companies ranked by full market 2. Taiwan Economic Journal (TEJ) is a database providing accurate and reliable data on companies throughout Asia. 4.
(12) value, outside the FTSE TWSE Taiwan 50 Index, and it represents over 20% of the Taiwanese market. This index is reviewed quarterly in January, April, July and October every year, and constituent changes are implemented on the next trading day following the third Friday of the same month. The industries of the constituents of this index are classified by Industry Classification Benchmark (ICB)3 which was created by FTSE Group and Dow Jones Indexes in 2005 to provide a standardized base for analysis, stock selection and performance measurement. The constituents of FTSE TWSE Mid-Cap Taiwan 100 Index are listed at Appendix A.. 3.2 Trading Rules. 立. 政 治 大. One of the most popular technical trading rules is the MA rule. According to this. ‧ 國. 學. rule, buy (sell) signals are emitted when the short-term moving average exceeds (is. ‧. less than) the long-term average. The simple MA is computed as any other mathemat-. sit. y. Nat. ical average. The usual method is to take the closing price over a certain period, add. io. er. them together and then divide them by the selected number of days. The next day’s closing price will be added into the total and the initial day price will be dropped.. al. n. v i n C hof MA rules. The U In this study, I use three kinds first one named “Price Strategy” engchi. is the commonest MA rule which only consider price and the formula can be written as:. 𝑀𝐴𝑝𝑡 (n). ∑𝑛−1 𝑖=0 𝑃𝑡−𝑖 = 𝑛. (1). where 𝑀𝐴𝑝𝑡 (𝑛) is n-day moving average for price at time t, 𝑃𝑡 is the closing price at 3. ICB contains four classification levels: Industries(10), Supersectors(19), Sectors(41), and Subsectors(114). This classification system covers over 60,000 companies and 65,000 securities worldwide from Dow Jones and FTSE Universes. Industry classifications: Oil & Gas,0001; Basic Materials, 1000; Industrials, 2000; Consumer Goods, 3000; Health Care, 4000; Consumer Services, 5000; Telecommunications, 6000; Utilities,7000; Financials, 8000; Technology, 9000. 5.
(13) time t, and 𝑛 is the total number of selected period. The other two will add volume into the consideration to come out trading rules. “Price and Volume Strategy” will generate price and volume MA rules individually first and then consider both rules to have a trading action, which means investors will buy (sell) the stock only when both of price and volume MA rules show buy (sell) signals. Thus Strategy 2 rule becomes like Equation (2).. 𝑝 𝑀𝐴𝑡 (n). ∑𝑛−1 𝑖=0 𝑃𝑡−𝑖 = 𝑛. 𝑀𝐴𝑣𝑡 (n). ∑𝑛−1 𝑖=0 𝑉𝑡−𝑖 = 𝑛. (2). 政 治 大 where 𝑀𝐴 (𝑛) is n-day 立 moving average for volume at time t, 𝑉 𝑣 𝑡. 𝑡. is the trading. ‧ 國. 學. volume at time t, and 𝑛 is the total number of selected period. For Strategy 2, not only the moving average for prices but also the moving average for volumes will be. ‧. taken into account to issue a buy or a sell signal.. sit. y. Nat. “PV Strategy” takes volume as a weight for price and uses the weighted price to. n. al. er. io. make a MA rule. The formula is like Equation (3).. Ch. 𝑀𝐴𝑝𝑣 𝑡 (n) =. i n U. v. 𝑉𝑡−𝑖 i eng 𝑛−1c h × 𝑃𝑡−𝑖 ]. ∑𝑛−1 𝑖=0 [. ∑𝑖=0 𝑉𝑡−𝑖 𝑛. where 𝑀𝐴𝑝𝑣 𝑡 (n) is n-day moving average for weighted price at time t,. (3). 𝑉𝑡−𝑖 𝑛−1 ∑𝑖=0 𝑉𝑡−𝑖. is a. percentage of the trading volume at time t-i to total trading volumes for n days. This strategy can be taken as a transformed MA rules for prices. The prices with higher trading volumes may contain more information and should be paid more attention on, so this strategy can give higher weights to those prices which have higher trading volumes. 6.
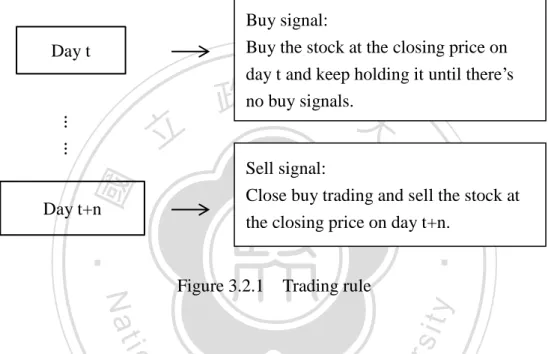
(14) Each strategy will use 5-day MA as the short-term moving average (SMA) and 10, 50, 100, 150, 200 days as the long-term moving average (LMA), so total will be fifteen MA rules. When the short-term moving average breaks the long one from below (above), a buy (sell) signal comes out and investors will buy (sell). Once the following short-term moving average breaks the long one from above (below), investors will close the buy (sell) trade and start to sell (buy) the stock, like Figure 3.2.1: Buy signal: Buy the stock at the closing price on day t and keep holding it until there’s no buy signals.. Day t. ⋮ ⋮. 立. 政 治 大. Day t+n. Trading rule. er. io. sit. y. Nat. Figure 3.2.1. ‧. ‧ 國. 學. Sell signal: Close buy trading and sell the stock at the closing price on day t+n.. From this trading rule, each stock will have several buy times (buy the stock when. al. n. v i n C h(sell the stock when there are buy signals) and sell times there are sell signals) during engchi U. the period from 2005 to April 2011. In order to examine the profitability of these MA rules, I will calculate “Hit Ratio” for each of buy and sell times to see the proportion of positive returns by these MA rules, like Equation (4),. 𝐻𝑖𝑡𝑏 =. 𝐵𝑝 𝐵𝑎𝑙𝑙. ;. 𝐻𝑖𝑡𝑠 =. 𝑆𝑝 𝑆𝑎𝑙𝑙. (4). where 𝐻𝑖𝑡𝑏 (𝐻𝑖𝑡𝑠 ) is the “Hit Ratio” of buy (sell) times, 𝐵𝑝 (𝑆𝑝 ) is the buy (sell) times with positive returns, and 𝐵𝑎𝑙𝑙 (𝑆𝑎𝑙𝑙 ) is total buy (sell) times. The result may. 7.
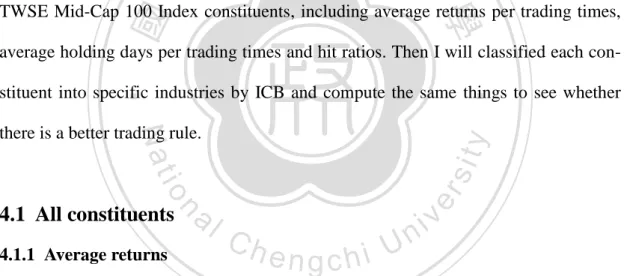
(15) show what kind of trading rules have more opportunities to earn positive returns. I will also compute average return and average holding days per trading times for every trading rule. Hit ratios, average returns and average holding days will be generated not only for all constituents without considering industries but also for specific industries. All of these trading rules are generated under the hypotheses of no transaction costs.. 4. Empirical Results. 政 治 大 or sell trading actions. In this 立part, I will firstly show the average results of all FTSE According to the MA rules, each stock will contain buy and sell signals to do buy. ‧ 國. 學. TWSE Mid-Cap 100 Index constituents, including average returns per trading times, average holding days per trading times and hit ratios. Then I will classified each con-. ‧. stituent into specific industries by ICB and compute the same things to see whether. n. al. er. io. sit. y. Nat. there is a better trading rule.. 4.1 All constituents 4.1.1 Average returns. Ch. engchi. i n U. v. Figure 4.1.1 illustrates the average returns per buy times for each of the three strategies, Price Strategy, Price and Volume Strategy, and PV Strategy, while Figure 4.1.2 documents the same strategies for the average returns per sell times.. 8.
(16) 12. All. r e 10 t 8 u r 6 n % 4. p. (. p+v. ) / b u y. pv 2 0 10. 50. 100. -2. 150. 200. MA rules. 政 治 大. Figure 4.1.1 Average returns per buy times of all constituents. 立. All. ‧. ‧ 國. 學. (. 4 r 3.5 e 3 t u 2.5 r 2 n l % 1.5 1 / ). y. al. n. 10. 50. Ch. 100 MA rules. 150. engchi. er. io. -0.5. sit. 0.5 0. p+v pv. Nat. s e l. p. 200. i n U. v. Figure 4.1.2 Average returns per sell times of all constituents. From these two graphs, the average returns of Price and Volume Strategy are obviously lower than other two strategies for both of buy and sell actions, and they are under 0.5%. For Price and PV strategies, the average returns are quite similar and the average returns of Price Strategy have always been a little better than that of PV Strategy. Besides, we can see up trends with longer days of MA rules for both of Price and PV strategies, especially for buy actions, and buy actions outperform sell actions.. 9.
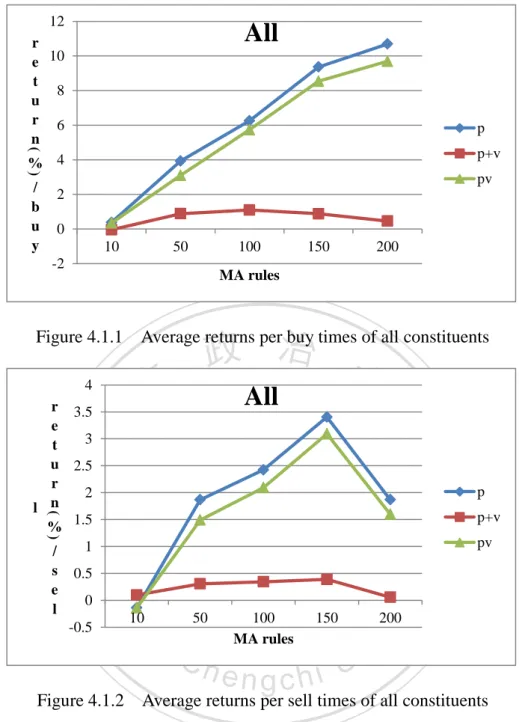
(17) 4.1.2 Average holding days Figure 4.1.3 illustrates the average holding days per buy times for each strategy, and Figure 4.1.4 shows the average holding days per sell times for each strategy. 120 d a y s / b u y. All. 100 h o l d i n g. 80 p. 60. p+v. 40. pv 20. 政 治 大. 0. Figure 4.1.3. 立. 50. ‧ y. sit. al. n. 30. io. 40. er. 50. Nat. 60. 200. All. 70. h o l d i n g. 150. Average holding days per buy times of all constituents. 80. d a y s / s e l l. 100 MA rules. 學. ‧ 國. 10. 20. Ch. 10. engchi. i n U. v. p p+v pv. 0 10. Figure 4.1.4. 50. 100 MA rules. 150. 200. Average holding days per sell times of all constituents. The average holding days of these three strategies are higher with longer MA rules for all strategies, particularly for Price and PV strategies. As for Price and Volume Strategy, it obviously has the shortest holding days no matter for buying or selling actions, which means investors will have more trading times within the same period. 10.
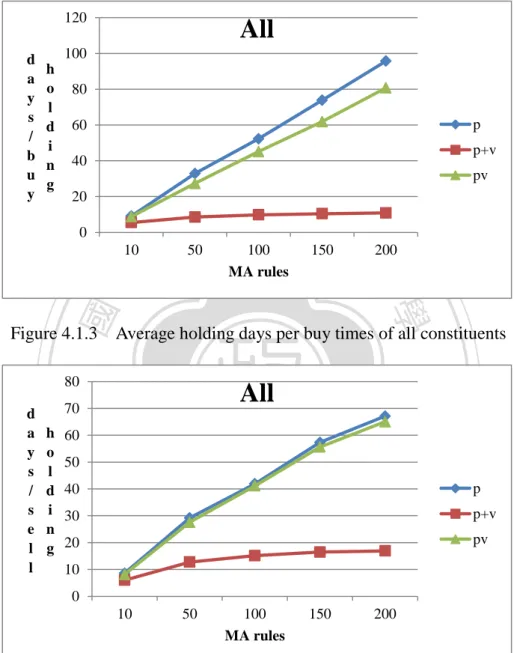
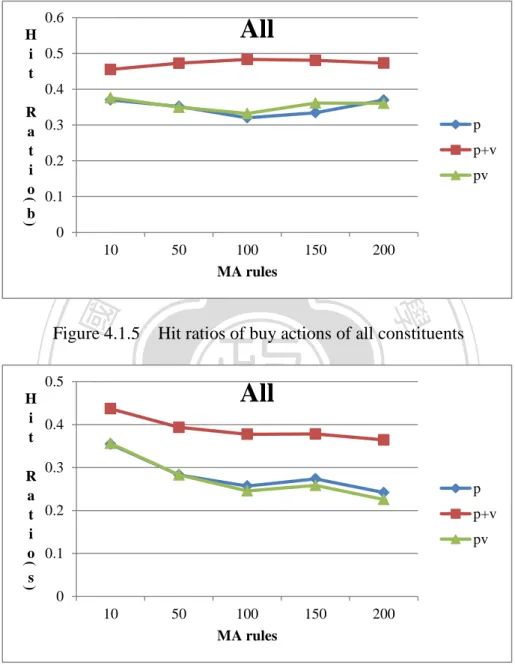
(18) 4.1.3 Hit ratios The hit ratios of buy actions for those three strategies are presented in Figure 4.1.5, and Figure 4.1.6 shows the hit ratios of sell actions for the same strategies. 0.6 H i 0.5 t 0.4. All. R a 0.3 t 0.2 i o 0.1 b 0. p p+v pv. ( ). 10. 立. 50. 政 治 大 100 MA rules. 150. 200. ‧ 國. 學. Figure 4.1.5 Hit ratios of buy actions of all constituents. ‧ y. sit. n. er. io. al. Ch. (. 0.3 R a t 0.2 i o 0.1. All. Nat. 0.5 H i 0.4 t. v. p+v pv. ). s. engchi. i n U. p. 0 10. Figure 4.1.6. 50. 100 MA rules. 150. 200. Hit ratios of sell actions of all constituents. Apparently, Price and Volume Strategy has the highest hit ratio for both buy and sell actions, and the hit ratio of 100-day MA rules with buy actions is the highest one among all trading rules. We can say that within 100 trading times, there are more times with positive returns for Price and Volume Strategy than other two strategies. 11.
(19) For buy actions, the hit ratios do not have trends with MA rules, however for sell actions, the hit ratios are getting lower with longer MA rules. Although we can determine which strategy has better hit ratio, the differences between all MA rules for all strategies are not dominant. All hit ratios are between 0.2 and 0.5.. From the empirical results for all constituents, buy signals have higher average returns, longer average holding days and higher hit ratios than sell signals. Moreover, Price and Volume Strategy has the highest hit ratios around 0.4 but lowest average. 政 治 大 catch extreme prices to get large profits, but it provides higher accuracy of earning 立 returns and holding days. It shows that using Price and Volume Strategy may not. positive returns for trading times. However, the profits may be eroded by transaction. ‧ 國. 學. costs in the real world since Price and Volume Strategy has shortest average holding. ‧. days and more transaction times.. sit. y. Nat. io. er. After present the empirical results of all constituents, let’s see the results for stocks of specific industries. The major industries of FTSE TWSE Mid-Cap 100 Index. al. n. v i n C Industrials, constituents are Basic Materials, Goods, Consumer Services, h e n g cConsumer hi U Financials and Technology.. 4.2 Basic Materials 4.2.1 Average returns Figure 4.2.1 and Figure 4.2.2 are the results of average returns per buy and sell times of the stocks which belong to Basic and Materials.. 12.
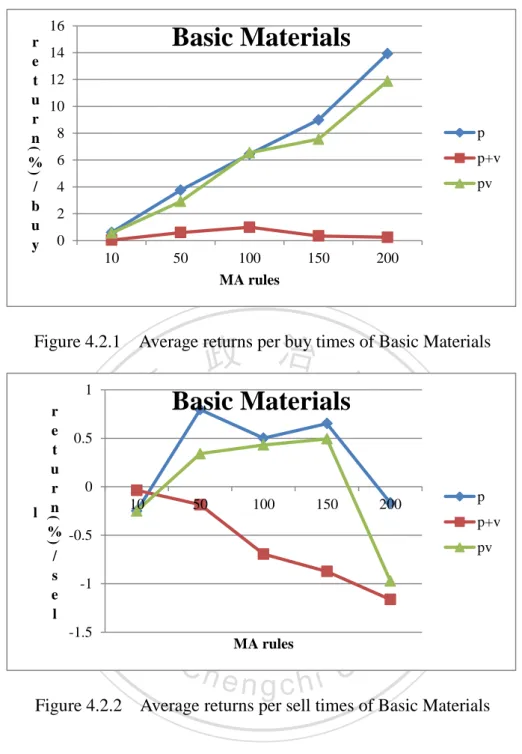
(20) 16 r 14 e t 12 u 10 r n 8 % 6. Basic Materials. p. (. p+v. ) / b u y. pv. 4 2 0 10. 50. 100 MA rules. 150. 200. 政 治 大. Figure 4.2.1 Average returns per buy times of Basic Materials. 10. 50. 100. 150. 200. ‧. ‧ 國. 立Basic Materials. 學. (. 1 r e 0.5 t u 0 r n l % -0.5 ). y. sit. io. n. al. er. -1 -1.5. p+v pv. Nat. / s e l. p. Ch. MA rules. engchi. i n U. v. Figure 4.2.2 Average returns per sell times of Basic Materials. The average returns of those three strategies with different actions show different directions for MA rules. The highest average return of Price Strategy with buy actions is the one using 200-day MA rule while using 50-day MA rule can get the highest average returns of this strategy with sell actions. Price and Volume Strategy gets the worst average returns, even has minus values for all MA rules with sell actions.. 4.2.2 Average holding days 13.
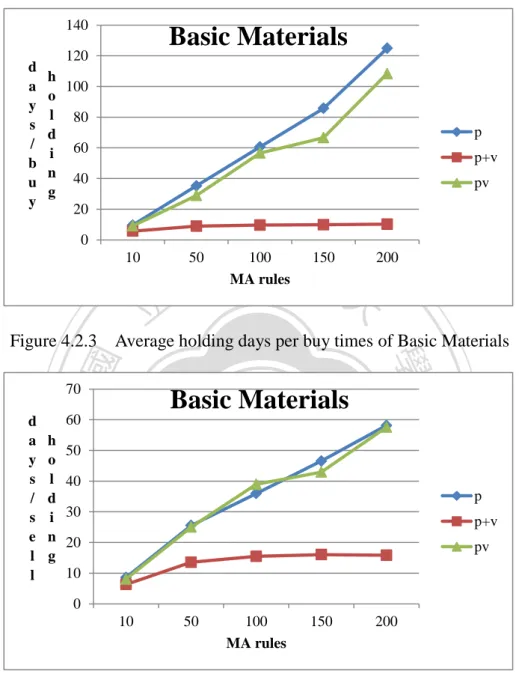
(21) Figure 4.2.3 and Figure 4.2.4 illustrate average holding days per buy and sell times of stocks belong to Basic Materials. 140 d a y s / b u y. Basic Materials. 120 h 100 o l 80 d i 60 n 40 g 20. p p+v pv. 0 10. 政 治 大. 50. 立. 100 MA rules. 150. 200. Figure 4.2.3 Average holding days per buy times of Basic Materials. ‧ 國. 學. 70. Basic Materials. 50. y. al. n. 20. sit. 30. er. 40. io. h o l d i n g. ‧. 60. Nat. d a y s / s e l l. 10 0 10. Ch 50. engchi U 100 MA rules. 150. v ni. p p+v pv. 200. Figure 4.2.4 Average holding days per sell times of Basic Materials. These two graphs seems similar but the average holding days per buy times are longer than those per sell times, especially for Price Strategy and PV Strategy. As for Price and Volume Strategy, the average holding days keep being short no matter for buy or sell actions.. 14.
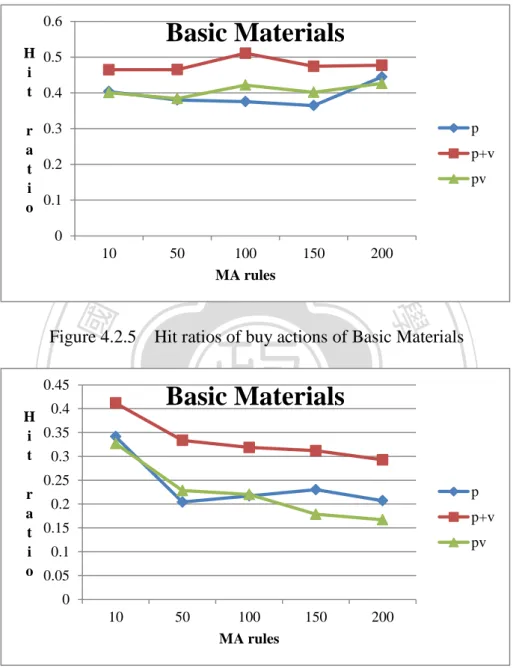
(22) 4.2.3 Hit ratios Figure 4.2.5 and Figure 4.2.6 are hit ratios of buy and sell actions for those stocks belong to Basic Materials. 0.6. Basic Materials. H 0.5 i t 0.4 p. r 0.3 a t 0.2 i o 0.1. p+v pv. 0 10. 立. 50. 政 治 大 100 MA rules. 150. 200. ‧ 國. 學. Figure 4.2.5 Hit ratios of buy actions of Basic Materials. y. sit. n. al. er. io. 0.25 r 0.2 a t 0.15 i 0.1 o 0.05. Basic Materials. Nat. 0.4 H i 0.35 t 0.3. ‧. 0.45. Ch. engchi. i n U. v. p p+v pv. 0 10. 50. 100 MA rules. 150. 200. Figure 4.2.6 Hit ratios of sell actions of Basic Materials. The hit ratio diagram of buy actions shows almost three flat lines for three strategies while the three lines of sell actions have negative slope. The hit ratios of buy actions obviously are better than those of sell actions.. 15.
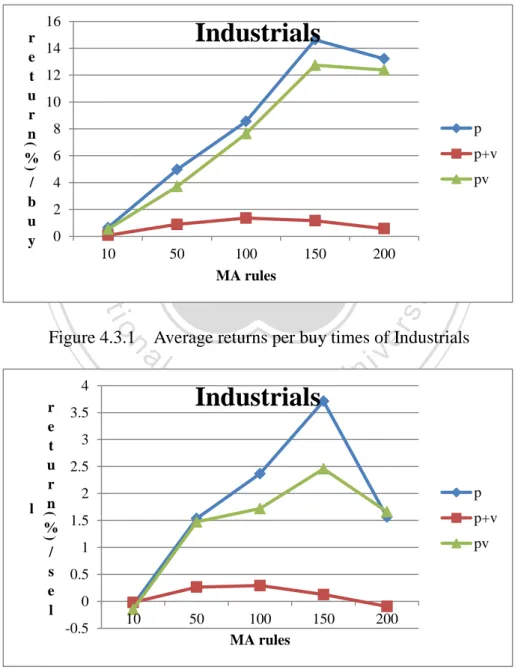
(23) Overall buy actions outperform sell actions with higher average returns and hit ratios no matter what the strategy or MA rule are used.. 4.3 Industrials 4.3.1 Average returns Figure 4.3.1 and Figure 4.3.2 are the results of average returns per buy and sell times of the stocks which belong to Industrials.. 0. 10. 50. 150. 200. pv. er. io. sit. Nat. 100 MA rules. p+v. ‧. 2. p. y. 4. 政 治 大. 立. ‧ 國. ) / b u y. Industrials. 學. (. 16 r 14 e t 12 u 10 r n 8 % 6. Figure 4.3.1 Average returns per buy times of Industrials. n. al. 4 r 3.5 e 3 t u 2.5 r 2 n l % 1.5 1 /. Ch. engchi Industrials. i n U. v. p. (. p+v. ). pv. s e l. 0.5 0 -0.5. 10. 50. 100 MA rules. 150. 200. Figure 4.3.2 Average returns per sell times of Industrials. 16.
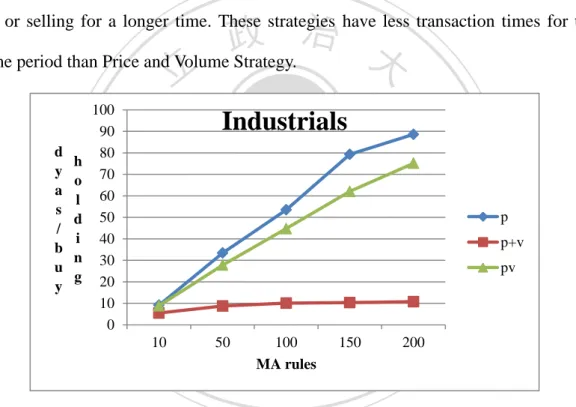
(24) Price Strategy gets the highest average returns of both buy and sell actions. For Price and PV strategies, using 150-day MA rules can get the highest average returns of both buy and sell actions. There is no any significant differences between buy and sell actions of Price and Volume Strategy. Overall buy actions outperform sell actions.. 4.3.2 Average holding days Figure 4.3.3 and Figure 4.3.4 illustrate average holding days per buy and sell times of Industrials. Apparently Price and PV strategies hold the stocks to keep buy-. 政 治 大 same period than Price and Volume Strategy. 立. ing or selling for a longer time. These strategies have less transaction times for the. p+v pv. er. sit. p. y. ‧ 國. ‧. al. n 10. 學. io. h o l d i n g. Industrials. Nat. d y a s / b u y. 100 90 80 70 60 50 40 30 20 10 0. Ch 50. 100 MA rules. 150. engchi. v i200 n U. Figure 4.3.3 Average holding days per buy times of Industrials. 17.
(25) 70 d a y s / s e l l. Industrials. 60 h o l d i n g. 50 40 p 30. p+v. 20. pv. 10 0 10. 50. 100 MA rules. 150. 200. 政 治 大. Figure 4.3.4 Average holding days per sell times of Industrials. 立. 4.3.3 Hit ratios. ‧ 國. 學. Figure 4.3.5 and Figure 4.3.6 show the results of hit ratios per buy and sell times. al. n. r 0.3 a t 0.2 i o 0.1. sit. y. Industrials. er. io. H 0.5 i t 0.4. Nat. 0.6. ‧. of Industrials.. Ch. engchi. i n U. v. p p+v pv. 0 10. 50. 100 MA rules. 150. 200. Figure 4.3.5 Hit ratios of buy actions of Industrials. 18.
(26) 0.5. Industrials. H 0.4 i t 0.3 p. r a 0.2 t i 0.1 o. p+v pv. 0 10. 50. 100 MA rules. 150. 200. 政 治 大. Figure 4.3.5 Hit ratios of sell actions of Industrials. 立. Price and Volume Strategy has the highest hit ratios, and three lines of these three. ‧ 國. 學. strategies are flat of buy actions while they are getting lower with longer days of MA. er. io. sit. y. Nat. than sell actions.. ‧. rules of sell actions. Overall these three strategies perform better with buy actions. Form the results of Industrials, Price and Volume Strategy is still the one with. al. n. v i n lowest average returns, shortestC average holding days,Uand highest hit ratios. It seems hengchi. like PV Strategy uses volumes as weights of prices does not perform better than Price Strategy which only use price as a factor to build MA rules.. 4.4 Consumer Goods 4.4.1 Average returns Figure 4.4.1 and Figure 4.4.2 present the average returns per buy and sell times of the stocks which are belong to Consumer Goods.. 19.
(27) 14 r e 12 t 10 u r 8 n 6 % 4 / b 2 u y 0. Consumer Goods. p. (. p+v. ). pv. 10. 50. 100 MArules. 150. 200. 政 治 大. Figure 4.4.1 Average returns per buy times of Consumer Goods. 立Consumer Goods. ‧. ‧ 國. 學. (. 2.5 r 2 e t u 1.5 r n 1 l % / 0.5 ). y. sit. 0. 100. Ch. MA rules. n. al. 50. 150. engchi. 200. er. io. 10. -0.5. p+v pv. Nat. s e l. p. i n U. v. Figure 4.4.2 Average returns per sell times of Consumer Goods. For Price and PV strategies, buy actions with longer days of MA rules get higher average returns while middle days of MA rules can have better average returns for sell actions.. 4.4.2 Average holding days The average holding days per buy and sell times of Consumer Goods are illustrated as Figure 4.4.3 and Figure 4.4.4. 20.
(28) 120 d a y s / b u y. Consumer Goods. 100 h o l d i n g. 80 p. 60. p+v. 40. pv 20 0 10. 50. 100 MA rules. 150. 200. 政 治 大. Figure 4.4.3 Average holding days per buy times of Consumer Goods. 立Consumer Goods. 70 60. ‧ 國. 學. 50 40. ‧. 30 20. io. 0. pv. y. al. n. 10. Figure 4.4.4. p+v. sit. 10. p. 50. Ch. 100 MA rules. 150. engchi. er. h o l d i n g. Nat. d a y s / s e l l. 200. i n U. v. Average holding days per sell times of Consumer Goods. Price Strategy has the longest average holding days no matter for buying or selling stocks. Also we can see that every strategy has an uptrend of average holding days with longer days of MA rules, which means the transaction times will be lower when using longer days of MA rules.. 4.4.3 Hit ratios Figure 4.4.5 and Figure 4.4.6 are the results of hit ratios for buy and sell actions of 21.
(29) Consumer Goods. 0.6. Consumer Goods. H 0.5 i t 0.4 p. r 0.3 a t 0.2 i o 0.1. p+v pv. 0 10. 50. 100 MA rules. 150. 200. 政 治 大 Figure 4.4.5 Hit ratios of buy actions of Consumer Goods 立. al. n 10. y. p+v pv. er. io. 0. p. sit. Nat. r a 0.2 t i 0.1 o. ‧. ‧ 國. Consumer Goods. H 0.4 i t 0.3. 學. 0.5. Ch. 50. 100 MA rules. 150. engchi. iv 200 n U. Figure 4.4.6 Hit ratios of sell actions of Consumer Goods. Even though Price and Volume Strategy gets the highest hit ratios for both buy and sell actions, none of these strategies can have hit ratios over 50%, which means there are more than a half of trading times get negative returns.. After presenting the results of Consumer Goods, we can see that Price and Volume Strategy is still the one outstanding from other strategies. 22.
(30) 4.5 Consumer Services 4.5.1 Average returns Figure 4.5.1 and Figure 4.5.2 illustrate average returns per buy and sell times of Consumer Services. 25. Consumer Services. r e 20 t u 15 r n 10 % / 5. p. (. p+v. ). 政 治 大. 立. 0 10. 100. 150. 200. 學. -5. 50. ‧ 國. b u y. pv. MA rules. n. (. 10. sit. io. al. y. Consumer Services. er. Nat. 2 r 1.5 e t 1 u 0.5 r 0 l n % -0.5 / s -1 e -1.5 l -2. ‧. Figure 4.5.1 Average returns per buy times of Consumer Services. Ch 50. ). i e n100g c h 150. i n U. v. 200. p p+v pv. MA rules. Figure 4.5.2 Average returns per sell times of Consumer Services. Price and Volume Strategy maintains flat lines for buy and sell actions. Price and PV strategies have highest average returns of buy actions when using 200-day MA rule and highest average returns of sell actions when using 150-day MA rule. 23.
(31) 4.5.2 Average holding days Figure 4.5.3 and Figure 4.5.4 present average holding days per buy and sell times of Consumer Services. 140 d a y s / b u y. Consumer Services. 120 h 100 o l 80 d i 60 n 40 g 20. p p+v pv. 政 治 大. 0 10. 立. 50. 100 MA rules. 150. 200. ‧ 國. 學. Figure 4.5.3 Average holding days per buy times of Consumer Services. Consumer Services. 70. 40. y. al. n. 30. sit. 50. er. 60. io. h o l d i n g. Nat. d a y s / s e l l. ‧. 80. 20. Ch. 10. engchi. i n U. v. p p+v pv. 0 10. 50. 100 MA rules. 150. 200. Figure 4.5.4 Average holding days per sell times of Consumer Services. The average holding days of these three strategies of both buy and sell actions have uptrend lines with longer days of MA rules, and on average the buy actions have longer average holding days than sell actions for all these three strategies.. 24.
(32) 4.5.3 Hit ratios As for hit ratios of Consumer Services, Figure 4.5.5 and Figure 4.5.6 are the results of buy and sell actions of the three strategies. 0.6. Consumer Services. h 0.5 i t 0.4 p. r 0.3 a t 0.2 i o 0.1. p+v pv. 0 10. 立. 50. 政 治 大 100 MA rules. 150. 200. ‧ 國. 學. Figure 4.5.5 Hit ratios of buy actions of Consumer Services. y. sit. n. al. er. io. r a 0.2 t i 0.1 o. Consumer Services. Nat. h 0.4 i t 0.3. ‧. 0.5. Ch. engchi. i n U. v. p p+v pv. 0 10. 50. 100 MA rules. 150. 200. Figure 4.5.6 Hit ratios of sell actions of Consumer Services. Price and Volume Strategy still outperform the other strategies, however, the PV Strategy of buy actions when using 200-day MA rules have highest hit ratio. For both buy and sell actions, PV Strategy has better results than Price Strategy, and it shows use volumes as weights of prices can generate more positive returns of trading times. 25.
(33) 4.6 Financials 4.6.1 Average returns Let’s take a look at Financials industry. Figure 4.6.1 and Figure 4.6.2 show average returns per buy and sell times of Financials industry. 8. Financials. 7 6 5. p. 4. (. r e t u r n. p+v. % 3. 政 治 大. ) / 2 b 1 u y 0. 立. 50. 150. 200. 學. 100 MA rules. ‧ 國. 10. pv. Nat. n. (. Ch. ) s e l. sit. io. al. y. Financials. er. 4 r 3.5 e 3 t u 2.5 r 2 l n % 1.5 1 /. ‧. Figure 4.6.1 Average returns per buy times of Financials. engchi. i n U. v. p p+v pv. 0.5 0 -0.5. 10. 50. 100 MA rules. 150. 200. Figure 4.6.2 Average returns per sell times of Financials. For buy actions, the highest average return of Price and Volume Strategy is which using 100-day MA rule, while the highest results of Price and PV strategies are which using 200-day MA rules. For sell actions, Price Strategy gets the highest value 26.
(34) among these three strategies when using 150-day MA rule but the lowest one when using 200-day MA rule. Overall, every strategy can get positive average returns for almost every MA rule.. 4.6.2 Average holding days Figure 4.6.3 and Figure 4.6.4 are average holding days per buy and sell times of Financials.. 政 治 大. 立. p. 50. 150. 200. er. io. sit. Nat. 100 MA rules. pv. y. 10. p+v. ‧. ‧ 國. h o l d i n g. Financials. 學. d a y s / b u y. 100 90 80 70 60 50 40 30 20 10 0. Figure 4.6.3 Average holding days per buy times of Financials. n. al. 70 d a y s / s e l l. Ch. engchi Financials. 60 h o l d i n g. i n U. v. 50 40 p 30. p+v. 20. pv. 10 0 10. 50. 100 MA rules. 150. 200. Figure 4.6.4 Average holding days per sell times of Financials. 27.
(35) No matter for buying or selling the stocks belong to Financials industry, these three strategies have uptrend lines with longer days of MA rules, and Price and PV strategies have longer average holding days of both buy and sell actions. The average holding days of Price and Volume Strategy are not over 20 days.. 4.6.3 Hit ratios Figure 4.6.5 and Figure 4.6.6 show hit ratios of buy and sell actions of Financials. 0.6. Financials. h 0.5 i t 0.4. 政 治 大. 立. p. 0. 50. 150. 200. er. io. sit. Nat. 100 MA rules. pv. y. 10. p+v. ‧. ‧ 國. 學. r 0.3 a t 0.2 i o 0.1. Figure 4.6.5 Hit ratios of buy actions of Financials. n. al. 0.5. Ch. engchi Financials. h 0.4 i t 0.3. i n U. v. p. r a 0.2 t i 0.1 o. p+v pv. 0 10. 50. 100 MA rules. 150. 200. Figure 4.6.6 Hit ratios of sell actions of Financials. 28.
(36) Whatever actions are taken, Price and Volume Strategy gets the highest hit ratios. There is no significant the best MA rule for each strategy of buy actions, but using shorter MA rules can get higher hit ratios of sell actions. Overall buy actions outperform sell actions.. 4.7 Technology 4.7.1 Average returns The last major industry classification that FTSE TWSE Mid-Cap 100 Index con-. 政 治 大. stituents have is Technology. Figure 4.7.1 and Figure 4.7.2 present average returns per. 立. 10 -2. a l 50 Ch. n. 0. p+v. sit. 2. io. / b u y. p. pv. er. ). %. Nat. (. 4. ‧. 6. ‧ 國. 8. Technology. 學. 10 r e t u r n. y. buy and sell times of Technology.. 100. 150. engchi. MA rules. 200 iv n U. Figure 4.7.1 Average returns per buy times of Technology. 29.
(37) 7. 5 4 p 3. ). 2. / s e l. Technology. 6. (. r e t u r n l %. p+v pv. 1 0 10. -1. 50. 100. 150. 200. MA rules. 政 治 大. Figure 4.7.2 Average returns per sell times of Technology. 立. 150-day MA rule can have the best average returns of both buy and sell times of. ‧ 國. 學. PV Strategy, and Price Strategy can get the best average returns of buy actions when. ‧. using the longest days of MA rules and get the best of sell actions when using 150-day. sit. y. Nat. MA rule. As for Price and Volume Strategy, it always keeps flat lines and the average. io. n. al. er. returns are between -1% and 1%.. 4.7.2 Average holding days. Ch. engchi. i n U. v. Figure 4.7.3 and Figure 4.7.4 are average holding days per buy and sell times of Technology.. 30.
(38) d a y s / b u y. h o l d i n g. 100 90 80 70 60 50 40 30 20 10 0. Technology. p p+v pv. 10. 50. 100 MA rules. 150. 200. 政 治 大. Figure 4.7.3 Average holding days per buy times of Technology. Technology. ‧. ‧ 國. 學 p+v pv. y. sit. io. al. n. 10. p. 50. Ch. 100 MA rules. 150. engchi. er. h o l d i n g. 立. Nat. d a y s / s e l l. 100 90 80 70 60 50 40 30 20 10 0. 200. i n U. v. Figure 4.7.4 Average holding days per sell times of Technology. There is no significant differences between the average holding days of buy actions and sell actions for each strategy. Price and Volume Strategy is still the one with shortest average holding days.. 4.7.3 Hit ratios Figure 4.7.5 and Figure 4.7.6 are hit ratios of buy and sell actions of Technology.. 31.
(39) 0.6. Technology. h 0.5 i t 0.4 p. r 0.3 a t 0.2 i o 0.1. p+v pv. 0 10. 50. 100 MA rules. 150. 200. 政 治 大. Figure 4.7.5 Hit ratios of buy actions of Technology. 立. 0.5. Technology. y. sit. al. n. 10. p+v. 50. Ch. 100 MA rules. 150. engchi. er. io. 0. p. pv. Nat. r a 0.2 t i 0.1 o. ‧. ‧ 國. 學. h 0.4 i t 0.3. 200. i n U. v. Figure 4.7.6 Hit ratios of sell actions of Technology. All of these three strategies have an almost flat line of buy and sell actions. Although Price and Volume Strategy gets the highest hit ratios, none of these have hit ratios over 0.5.. After going through the results of different stocks belong to different industries, we can find that Price and Volume Strategy is always the one with the lowest average returns, shortest average holding days and highest hit ratios. For Basic Materials and 32.
(40) Consumer Services, Price and Volume Strategy can even have hit ratios over 0.5 when using specific MA rules with buy actions. As for the other two strategies, Price Strategy and PV Strategy have similar results and most of the average returns and hit ratios of Price Strategy are a little higher than those of PV Strategy except Consumer Services. We can say that both of these two strategies can catch extreme price movements to earn large profits for one trading time. Overall using volume as weight of price to make MA rules does not have significant better performance than using only price to make MA rules.. 政 治 大 longer days of MA rules while there are specific MA rules outperform when taking 立. We can also find that for average returns, buy actions have trends when using. sell actions. No matter for buying or selling, average holding days have uptrends with. ‧ 國. 學. longer days of MA rules, and buy signals keep longer days within one trading. As for. ‧. hit ratios, most of the results of buy actions present no difference between MA rules. y. sit. io. n. al. er. of MA rules.. Nat. within a strategy, however, sell actions have lower hit ratios when using longer days. 5. Conclusions. Ch. engchi. i n U. v. This article examines the profitability of technical analysis for FTSE TWSE Mid-Cap Taiwan 100 Index constituents under the hypothesis of no transaction costs. It is accomplished through the use of three strategies and fifteen moving average rules that only buy (sell) the securities when short-term MA breaks long-term MA from below (above). To realize the profitability of these MA rules, I show the average returns per trading times and hit ratios of buy and sell signals for all constituents. I present the phenomenon of using price and weighted price as factors to make MA rules which are Price and PV strategies to their ability to catch extreme price movements to have 33.
(41) more returns for one trading times. On the contrary, Price and Volume Strategy is a more conservative strategy which considers both price and volume MA rules to make a trading decision, and it has more percentage of earning positive returns even though it cannot have higher average returns per trading times. No matter what the strategy is, buy signals consistently generate higher average returns than sell signals. I also illustrate these outcomes for individual industry classifications. The results have no big differences but more up-and-down with those of all constituents without considering industries. PV Strategy performs better in specific industry like Consumer. 政 治 大 volumes as weights of prices has no better performance than only using prices. This 立. Services, however, it has worse outcome than other two strategies. Apparently, taking. result shows what it believes prices with higher volumes have more meaning may be. ‧ 國. 學. wrong. As for Price and Volume Strategy, it is still the one with the lowest average. ‧. returns and more percentage of positive returns, and some industries like Basic Mate-. sit. y. Nat. rials and Consumer Services can get higher than 50% of positive returns which is bet-. io. er. ter than that of without classifying industries.. Although Price and Volume Strategy can earn more times of positive returns, it. al. n. v i n has more transactions for every C industry. Once taking U h e n g c h i transaction costs into considera-. tion, the positive returns of this strategy may be eroded. Readers can compare the average returns per trading times with the transaction costs of Taiwan stock market to see the possible outcome when considering transaction costs. Overall the outcomes are not good. It can say that technical analysis like moving average cannot have good performances on these stocks. Finally directions for future study, it could be the examination of these results. with considering transaction costs. Although I present some phenomenon when using these tools, this paper is lack of examining the predictability of moving average on these stocks. Besides, what I use to make moving average rules are closing prices. It 34.
(42) should use the opening prices of the next day to avoid some price impact. Future studies can also use other technical analysis to examine the profitability on these stocks.. References Fama E. F., 1970, “Efficient capital markets: A review of the theory and empirical work”, Journal of Finance 25, 383-416. 立. 政 治 大. Bodie, Z., A. Kane, et al., 2005, “Investments”, sixth ed., 373-374.. ‧ 國. 學. ‧. Park, C. H. and S. H. Irwin, 2004, “The Profitability of Technical Analysis: A Review”. al. er. io. sit. y. Nat. Brock W., Lakonishock J. and LeBaron B., 1992, “Simple technical trading rules and the stochastic properties of stock returns”, Journal of Finance 47, 1731-1764.. n. Bessembinder H., Chan K., 1995, “The profitability of technical trading rules in the Asian stock markets”, Pacific-Basin Finance Journal 3, 257-284.. Ch. engchi. i n U. v. Mitchell R. and Ricardo P.C. Leal, 1999, “Tests of technical trading strategies in the emerging equity markets of Latin America and Asia”, Journal of Banking & Finance 23, 1887-1905. Blume L., Easley D. and O'Hara M., 1994, “Market statistics and technical analysis: The role of volume”, Journal of Finance 49, 153-181. Ramazan G. and Thanasis S., 1998, “Moving average rules, volume and the predictability of security returns with feedforward networks”, Journal of Forecasting 17, 401-414.. 35.
(43) Appendix A:FTSE TWSE Mid-Cap Taiwan 100 Index constituents Stock Code. Company Name. ICB. Stock Code. Company Name. ICB. 1227. Standard Foods Corporation. 3577. 2511. Prince Housing & Development Corp.. 8633. 1304. Usi Corporation. 1357. 2542. Highwealth Construction Corp.. 8633. 1314. China Petrochemical Development Corporation. 1357. 2545. Huang Hsiang Construction Corporation. 2357. 1319. Tong Yang Industry Co.,Ltd.. 3355. 2547. Radium Life Tech. Co., Ltd.. 8633. 1409. Shinkong Synthetic Fiber Corporation. 3763. 1434. 8633. Formosa Taffeta Co., Ltd.. 2548 Huaku Development Co., Ltd. 政 治 Evergreen 大 Marine Corp (Tai3763 2603. 1440. Tainan Spinning Co., Ltd.. 3763. 2605. Sincere Navigation Corporation. 2773. 1503. Shihlin Electric & Engineering Corp.. 2733. 2606. U-Ming Marine Transpost Corp.. 2773. 1504. TECO Electric & Machinery Company. 3722. 2607. Evergreen International Storage & Transport. 1605. Walsin Lihwa Corporation. 2733. 2609. 1704. LCY Chemical Corp. 1357. 2610. 1710. Oriental Union Chemical Corp.,. 1717. Eternal Chemical Co Ltd. 1357. 2707. Formosa International Hotels Corporation. 5753. 1723. China Steel Chemical Co.,. 1357. 2723. GOURMET MASTER CO LTD TWD10. 5757. 1802. Taiwan Glass Ind. Corp.. 2353. 2823. China Life Insurance Co., Ltd.. 8575. 1737. 2833. Taiwan Life Insurance Co., Ltd.. 8575. 2773. 2777. y. ‧. ‧ 國. wan) Ltd.. 學. Nat. n. al. Yuen Foong Yu Paper Mfg.Co., Ltd.. Corp.. sit. Yang Ming Marine Transport. er. io. 1907. 立. 2773. China Airlines Ltd.. 5751. C1353 Wan Hai Lines Ltd. U h e n g2615 i h c. 2773. v ni. 2006. Tung Ho Steel Enterprise Corp.. 1757. 2834. Taiwan Business Bank. 8355. 2014. Chung Hung Steel Co., Ltd.. 1757. 2854. Polaris Securities Co., Ltd.. 8777. 2015. Feng Hsin Iron & Steel Co., Ltd.. 1757. 2855. President Securities Corp.. 8777. 36.
(44) E.Sun Financial Holding Com-. 2049. Hiwin Technologies Corp. 2757. 2884. 2101. Nankang Rubber Tire Corp., Ltd.. 3357. 2887. Taishin Financial Holding Co., Ltd.. 8355. 2103. TSRC Corporation. 1353. 2889. Waterland Financial Holdings. 8777. 2201. Yulon Motor Co., Ltd.. 3353. 2903. Far Eastern Department Stores Ltd.. 5373. 2204. China Motor Corporation. 3353. 2915. Ruentex Industries Limited. 3763. 2315. Mitac International Corp.. 9572. 3008. Largan Precision Co., Ltd.. 3745. 2323. CMC Magnetics Corporation. 9572. 3034. Novatek Microelectronics Corp.. 9576. 2327. Yageo Corporation. 2733. 3035. Faraday Technology Corp.. 9576. 2328. Pan-International Industrial Corp.. 2733. 2337. Macronix International Company, Ltd.. 9576. 3044. Tripod Technology Corporation. 2344. Winbond Electronics Corp.. 9576. 3049. HannStar Touch Solution Inc. 2737. 2349. Ritek Corporation. 2737. 3189. Kinsus Interconnect Technology Corp.. 9576. 2352. Qisda Corporation. 9572. 3406. Genius Electronic Optical Co., Ltd.. 2737. 2356. Inventec Corporation. 9572. 3474. Inotera Memories, Inc.. 9576. 2360. Chroma Ate Inc.. 2733. 3504. Young Optics Inc.. 2733. 2362. Clevo Co.. 9572. 3514. Gintech Energy Corporation. 583. 2371. Tatung Co.. 2374. Ability Enterprise Co., Ltd.. 9574. 3702. Wpg Holdings Limited. 9576. 2379. Realtek Semiconductor Corp. 9576. 5522. Farglory Land Development Co., Ltd.. 8633. 2384. Wintek Corp.. 2737. 6005. Capital Securities Corp.. 8777. 2385. Chicony Electronics Co., Ltd.. 9572. 6116. Hannstar Display Corp. 9572. 2388. Via Technologies, Inc.. 9576. 6176. Radiant Opto-Electronics Corp.. 2733. 2392. Cheng Uei Precision Industry Co., Ltd.. 2737. 6239. Powertech Technology Inc.. 9576. 2393. Everlight Electronics Co., Ltd.. 2733. 6286. Richtek Technology Corp.. 9576. 2395. Advantech Co., Ltd.. 9572. 8008. Lite-On It Corporation. 9572. 治 Unimicron Technology Corp. 政 3037 大 學. 8355. 2733 2733. ‧. ‧ 國. 立. pany, Ltd.. n. e n g3622 chi. 9572. 37. er. io. Ch. sit. y. Nat. al. iv n Young U Fast Optoelectronics Co., Ltd.. 2733.
(45) 2408. Nanya Technology Corporation. 9576. 8046. Nan Ya Printed Circuit Board Corporation. 2733. 2451. Transcend Information, Inc.. 9576. 9907. Ton Yi Industrial Corp.. 1755. 2474. Catcher Technology Co., Ltd.. 2757. 9917. Taiwan Secom Co., Ltd.. 2791. 2489. Amtran Technology Co., Ltd.. 3743. 9921. Giant Manufacturing Co., Ltd.. 3745. 2501. Cathay Real Estate Development Co., Ltd.. 8633. 9933. Ctci Corporation. 2357. 2504. Goldsun Development & Construction Co., Ltd.. 2353. 9945. Ruentex Development Co., Ltd.. 5373. Source: TWSE (2011.4.29). 立. 政 治 大. ‧. ‧ 國. 學. n. er. io. sit. y. Nat. al. Ch. engchi. 38. i n U. v.
(46)
數據
+7
Outline
相關文件
勞動部勞動力發展署桃竹苗分署-幼 獅職業訓練場(前行政院勞工委員會 職業訓練局青年職業訓練中心)、臺 北市立南港高級工業職業學校 39 資訊與網路技術 1 林家諄
For periodic sequence (with period n) that has exactly one of each 1 ∼ n in any group, we can find the least upper bound of the number of converged-routes... Elementary number
• To the right of the Draw mode buttons you find push buttons through which you can access all the functions that you need to define and solve the PDE problem: define
According to the historical view, even though the structure of the idea of Hua-Yen Buddhism is very complicated, indeed, we still believe that we can also find out the
Reading Task 6: Genre Structure and Language Features. • Now let’s look at how language features (e.g. sentence patterns) are connected to the structure
• Content demands – Awareness that in different countries the weather is different and we need to wear different clothes / also culture. impacts on the clothing
一、下表為一年三班票選衛生股長 的得票結果,得票數最多的為 衛生股長,請完成表格並回答 問題(○代表票數). (
Mendenhall ,(1992), “The relation between the Value Line enigma and post-earnings-announcement drift”, Journal of Financial Economics, Vol. Smaby, (1996),“Market response to analyst
