Dynamic TrafÞc Awareness in Wireless Multi-Channel Data Dissemination
Chih-Lin Hu†, Ming-Syan Chen† and Hao-Ping Hung‡ †Department of Electrical Engineering
‡Graduate Institute of Communication Engineering
National Taiwan University Taipei, Taiwan, R.O.C.
Abstract— Data dissemination by the use of periodic broadcast
is an important scalable data delivery mechanism due to the explosion of wireless information services. Consider that the recent emergence of a multi-channel data dissemination model has attracted much research attention. In this paper, we devise an on-line multi-channel trafÞc awareness (MCTA) mechanism by exploiting the notion of client impatience against trafÞc dynamics in a multi-channel data dissemination environment. The design of MCTA performs a cyclical estimation of dynamic access frequency distribution in response to dynamic trafÞc changes. The experimental results show that MCTA is not only able to attain an estimated distribuion of high accuracy, but also of low complexity and robustness without performance degradation.
I. INTRODUCTION
Previous studies addressed the push-based data broad-cast/dissemination model to resolve the scalability by the explosion of data intensive applications and to minimize the power/energy consumption due to the restriction of mobile client devices, especially in wireless network environments which have the communication asymmetry in terms of band-width and information ßow [1][3][9][16]. For example, the downward bandwidth is larger than the opposite one in satel-lite networks, radio networks and cellular networks. Also, the information ßow is asymmetric in Web surÞng, instant messaging systems and digital video broadcasting services, to name a few. In the setting of data broadcasting, the server periodically delivers data items to a large client populations through a shared medium. Clients listen on the broadcast channel and download data items without explicit access requests. Therefore, downloading broadcast data consumes less power than actively interacting data request/reception [11]. To efÞciently disseminate data, generally, the server can use the pull, the push or the hybrid data delivery model. The mean access time, speciÞcally from the moment at which a client requests an item till the moment that the item is downloaded completely, is the major performance measure [8]. In a push delivery, the mean access time, half a cycle time, can be lengthy due to the existence of many broadcast items. However, a pull delivery responding to data requests is not scalable under a heavy workload. Thus, a hybrid model strikes a compromise [2][6][15]. Particularly, all items are classiÞed into the push/pull (hot/cold) mode according to their access frequencies. The server periodically pushes hot items by broadcasting and carries cold items in the pull manner.
The recent advent of the multi-channel data dissemination has attracted many research attention [12][14]. In [12], the work gives an analytical study of the multi-channel partition.
The work in [14] designs the multi-channel caching scheme. In [7], the broadcast disk programs on multiple channels are dynamically generated to improve energy saving. [4] designs an adaptive balanced hybrid data delivery scheme. For the purpose of application scalability, fault tolerance or reconÞguration of adjacent cells, multiple downward channels are allocated on discontiguous spectrums. In practice, it is possible that channels cannot be coalesced into a shared chan-nel. Hence, the multi-channel model has different bandwidth utilizations and granularities of item replacement/switch as compared to the single-channel model. Explicitly, a channel switch involves a series of item demotions/promotions into the pull/push set [12][13] as opposed to one item switch in the single-channel model [2][6][15].
Notice that a hybrid data delivery should be adaptive to sustain trafÞc dynamics in multi-channel model. The lack of dynamic trafÞc awareness will make the broadcast contents reliable. However, many works in the data broadcast research were based on static workload and access patterns in a single-channel model. Although several techniques [5][6][15][17] are used to detect trafÞc changes, none is designed for the multi-channel model. The probing technique is Þrstly pro-posed, but has the scalability problem; the partial probing or sampling technique is used [15]. The feedback technique appends the access statistics into pull access requests with an extra feedback representation [6]. The statistic maximum likelihood estimation method is dedicated to estimate the static schedule [17]. The SDR technique estimates the dynamic access frequency distribution in a single-channel model [5].
In this paper, we propose an on-line multi-channel trafÞc awareness (MCTA) mechanism which exploits the nature of client impatience [10] to periodically estimate the dynamic access frequency distribution in multiple broadcast channels. Particularly, clients have limited patience, while accessing broadcast data items. A client will submit an impatient pull request when the waiting time exceeds its patience. With the measured impatient requests of each broadcast item in a broadcast cycle time, the server reßectively estimates the access frequency distribution among all items in the broadcast channels. Note that MCTA extends the original SDR [5] technique and can be elegantly applied to the push and the hybrid data delivery models without complicating the data broadcasting system. Further, we devise MCTA with all-inclusive trafÞc factors in order to provide a foundation for the adaptation of broadcast scheduling, indexing and the hybrid data delivery as compared to previous one which resolves a static optimization problem in a single-channel model. The
adaptive multiplexer pull queue data data broadcast program mobile clients uplink channel Database data data . . . push channels pull channels
Fig. 1. A hybrid data delivery in a multi-channel data broadcast model.
experimental results show that MCTA is of low complexity without performance degradation and is able to attain a highly accurate estimation of dynamic access frequency distribution. The rest of the paper is organized as follows. Section II describes the design of MCTA. Section III presents the experimental results. This paper concludes with Section VI.
II. MULTI-CHANNELTRAFFICAWARENESS(MCTA)
A. System Modeling and Notation
As depicted in Fig. 1, a wireless information server has a database D = {d1, d2, ..., dm} where items have the same size. Assume that it takes one time slot to broadcast each item, the use of time slot and data slot are interchangeable in this model. Let the request arrival rate λi(j) of each item diin a time unit tj form a Poisson process with an aggregate arrival rate λ = Pm
i=1λi(j) where λ1(j) ≥ . . . ≥ λm(j). All items in D are divided into a push item set Uh
= {d1, ..., dk} and a pull item set Uc
= {dk+1, ..., dm} according to their access frequencies (or the request arrival rates). Suppose the downward bandwidth consists of c channels of equal bandwidth. The server uses cpush channels to periodically broadcast items in Uh. Other cpullchannels carry items in Uc in the pull manner.
To maintain the generality, a ßat broadcast schedule is used in this study. Hot items in Uhare arranged into push channels without item duplication and dummy slots. A compound
broadcast program P =Scpush
x=1 Px= P1∪ . . . ∪ Pcpush is the
union of coordinative broadcast programs Pxs. SpeciÞcally, Px = {dx1, . . . dxi, . . . , dxL} presents the broadcast program in the x-th push channel. Thus, the time interval of a broadcast cycle L is equal to the number of slots in each Px. In addition, when a client wants to access an item dx
i, it will submit an impatient pull request for dx
i after the waiting time exceeds its patience w. The amount of impatient pull requests for dx i is denoted as γx
i in each broadcast cycle. Note that the model is similar to [12][13][15] with a graceful extension for the multi-channel data broadcast model.
B. Abstraction of MCTA TrafÞc Awareness
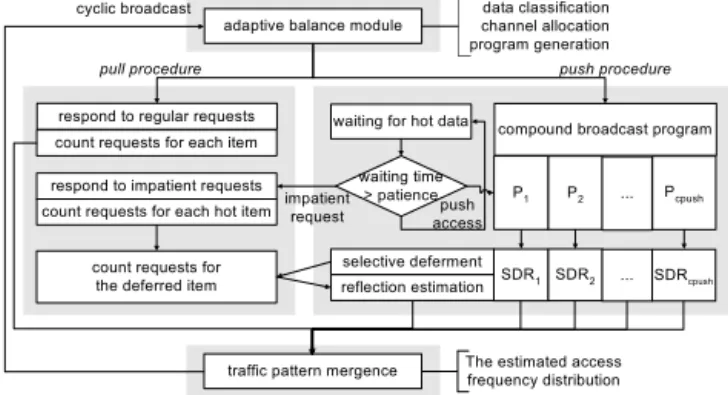
Fig. 2 depicts the basic ßowchart of MCTA which comprises two parts: the pull and the push procedures. The pull procedure responds to the pull requests for cold data, and the push procedure maintains a compound broadcast program. Since a client can submit an impatient pull request, the server has the exact number of regular pull requests for each cold item and
respond to regular requests
compound broadcast program adaptive balance module
traffic pattern mergence The estimated access frequency distribution
push procedure pull procedure
cyclic broadcast
respond to impatient requests
data classification channel allocation program generation
waiting time > patience waiting for hot data
impatient
request accesspush selective deferment reflection estimation count requests for each hot item
count requests for each item
count requests for the deferred item
P1 P2 Pcpush
SDR1 SDR2 SDRcpush ...
...
Fig. 2. The ßowchart of the MCTA mechanism.
the number of impatient requests for each hot item. The server deliberately makes a single-item broadcast miss by deferring the broadcast of a selected item for a cycle time. Meanwhile, the pull procedure can count the exact number of requests for this deferred item as a reßective base. Then, the reßection estimation can calculate the access frequencies of hot items according to the reßective base. Therefore, the server is aware of dynamic access frequencies of all broadcast items. C. Pull Access Calculation
During a cycle time, the server can calculate exactly the mean access frequency λi of each cold item di in Uc as
λi=X 1≤j≤L λi(j) L = λi L, k + 1 ≤ i ≤ m. (1)
Hence, the server can obtain the pull access frequency distri-bution, denoted as Φpull(x) =< λk+1, λk+2, ..., λm> . D. Push Access Estimation
The procedure has four phases: (1) client impatience mod-eling, (2) the selective deferment and reßective estimation, (3) estimation enhancement with the trigonometric tuning, and (4) the mergence of estimations on multiple push channels.
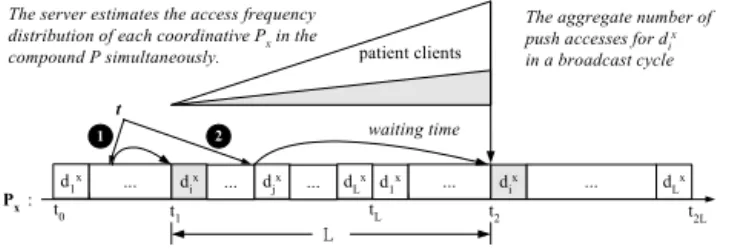
1) Client Impatience Modeling: Fig. 3 depicts two cases regarding a client’s push access on Px. Suppose a client with interest in dx
i arrives at the j-th slot. In the case (1), this client has to wait (i − 1) − j +1
2 slots where 1
2 is an average access delay in the j-th slot. In the case (2), the wait time is (L + i − 1) − j +1
2 slots since the client has to wait until its broadcast in the next cycle. Let a random variable x present a client’s patience in an exponential distribution with a mean patience ω. The probability density function of x is fγ(x) =
1 ωe−
1
ωx where 0 ≤ x < ∞. Accordingly, the probability that
a client will generate an impatient pull request for dx i is Fγ(i, j) = ½ 1 − e−1 ω(i−j−12), i > j, 1 − e−1 ω(L+i−j− 1 2), i ≤ j. (2) Let λx
i(j) be the access rate for dxi in the j-th slot. The server has the aggregate of impatient requests in a cycle time as γx
i =
P 1≤j≤Lλ
x
... t waiting time d1x dix ... djx ... dLx d1x ... dix ... dLx t0 tL t2L L 2 1 Px : patient clients
The aggregate number of push accesses for dix
in a broadcast cycle The server estimates the access frequency
distribution of each coordinative Px in the
compound P simultaneously.
t1 t2
Fig. 3. The push estimation procedure in a coordinative Px.
has an equal mean patience ω,P1≤j≤LFγ(i, j) is the same for each push item. We then have
γxi =X 1≤j≤Lλ x i · Fγ(i, j) = λ x i · (L − e− L2 2ω). (3) Since (L−e−L2
2ω) is constant, we have the ratio equation below.
γx1: ... : γxi : ... : γxk= λx1: ... : λxi : ... : λxk. (4) 2) Selective Deferment and Reßective Estimation: This phase estimates an access frequency distribution from (4). As depicted in Fig. 3, the server selects a single item dx
i in each Pxand intentionally defers its broadcast for a cycle time. The selective deferment can compel the clients to disclose their interests in dx
i. For those clients who are interested in dxi and arrive after t1, they will be satisÞed at t2, except some clients whose patience is less than the waiting time t2− t. In [t1, t2], the server will receive γx
i = P 1≤j≤Lλ x i(j)·Fγ(i, j) impatient requests for dx
i. In addition, those patient clients will submit regular pull requests for dx
i when they Þnd that dxi is absent at t2. Therefore, the server obtains the exact access frequency λx i by adding γx
i and the number of the regular pull requests for dx
i. Likewise, other impatient frequencies < γx1, γx2, ..., γxk > are available. With a reßective base λx
i in [t1, t2], it is able to estimate the access frequency of each push item from (4) as
λxj = γx j γx i · λxi L = γx j γx i · λ x i, 1 ≤ j ≤ k. (5)
Thus, the server can obtain the dynamic access
fre-quency distribution of each Px, denoted as Φx
push(x) = <γx1 γx i·λ x i, ..., γx i−1 γx i ·λ x i, λ x i , γx i+1 γx i ·λ x i, ..., γx k γx i·λ x i>.
3) Estimation Enhancement with Trigonometric Tuning: MCTA has the theoretical and quantitative analyses inherent in the SDR technique [5] as follows.
Theorem 1 Φx
push(x) with a reßective base dxi has at least a cross with Ψx
push(x) at Φxpush(i) = Ψxpush(i).
Theorem 2 With a reßective base dx
i whose λ x i/γxi is the smallest, we have λx i = Φxpush(i) / Ψ x
push(i) if λi is continuously increasing, or λx
i = Φxpush(i)' Ψxpush(i) if λi is continuously decreasing.
Property 1 Given a ßat Px scheduled in order of access
frequency, the item of the smallest λx
i/γxi is either ddL/2e or close to ddL/2e. Otherwise, the server can sort these items by their γx
is and take ddL/2e as the reßective base.
TABLE I
SIMULATION PARAMETERS DESCRIPTION
symbol meaning value
m the number of data items 1000, 10000
c the number of channels 10, 50, 100
b channel bandwidth 100, 500, 1000 KB
λ access rate 10 ~100
θ Zipf’s skew coefÞcient 0 ~2.0
µ channel service rate (b/s) variable
ω mean client patience 500, 1000, 10000
Accordingly, we further devise a tuning method based on the semi-monotonic feature of trigonometric functions to enhance
the estimation. Given a Px of L item slots, each slot is
mapped to an angle range of [0, π] in radians subsequently. For instance, the angle of dx
1 is 0, the angle of dxdL/2e is π2, and other dx
i has its angle δias i ·πL where 1 ≤ i ≤ L. Then, we have a tuned distribution Φx
∆(x) as
Φx∆(x) = cos2δx· Φ1x(x) + sin2δx· ΦxdL/2e(x), (6)
where cos2δx + sin2δx = 1. Because Φx
dL/2e(x) crosses Ψx
push(x) at ddL/2e, we apply sine function to ΦxdL/2e(x). Likewise, we apply cosine function to Φx
1(x) which crosses Ψx
push(x) at d1. Hence, we can tune the estimation in the range between Φx
1(x) and ΦxdL/2e(x) with two cross points at the point δx = π2 where Φx
∆( L 2) = Φ x dL/2e( L 2) = Ψ x push( L 2) and at the point δx= 0 with Φx
∆(1) = Φx1(1).
4) Mergence of Multiple-Channel Estimations: In a divide-and-consquer strategy, the task of estimating λx
is of all push items is recursively divided into cpushsmaller tasks which are solved simultaneously. The conquering phase integrates the answers. As Φ1
push(x), ..., Φ cpush
push(x) are obtained, the push mergence performs a recursive merge-sort and achieves an overall Φpush(x). Moreover, with two sorted lists, Φpull(x) and Φpush(x), a classical merge-sort algorithm is used to generate a sorted, overall access frequency distribution Φ(x).
III. EXPERIMENTS ANDRESULTS
A. Simulation Environment
Given a workload λ =P1≤i≤mλi, each item has a distinct access frequency λi = λ · qi in light of the Zipf distribution qi = (1i)θ/P
1≤i≤m( 1 i)
θ [18]. The distribution is skewed gradually as the skew coefÞcient θ increases, but becomes uniform as θ = 0. To simplify demonstration, we take the same reßective base in multiple Pxs. Three candidates for the reßective base: the Þrst item (dF I), the middle item (dM I), and the last item (dLI) in Px, are inspected. Thus, ΦF I(x), ΦM I(x), ΦLI(x) and Φ∆(x) are compared with Ψ(x) in terms of accuracy difference between the estimated and the accurate access frequencies of an item di where di∈ D. Table I lists the simulation parameter description.
B. MCTA Performance Evaluation
This subsection Þrst inspects ΦF I(x), ΦM I(x), ΦLI(x) and Φ∆(x) under dynamic workload and access pattern. In addition, we examine the respective sensitivities of MCTA to dynamic workload, access pattern, and channel number.
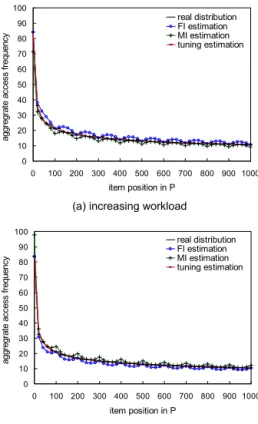
1) Estimation under Dynamic Workload: As depicted in Fig. 4, Φx
F I(x) and ΦxM I(x) are “wavelike.” The concatenation
of Φx(x)s results in Φ(x). Observe that Ψ(x) is bounded
by ΦF I(x) and ΦM I(x). In Fig. 4(a), when the workload increases, Φx
F I(x) is slightly above Ψ(x), but ΦxM I(x) is below Ψ(x). However, the positions of Φx
F I(x) and ΦxM I(x) are reverse under the decreasing workload. Φx
F I(x) is convex with a peak at dM I as the workload increases; comparatively, Φx
F I(x) is concave, and dM I becomes a foot as workload
decreases. In contrast, Φx
M I(x) is a mirror rendering corre-sponding to Φx
F I(x) below Ψ(x). Finally, it is promiment that Φx
∆(x) is very close to Ψ(x).
The above phenomena are explained as follows. Depending on the reßective base in (5), the larger the value of γx
j/γxi, the larger the value of λx
j is. Because dxLI is just the item ahead of dx
F Icyclically, dxF I and dxLIface the same situation. The situation is symmetric with dx
M I as the symmetric point. If an item is scheduled earlier within the Þrst half of Px, the rate of its push access to impatient requests can be more than those of other items scheduled lately. Hence, the estimated λx j of dx
j can be higher than the real value when dxF I, the item of the largest λx
i/γxi, serves as the reßective base. Likewise, using dx
M I whose λ
x
i/γxi is the smallest as the reßective base can cause Φx
M I(x) to be lower than Ψ(x). In the case of a decreasing workload, Φx
F I(x) and ΦxM I(x) in Fig. 4(b) are the inverted reßections of the corresponding curves in Fig. 4(a). The reason is that the rate of λL
F I to γLF I is the smallest in a cycle, and thus the estimated access frequency for another item is lower than its real value.
2) Estimation under Dynamic Skew Access Pattern: There are several observation below. First, as depicted in Fig. 5(a), a hybrid data delivery model is proÞtable in the case of a higher skew pattern. Using parts of channels to broadcast fewer items of relatively high access frequency can reduce the mean access time. Oppositely, as shown in Fig. 5(b), a pure push delivery is beneÞcial under a less skew access pattern. Second, MCTA has high accuracy except when an item of a drastic change of access frequency is selected as the reßective base. In the context where item access frequencies change drastically, it is suggested that dM Iis a more suitable to avoid the performance degradation. Third, the effect of the trigonometric method is prominent. Φ∆(x) is relatively closer to Ψ(x) than ΦF I(x) and ΦM I(x) are. Consequently, MCTA with the trigonometric tuning method is able to attain very high accuracy.
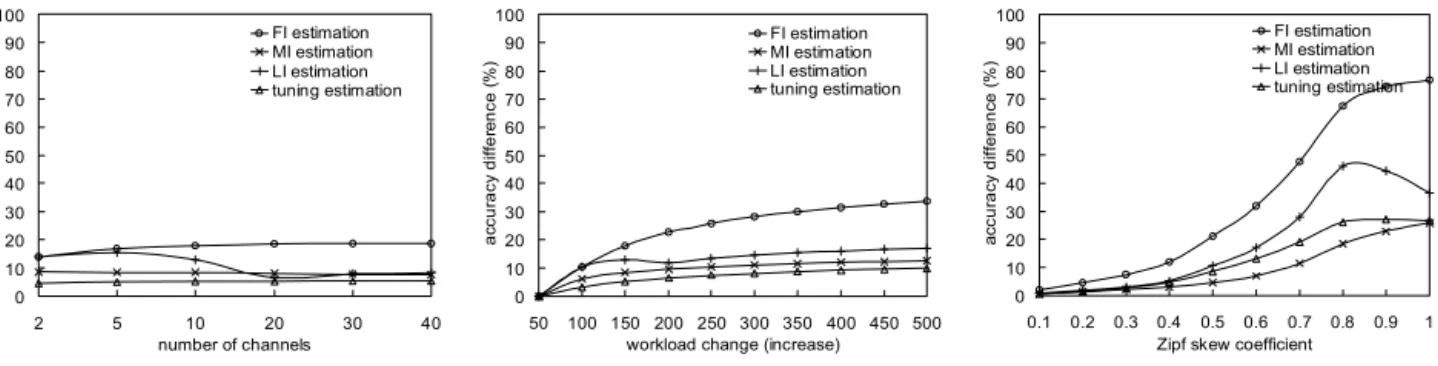
3) Sensitivity to Channel Number Variation: As shown in Fig. 6(a), the curves of ΦF I(x), ΦM I(x) and Φ∆(x) go up slightly corresponding to the increase of channel number in the x-axis. However, we Þnd that the standard deviations of accuracy difference go down. For example, the difference percents of Φ∆(x) are 4.57%, 4.98%, 5.14%, 5.22%, 5.28%, 5.32%, but their respective deviations are 3.06, 0.70, 0.38, 0.18, 0.12, 0.09. It is because the gradient of item classiÞcation is coarse in case of fewer channels and can be reÞned with more channels. MCTA can attain a higher accuracy in a small Px because the access frequencies of these items are close. Though the fast increase of workload can cause some items having drastic changes of access frequencies, the low accuracy difference as depicted in Fig. 6(a) presents the robustness of
0 10 20 30 40 50 60 70 80 90 100 0 100 200 300 400 500 600 700 800 900 1000 item position in P ag gr egr at e a cc es s f reque nc y real distribution FI estimation MI estimation tuning estimation
(a) increasing workload
0 10 20 30 40 50 60 70 80 90 100 0 100 200 300 400 500 600 700 800 900 1000 item position in P agg re gr at e ac ces s fr eq ue nc y real distribution FI estimation MI estimation tuning estimation (b) decreasing workload
Fig. 4. MCTA under dynamic workload (baseline: m = 1000, w = 500, c = 10, θ = 0.3, λ = 100 ↔ 200). 1 10 100 1000 0 100 200 300 400 500 600 700 800 900 1000 item position in P ag gr eg rat e ac ce ss fr equenc y real distribution FI estimation MI estimation tuning estimation
(a) increasing skew access pattern
1 10 100 1000 0 100 200 300 400 500 600 700 800 900 1000 item position in P ag gr eg rat e ac ces s fr equenc y real distribution FI estimation MI estimation tuning estimation
(b) decreasing skew access pattern
Fig. 5. MCTA under dynamic access pattern (baseline: m = 1000, w = 500, c = 10, λ = 100, θ = 0.3 ↔ 0.6).
0 10 20 30 40 50 60 70 80 90 100 2 5 10 20 30 40 number of channels a cc u ra cy d iff e re n ce ( % ) FI estimation MI estimation LI estimation tuning estimation 0 10 20 30 40 50 60 70 80 90 100 50 100 150 200 250 300 350 400 450 500 workload change (increase)
a cc u ra cy d iff e re n ce ( % ) FI estimation MI estimation LI estimation tuning estimation 0 10 20 30 40 50 60 70 80 90 100 0.1 0.2 0.3 0.4 0.5 0.6 0.7 0.8 0.9 1 Zipf skew coefficient
a cc u ra cy d iff e re n ce ( % ) FI estimation MI estimation LI estimation tuning estimation
Fig. 6. Sensitivity of MCTA to trafÞc factors: (a) m = 1000, c · µ = 100, θ = 0.5, λ = 50 ↔ 150, (b) m = 1000, c · µ = 100, θ = 0.5, λ = 50 ↔ 500, and (c) m = 1000, c · µ = 100, λ = 150, θ = 0 ↔ 1.0.
MCTA to the variance of channel number.
4) Sensitivity to Workload Variation: Fig. 6(b) depicts the scalable performance of MCTA. The accuracy difference increases slowly corresponding to the incremental workload change labeled in the x-axis. We observe that an increasing difference ascribes to the drastic change of workload in few Pxs which contain relatively hotter items. Selecting a reßective base with a drastic change of access frequency will increase the accuracy difference. It is noteworthy that the accuracy reduction is conÞned to a few Pxs. Hence, MCTA is still robust with a reliable reßective base, i.e., dM I. Particularly, under a drastic workload change as λ = 50 → 500, Φ∆(x) is about 91%, and ΦM I(x) is about 88%. This experimental results in essence conform to the general agreement that data broadcast is beneÞcial to the scalability problem.
5) Sensitivity to Access Pattern Variation: As depicted in Fig. 6(c), the less drastic the access pattern changes, the higher accuracy MCTA has. It is interesting to Þnd that ΦM I(x) is closer to Ψ(x) than others when θ varies from 0 to a higher value. Explicitly, the items near the head and the rare of each Px such as dF I or dLI can have higher variations in access frequency. Thus, ΦF I(x) affects poorly the performance of the trigonometric tune. Comparatively, dM I is less susceptible in this context where the access pattern has a drastic change. In addition, the curves go up smoothly or downward, especially while the access pattern becomes very skewed (θ from 0 to ≥ 0.8). As measured, most workload focuses on a few items of very high access frequencies. The estimated frequencies of these items account for most of accuracy difference. Oppo-sitely, other items have lower estimation difference.
IV. CONCLUSIONS
The recent multi-channel data dissemination model has attracted many researchers’ studies. In this paper, we have proposed an on-line multi-channel trafÞc awareness (MCTA) in response to the dynamic trafÞc changes in the multi-channel data dissemination environment. MCTA is able to periodically estimate the dynamic access frequencies of all items disseminated in the push channels. Extensive simulations have shown that the estimated access frequency distribution has a low inaccuracy as compared to the real one, consequently presenting the feasibility and robustness of MCTA.
ACKNOWLEDGEMENT
The authors are supported in part by the Ministry of Edu-cation Project No. 89-E -FA06-2-4, and the National Science Council Project No. NSC 2213-E-002-001 and NSC 92-2213-E-002-010, Taiwan, Republic of China.
REFERENCES
[1] S. Acharya, et al. Broadcast disks: Data management for asymmetric communications environments. In Proceedings of ACM SIGMOD’95, pages 199–210, May 1995.
[2] S. Acharya, et al. Balancing push and pull for data broadcast. In
Proceedings of ACM SIGMOD’97, May 1997.
[3] M. H. Ammar and J. W. Wong. On the optimality of cyclic transmission in teletext systems. IEEE Transactions on Comunications,
COM-35(11):1159–1170, 1987.
[4] C.-L. Hu and M.-S. Chen. Adaptive balanced hybrid data delivery for multi-channel data broadcast. In Proceedings of IEEE ICC’02, April 2002.
[5] C.-L. Hu and M.-S. Chen. Dynamic data broadcasting with trafÞc awareness. In Proceedings of IEEE ICDCS’02, 2002.
[6] Q. Hu, D. L. Lee, and W.-C. Lee. Dynamic data delivery in wireless communication environments. In Proceedings of ER’98 Workshops on
Mobile Data Access, volume 1552 of LNCS. Springer, 1998.
[7] J.-L. Huang, W.-C. Peng, and M.-S. Chen. Binary interpolation search for solution mapping on broadcast and on-demand channels in a mobile computing environment. In Proceedings of ACM CIKM’01, 2001. [8] T. Imielinski, S. Viswanathan, and B. R. Badrinath. Energy efÞcient
indexing on air. In Proceedings of ACM SIGMOD’94, 1994. [9] T. Imielinski, S. Viswanathan, and B. R. Badrinath. Data on air:
Organization and access. IEEE TKDE, 9(3):353–372, May/June 1997. [10] S. Jiang and N. H. Vaidya. Scheduling data broadcast to "impatient"
users. In Proceedings of ACM MobiDE’99, pages 52–59, August 1999. [11] R. Kravets and P. Krishnan. Power management techniques for mobile communication. In Proceedings of ACM MOBICOM’98, October 1998. [12] W.-C. Lee, Q. Hu, and D. L. Lee. A study on channel allocation for data dissemination in mobile computing environments. ACM/Baltzer
MONET, 4(2):117–129, 1999.
[13] W.-C. Peng and M.-S. Chen. Dynamic generation of data broadcasting programs for a broadcast disk array in a mobile computing environment. In Proceedings of ACM CIKM-2000, November 2000.
[14] K. Prabhakara, K. A. Hua, and J. Oh. Multi-level multi-channel air cache designs for broadcasting in a mobile environment. In Proceedings
of IEEE ICDE-2000, pages 167–176, February 2000.
[15] K. Stathatos, et al. Adaptive data broadcast in hybrid networks. In
Proceedings of VLDB’97, pages 326–335, 1997.
[16] C.-J. Su, et al. Broadcast scheduling for information distribution.
ACM/Baltzer Wireless Networks, 5(2):137–147, 1999.
[17] J. X. Yu, T. Sakata, and K.-L. Tan. Statistical estimation of access frequencies in data broadcasting environments. ACM/Baltzer Wireless
Networks, 22(6):89–98, 2000.
[18] G. K. Zipf. Human Behaviour and the Principle of Least Effort.