行政院國家科學委員會專題研究計畫 成果報告
老年住院病患營養狀況及其影響之追蹤研究
計畫類別: 個別型計畫 計畫編號: NSC93-2314-B-002-293- 執行期間: 93 年 08 月 01 日至 94 年 07 月 31 日 執行單位: 國立臺灣大學醫學院護理學系暨研究所 計畫主持人: 陳佳慧 報告類型: 精簡報告 報告附件: 出席國際會議研究心得報告及發表論文 處理方式: 本計畫可公開查詢中 華 民 國 94 年 10 月 28 日
老年住院病患營養狀況及其影響之追蹤研究 台灣大學護理系陳佳慧 國科會計畫編號: NSC93-2314-B-002-293 良好的營養狀況可以提高住院老年病患的免疫力,加速傷口癒合,避免併發症, 減少醫療支出,甚至提升日後之生活品質。根據衛生署近年來公布的台灣地區十大死 因可看出,許多死因與不良的飲食習慣及營養狀況有很大的關係,顯示營養狀況在維 持身體健康及疾病防治方面扮演十分重要的角色。國外的研究亦顯示有高達百分之六 十的老年住院病患有營養不良的相關徵象。美國政府研究指出營養不良的老年住院病 患住院日數百分之百延長,每人每次住院醫療支出增加高達$2,000 美元到 10,000 美 元。因此,老年住院病患的營養狀況已是其醫療資源使用多寡的重大指標之一。 目前國內尚無具體老年住院病患營養狀況評估的追蹤研究,而伴隨老化而來的生 理變化及老年病患常見的多重病因,又常造成營養狀況評估困難度大幅增加。因此本 研究以集束取樣方式,在北部一家大型醫學中心抽選出五處內外科成人病房,其單位 內所有 65 歲(含)以上老年住院病患、簡短智能評估達 20 分者全數收案。一年期間 已收案 117 人。每人進行四次評估:住院 48 小時內、出院前、出院後三個月及出院後 六個月。初步分析結果顯示,入院時營養狀況不良的盛行率介於 12.21%~70.42% (平均 營養評估分數 MNA=21.40±3.67) ,出院時情形更形惡化(平均 MNA 降至 18.12±4.51; 有 80 人呈現惡化),出院 3 至 6 個月時營養狀況則緩步上升(平均為 21.14±4.07 和 21.40±3.67;但仍有 30-53 位個案持續下降),營養狀況的相關危險因子包含憂鬱症 狀、口腔健康、身體活動功能、聽力障礙、患病數和藥物服用總數等。 如此初步分析結果顯示住院期間大多數老年病患的營養狀況呈現惡化的跡象,出 院時到達最低潮,亦有部份個案在出院後持續下降。更多深入的研究需要去探討住院 老年病患之營養狀況、相關危險因子、及出院後的健康復原情形,以作為日後改善住 院老年病患之營養狀況,促進健康復原之參考。
A Prospective Study of Nutritional Status in Older Hospitalized Patients
Cheryl Chia-Hui Chen, National Taiwan University School of Nursing Grant #: NSC93-2314-B-002-293
Ensuring adequate nutritional status for older hospitalized patients has been shown to reduce health care costs and enhance quality of life. Studies, however, have found that malnutrition is present in 20-60% of older hospitalized patients, depending on the definition used and the population studied. The purpose of this 1-year prospective study was to evaluate nutritional status (48 hours within admission, at discharge, 3 month post index hospitalization, and 6 months after index hospitalization), its predicting factors, and its clinical impact on older hospitalized patients, using the framework, which was first proposed by Chen et al., (2001) as a theoretical guidance.
A cluster sampling was employed to select five medical and surgical units as data collection sites in a tertiary medical center located at Northern Taiwan. Every subject aged 65 years and older who met the inclusion criteria was approached by the trained research nurses Upon obtaining consent, face-to-face interviews and assessments were conducted by
standardized measures and protocols across four data collection points (n=117). Subjects with severe cognitive impairment were excluded, since the study design involves use of self-reported questions. Scoring less than 20 in the Chinese Mini-Mental State Exam (CMMSE) met this exclusion criterion.
Data were analyzed by the SAS statistical package version 8. Due to the exploratory nature of the study, test statistics significant at p.05 were reported. Descriptive and multiple linear regressions were performed to answer these raised questions. Analyses were performed across four single time points. The preliminary analyses indicated that 13 subjects (11.21%) scored less than 17 and were classified as malnourished, and 64 subjects (55.17%) scored 17 to 23.5 and were at risk of malnutrition; the remaining 39 (33.62%) were considered well-nourished, when admitting to the hospital. Nutritional decline was common, occurring in 80 subjects (68.38%) from admission to discharge, 30 subjects (27.52%) from discharge to 3 month post discharge, and 53 subjects (50.48%) from 3 to 6 months post discharge. The predictors of nutritional status included depressive symptoms, oral health, functional status, number of medications, and hearing impairment. These preliminary results mandate
heightened attention to these prevalent geriatric issues, namely depressive symptoms,
compromised functional status, oral health problems, hearing impairment, polypharmacy and their impact on nutrition and related disability. Studies are needed to further test the
Background and Significance
Malnutrition is a frequent and serious problem in older hospitalized patients (Institute of Medicine, 2000). Studies have shown that malnutrition is present in 2-51% of community-dwelling older adults, 20-60% of older hospitalized patients, and up to 85% of nursing home older residents (Guigoz, Lauque, & Vellas, 2002; Mion, McDowell, & Heaney, 1994). Numerous studies have shown that most markers of nutritional status deteriorate steadily during the hospitalization and this significantly affects clinical outcomes (Sullivan, Sun, & Walls, 1999). Unfortunately, malnutrition in the older hospitalized patients is often
unrecognized and untreated (Morley, 1991). A variety of age-related changes and multiple chronic illnesses interferes with the maintenance of proper nutritional status. Many
physiological and psychosocial changes accompanying aging further make malnutrition in older hospitalized patients more complicated and difficult to recognized (Chen, Schilling, & Lyder, 2001).
Malnourished older patients often receive no attention in their nutritional status during the hospitalization, subsequently develop a cycle of progressive clinical deterioration, and this cycle appears to be a rapid and hard-to-reverse process (Abbasi, Basu, & Rudman, 1992). Previous experimental studies have shown that advanced malnutrition is much more difficult to correct in older patients than in younger populations (Fiatarone, et al., 1994). Accordingly, prevention and early detection of malnutrition has become one of the emerging public health concerns for older hospitalized patients.
The specific aims of the study are two-fold. The primary aim is to describe the nutritional status of older hospitalized patients longitudinally; 48 hours within admission, at index discharge, 3 months post index hospitalization, and 6 months after index hospitalization. The secondary aim is to evaluate the impact of selected factors (e.g. chronic illness,
social support and depressive symptoms, and functional status) in predicting nutritional status across the four time points.
Study Method
A hospital-based nutritional survey was conducted. Data were collected by one trained research nurse who used structured instruments to obtain information and measures on
demographics, visual/hearing impairments, oral health, cognitive status, comorbidities, medication use, functional status, social support, depressive symptoms, and nutritional status. All subjects were interviewed 48 hours within the admission, before index discharge, 3 and 6 months post index hospitalization (n=117). Interview consists of 1) demographics; 2)
descriptive data; 3) predictor scales; and 4) anthropometric measures including weight, knee height, and mid-arm and calf circumference. Subjects also underwent a brief oral health examination involving counting the remaining teeth and assessing the fitness of denture. Reliability and validity of data were maintained by standardized protocols and training of research staffs. The psychometric properties of measures were briefly described as the following:
Demographics & sensory impairment data
A demographic form was designed to collect the data including age, gender, marital status, living status, income, education, occupation, and ethnic group. Additionally, sensory impairments were assessed by the self-report of visual and hearing impairments. Subjects who demonstrated with hearing or visual difficulties during the data collection were automatically coded as having hearing or visual impairments.
Oral health
A 12-item Chinese version of General Oral Health Assessment Index (GOHAI) was used to assess oral health. The GOHAI is designed to assess the dimensions of oral function (eating and speaking), pain, discomfort, worry, and oral health related social functioning
(Atchison & Dolan 1990). Reliability estimates(Cronbach’salpha= .83-.79; inter-rater reliability=.61) and established content, discriminant and construct validity have been reported (Calabrese et al. 1999, Wong et al. 2002). The sum scores ranged from 12 to 60 with a higher score indicative of better perceived oral health. Information on number of remaining teeth, dental status (full denture, bridge, partial denture, or natural teeth), fitness of denture, and dental care utilization (regular dental check-up or not) were also obtained.
Cognitive status
The 30-item Chinese Mini-Mental State Examination (MMSE) was used to measure cognitive status. The MMSE is the most widely used cognitive assessment tool in Taiwan. The final score is the sum of the scores from 30 items and it ranged from 0-30 (Folstein et al. 1975). Satisfactory test-retest (r=.89-.93), inter-rater reliability (r=.83), and content and discriminant validity have been reported (Guo et al. 1988).
Comorbidities
The history and number of comorbidities was elicited from the medical record. A standardized comorbidity checklist was used to assess common chronic illnesses including myocardial infarction, angina, congestive heart failure, hypertension, diabetes,
hyperlipidemia, arthritis, stroke, asthma or lung disease, renal disease, Parkinson’sdisease, osteoporosis, hip fracture, pressure sore, cancer, and others.
Medication use
Using a standardized protocol, medication review was conducted by the trained research nurse with the data from medical record and self-report information from patients. The number and type of prescription and over-the-counter medications taken currently by subjects was documented.
Functional status
status. Satisfactory reliability (Cronbach’s=.87-.91; Kappa=.70-.88) and validity have been reported for the BI (Sainsbury et al. 2005, Dai et al. 1999). The BI comprises ten activities of daily living (ADL) with the sum scores range from 0 to 100 and higher score indicating better functional status (Mahoney & Barthel 1965).
Social support
The 6-item Chinese Social Support Questionnaire-Short Form (SSQ-SF) was used to measure social support. In 6 common situations, subjects were asked to list up to nine people who can counted on (number score) and specify overall degree of satisfaction (satisfaction score). The tool has been used with the elderly population: the coefficientranged from .90-.93 and established construct and content validity have been reported (Sarason et al. 1987). The Cronbach alpha of Chinese SSQ-SF was .85 in the present study.
Depressive symptoms
The 15-item Chinese version of Geriatric Depression Scale Short-Form (GDS-15) was used to measure the presence of depressive symptoms. The Institute of Medicine has
recommended GDS for clinical use. The 95% confidence intervals for sensitivity and specificity of the long-form GDS (GDS-30) are 84% to 93% (Yesavage et al. 1983). The GDS-15 has a cut-off point of 6 and high correlation with the long-form GDS (Gerety et al. 1994, Wong et al. 2002).
Nutritional status
The 18-item Chinese version of Mini-Nutritional Assessment was used to measure nutritional status, given its inclusion of all five proposed critical attributes among the items. The summed score could be used either as a categorical or interval variable. The score can categorize elderly as: 1) > =24, well-nourished; 2) 23.5-17, at risk; and 3) <17, malnourished. The 96% sensitivity, 98% specificity, and satisfactory inter-rater reliability (Kappa
weight loss per unit of time and serum albumin and cholesterol levels were also collected. Body mass index was calculated with measured height and weight in close to 0.1 cm or kg.
Sample
A hospital sample was recruited. The study sample composed 117 elderly patients aged 65 years and above who consecutively admitted to 5 medical-surgical units of a tertiary medical center in Taipei, Taiwan during July, 2004 to August, 2005. The study protocol was approved by the Research Ethics Review Committee at National Taiwan University Hospital. Every elderly patient admitted to these five units was invited to participate. The units were selected by a random process, proportionally picking 3 units from surgical units and two from medical units from the total of 20 medical-surgical units at the studied hospital.
Data analysis
Data were analyzed using SAS, version 8.0 (SAS Institute, Inc., Cary, NC). Data were reviewed and double entered to assure accuracy. Within the context of proposed framework, the factors associated with MNA scores at P<.15 were then considered in multivariate modeling. Since many factors could be used as either a continuous or categorical variable, care was given to use continuous variables whenever possible to avoid losing information. Linear regression was applied, guided by the theoretical framework proposed by Chen et al. (2001), to examine effects of each predictor on the MNA scores. Backward elimination was chosen due to its advantage over the forward and stepwise selections. Traditionally, forward and stepwise selections were unable to detect the possibility that a set of variables had considerable predictive capability even though any single one of them does not. In other words, the backward elimination somehow provided a fair chance for all predictors,
individually or jointly and that is why backward selection was chosen to apply. Significance was set at P < .05.
Results/findings
The preliminary finding indicated that sample was relative diverse with female composed 41.03% (n=48) of subjects. Great majority of sample were living with others (97.44%; n=114), a quarter (24.79%, n=29) were widow, and of diverse education, income, and ethnic backgrounds. Ages ranged from 65 to 89 years with a mean of 72.69 years and standard deviation (SD) of 5.37 years. The detailed demographics of sample are shown in table 1.
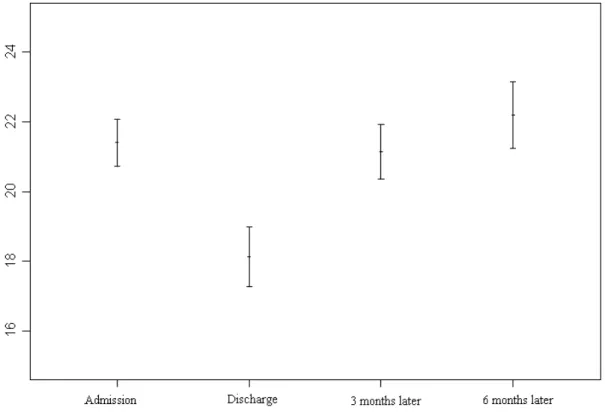
As to the nutritional status, the BMI ranged from 13.93 to 41.56 kg/m2with a mean of 23.40 and SD of 4.03. Using the criteria recommended by the Department of Health in Taiwan (2002), 6 subjects (5.13%) had a BMI <18.5 kg/m2and therefore were classified as underweight. Conversely, 43 subjects (36.75%) having BMI>24 kg/m2were considered overweight. In terms of MNA scores, 13 subjects (11.21%) scored less than 17 and were classified as malnourished, and 64 subjects (55.17%) scored 17 to 23.5 and were at risk of malnutrition; the remaining 39 (33.62%) were considered well-nourished. Nutritional decline was common, occurring in 80 subjects (68.38%) from admission to discharge, 30 subjects (27.52%) from discharge to 3 month post discharge, and 53 subjects (50.48%) from 3 to 6 months post discharge. Figure 1 shows the trend of MNA scores across 4 time points.
Prior to multivariate analyses, data was assessed for congruence with regression assumption. Multivariate normality and homoscedasticity was evaluated by residual
scatterplots. The residuals were distributed quite evenly, with a concentration of values along a straight line in the center. As to the concern for multicollinearity, variables were removed from the regression model if less desirable tolerance was indicated. The proposed framework was then used to guide the linear regression analysis with MNA scores as the dependent variable. As shown in Figure 2, the variables being entered were age in year, education levels, income levels, visual/hearing impairments, number of morbidities, number of medication,
scores of GOHAI, MMSE, Barthel index, SSQ-SF, and GDS-15. The final model statistics across four time points were presented in table 2. Detail analysis is underway to examine the dynamic of decline as well as to generate risk adjustment prediction model.
Discussion
These preliminary results mandate heightened attention to these prevalent geriatric issues, namely depressive symptoms, compromised functional status, oral health problems, hearing impairment, polypharmacy and their impact on nutrition and related disability. Prior studies utilizing the specialized geriatric units or geriatric consultation services have
demonstrated promising effects in improving health status of older patients during their
hospitalization (Thomas 2002). Many nursing interventions including feeding assistance, visual and hearing adaptation, mobilizing plan for patients, daily visit/orientation protocol, and
making environmental modifications have been the essential components of these successes (Inouye et al. 2000, Wanich et al. 1992). Studies are warranted to test the effectiveness of these hospital-based interventions in improving nutritional status and related outcomes in the
hospitalized elderly. In agreement with the present study, these findings emphasize the importance of timely recognition of high risk elderly patients who seem to be on the edge of failing into the cascade of illness and frailty.
There are no clinical guidelines available in Taiwan, as there is poor agreement on how to measure, interpret and what or when to intervene with nutritional problems of older patients. By conducting a comprehensive nutritional assessment in a representative sample, taking previous methods with inconclusive results, and bringing them together under the context of a theoretical framework, evidence-based practices and theory driven guidelines can be sought and hospital-based interventions can be planned accordingly.
Table 1. Sample Demographic Characteristics (N=117)
No. %
Age Group
65 to 74 years 72 61.54%
75 to 84 years 43 36.75%
85 years and above 2 1.71%
Gender Male 69 58.97% Female 48 41.03% Ethnicity Taiwanese 87 74.36% Hakka 8 6.84% Mainlander 21 17.95% Native Taiwanese 1 0.85% Married Status Widowed 29 24.79% Married 87 74.36% Single/Divorced 1 0.85% Education Illiterate 34 29.06% 6 or less years 38 32.48% 6-9 years 11 9.40% 9-12 years 9 7.69% 13 years or more 25 21.37% Living Arrangement Alone 3 2.56% With others 114 97.44% Monthly Income Less than 5,000 14 11.97% 5,001-10,000 74 63.25% 10,001-20,000 18 15.38% 20,001 and above 10 8.55%
prefer not to answer 1 0.85%
Religion Buddhist 61 52.14% Daoist 15 12.82% Catholic 2 1.71% Protestant 7 5.98% Other 32 27.35%
Figure 2. Changes and Trend of Nutritional status across four time points (Χ axial =MNA scores and Y axial =time points;
GOHAI=Geriatric oral health assessment index, MMSE=Mini-mental state examination, SSQ-SF=Social support questionnaire-short form, GDS-15=Geriatric depression scale-15
Figure 1. Conceptual-Theoretical-Empirical Structure Framework of Nutritional Status in Older Hospitalized Patients.
Table 2. Model Statistics-Predictors of MNA Score using backward elimination
48 hours within admission (n=117)
Coefficients Model B Std. Error t Values p Constant 20.890 2.502 69.74 <.0001 Depressive Symptoms .513 .008 39.40 <.0001 Loss Chronic illness Dependency Loneliness Malnutrition In the elderly
Loss of optimal body composition
Loss of sensory function
Loss of oral health
Loss of role function
Comorbidities Polypharmacy Financial dependency Functional dependency Social support Depression
Insufficient dietary intake Muscle wasting Weight loss Poor appetite Downward trajectory
Age as proxy
Visual / hearing impairment
Oral health Cognitive status Age in year Presence of impairment GOHAI / # of teeth MMSE
# of co-morbidities Co-morbidity list
# of medication Med count
SES Income /edu / gender
Functional status Barthel index / ADLs
Availability of support satisfaction support SSQ-SF Depressive Symptoms GDS-15 Nutritional status Mini-Nutritional Assessment (MNA) % of weight loss
Oral health Status -.101 .042 6.56 .0118
# of morbidities -.290 .145 3.99 .0482
Hearing impair -1.67 .906 3.31 .0717
R2/Adjusted R2 .42/.36
48 hours within discharge (n=109)
Coefficients Model B Std. Error t Values p Constant 3.00 6.181 0.24 .6284 Depressive Symptoms -.57 .090 40.10 <.0001
Oral health Status .076 .050 2.33 .01304
Functional Status .078 .022 12.80 .0005
Hearing impair -2.11 .979 4.65 .0334
Age in year .143 .064 5.04 .0270
R2/Adjusted R2 .51/.46
3 months post index discharge (n=107) Coefficients Model B Std. Error t Values p Constant 7.400 3.445 4.61 .00342 Depressive Symptoms -.347 .089 15.31 .0002
Oral health Status .146 .049 9.00 .0003
Functional Status .091 .026 11.88 .0008
R2/Adjusted R2 .58/.53
48 hours within discharge (n=105)
Coefficients Model B Std. Error t Values p Constant 7.148 3.766 3.60 .0606 Depressive Symptoms -.400 .090 20.10 <.0001
Oral health Status .090 .056 2.40 .1248
Functional Status .164 .028 35.02 <.0001
# of medication -.463 .155 8.95 .0035
Selected Reference
Atchison K.A. & Dolan T.A. (1990) Development of the geriatric oral health assessment index. Journal of Dental Education 54, 680-687.
Chen C.C-H., Schilling L. & Lyder C. (2001) A concept analysis of malnutrition in the elderly. Journal of Advanced Nursing 36 131-142.
Folstein M.F., Folstein S.E. & McHugh P.R. (1975) "Mini-mental state" A practical method for grading the cognitive state of patients for the clinician. Journal of Psychiatric
Research 12(3),189-198.
Guigoz Y., Lauque S. & Vellas B.J. (2002) Identifying the elderly at risk for
malnutrition: The mini-nutritional assessment. Clinics in Geriatric Medicine 18, 737-757.
Guigoz Y., Vellas B. & Garry P.J. (1996) Assessing the nutritional status of the elderly:
The mini nutritional assessment as part of the geriatric evaluation. Nutrition Review 54, S59-S65.
Institute of Medicine (2000) Theroleofnutrition in maintaining health in thenation’s
elderly. Washington, D.C.: National Academia Press.
Sarason I., Sarason B., Shearin E. et al. (1987). A brief measure of social support: practical and theoretical implications. Journal of Social and Personal Relationships 4, 497-510. Sullivan D.H., Sun S. & Walls R.C. (1999) Protein-energy undernutrition among
elderly hospitalized patients: A prospective study. Journal of American Medical
Association 281, 2013-2019.
Wong M.C., Liu J.K. & Lo E.C. (2002) Translation and validation of the Chinese version of GOHAI. Journal of Public Health Dentistry 62(2), 78-83.
Yesavage J.A., Brink T.L. & Rose T.L. (1983) Development and validation of a geriatric depression scale. Journal of Psychiatric Research 17, 31-49.