國 立 交 通 大 學
光 電 工 程 研 究 所
博士論文
超高速 60GHz 光載微波無線訊號系統
Extremely High-Capacity 60 GHz
Radio-over-Fiber Systems
研
究
生 : 江 文 智
指 導 教 授
: 陳 智 弘 博士
: 林 俊 廷 博士
中 華 民 國 一 零 一 年 七 月
超高速 60GHz 光載微波無線訊號系統
Extremely High-Capacity 60 GHz
Radio-over-Fiber Systems
研 究 生 :江文智 Student : Wen-Jr Jiang
指導教授 :陳智弘 博士 Advisor : Dr. Jyehong Chen
:林俊廷 博士 : Dr. Chun-Ting Lin
國 立 交 通 大 學
光 電 工 程 研 究 所
博 士 論 文
A Dissertation
Submitted in Partial Fulfillment of the Requirements For the Degree of PhD in
Department of Photonics
College of Electrical and Computer Engineering National Chiao-Tung University
HsinChu, Taiwan 300, R.O.C.
Extremely High-capacity 60 GHz Radio-over-Fiber Systems
Student: Wen-Jr Jiang Advisor: Dr. Jyehong Chen
Dr. Chun-Ting Lin
Department of Photonics National Chiao Tung University
ABSTRACT
The increasing demand for wireless video-based interactive and multimedia data services explains why 60-GHz wireless system is a promising candidate to provide multi-gigabit-per-second services. While attempting to generate and transmit 60-GHz signals in a wireless system cost effectively and increase the spectral efficiency to facilitate multi-gigabit-per-second services, this work presents four novel RoF systems based on optical frequency multiplication to reduce the bandwidth requirement of optical transmitters. In this thesis, the performances of RoF systems are investigated by theoretical analysis, VPI WDM-TransmissionMaker simulation, and experimental demonstration. Additionally, we employ RoF systems with OFDM modulation, single carrier modulation, adaptive bit-loading algorithm, I/Q imbalance compensation algorithm, and pre-coded method to successfully circumvent multiple system impairments resulting in significant system performance improvement.
Optical I/Q up-conversion system with frequency quadrupling technique for 60-GHz RoF system are proposed. The advantage of the proposed transmitter is that no electrical mixer is needed to generate RF signal. Therefore, I/Q data of RF signals are processed at baseband at the transmitter, which is independent
of the carrier frequency of the generated RF signal. Negligible power penalty following 25-km standard single-mode fiber transmission is observed, capable of significantly extending the service range to various applications within a building or campus.
Electrical I/Q up-conversion RoF system which is a simple architecture for 60-GHz application are proposed. This system can achieve fiber transmission distances exceeding 3-km and 10-m wireless transmission distance without any chromatic dispersion compensation. Fiber links of 3km are sufficient for most short-range RoF applications such as in-building systems, where low system complexity is very critical. This work also demonstrates the 2×2 MIMO technique for capacity improvement of the proposed system. Both SISO and MIMO systems are achieved record data-rate within 7-GHz license-free band at
60 GHz and BER measurement results are below the FEC limit of 1x10⁻³.
Hybrid access network which support both 60-GHz RoF and FTTx systems using a frequency multiplication technique are presented. One of architectures uses single-electrode MZM with frequency doubling technology. The other architecture uses dual parallel MZM with frequency quadrupling technology. Furthermore, wavelength reuse for uplink data transmission via a RSOA is also demonstrated. Two proposed hybrid access network systems exhibit no RF fading, no narrow-band optical filter is required at the remote node to separate the RF and BB signals, and vector signals are carried. Therefore, the proposed systems are compatible with the current PON system.
ACKNOWLEDGEMENT
在博士班這四年,首先感謝我的指導老師 陳智弘教授與 林俊廷 教授,提供良好的實驗環境以及無私的指導與照顧,並教導我實驗方 法以及報告技巧,讓我在博士生涯中成長許多,也更認識自己的長處 與短處。還要感謝 祁甡教授提供給我許多寶貴的意見及資源,使我 提升不少的研究能力以及對事情的看法,另外要特別感謝 Anthony Ng’oma 博士、Hejie Yang 博士、Rakesh Sambaraju 博士,讓我在 Corning 公司的實習期間,獲益良多。 這些年來,感謝與我一起奮鬥,一起成長的實驗室伙伴們:非常 感謝Kate 在研究生涯上的幫忙,感謝 Boris 學長、達儒、芳銘同學、 俊宏、奕誠、星宇、立穎、彥霖、明義、維元、宜閔、上詠、冠穎學 弟,讓我博士生涯不孤單。還有許許多多的學弟妹們在我實驗忙碌時, 熱心地幫忙處理瑣事,謝謝你們陪我度過這段日子。 另外我要感謝高中到研究所的同學朋友們,謝謝你們的加油與鼓 勵,並感謝交大給予我許多的資源與溫暖,讓我成長與茁壯。最後要 感謝我的家人,爸爸的支持與媽媽的擔心,親戚的加油及照顧,因為 你們我才能勇敢地克服困難,完成博士學位。帶著歡笑與淚水編織而 成的回憶,邁向下個新奇的旅程,再會了交大。 江文智 于 風城 交大 民國一零一年七月TABLE OF CONTENTS
ENGLISH ABSTRACT... i
ACKNOWLEDGMENT... iii
TABLE OF CONTENTS... iv
LIST OF FIGURES... viii
LIST OF TABLES... xvii
Chapter 1 INTRODUCTION ... 1
1.1 Review of Wireless Communication Systems ... 1
1.2 Radio-over-Fiber Technologies ... 5
1.3 Digital Signal Processing... 7
1.4 Current State of 60 GHz RoF System ... 8
1.5 Objective and Outlines of the Thesis ... 9
Chapter 2 RADIO-OVER-FIBER SYSTEMS USING EXTERNAL MODULATOR ... 12
2.1 The Architecture of 60 GHz Radio-over-Fiber Systems ... 12
2.2 Optical System ... 13 2.2.1 Optical Transmitter ... 13 2.2.2 Optical Channel ... 19 2.2.3 Optical Receiver ... 21 2.3 Wireless System ... 24 2.3.1 Wireless Transmitter ... 24 2.3.2 Wireless channel ... 25 2.3.3 Wireless Receiver ... 25
2.4.1 Inter-Symbol Interference ... 27
2.4.2 Frequency-Selective Fading ... 28
2.4.3 I/Q Imbalance ... 29
2.4.4 Peak-to-Average Power Ratio ... 29
2.5 Summary ... 30
Chapter 3 DIGITAL MODULATION TECHNIQUES ... 31
3.1 Preface ... 31
3.2 Digital Modulation Formats ... 31
3.2.1 Single Carrier ... 31
3.2.2 Orthogonal Frequency-Division Multiplexing ... 35
3.2.3 Single-Carrier Frequency-Domain-Equalization ... 37
3.2.4 Single-Carrier Frequency-Division Multiple Access ... 40
3.2.5 Single-Carrier Frequency-Division Multiplexing ... 43
3.3 Digital Signal Processing for System Impairments ... 47
3.3.1 Adaptive Bit-loading Algorithm ... 47
3.3.2 I/Q Imbalance Compensation Algorithm ... 50
3.4 Multiple-Input Multiple-Output ... 53
3.5 Summary ... 56
Chapter 4 OPTICAL I/Q UP-CONVERSION RADIO-OVER-FIBER SYSTEM ... 58
4.1 Preface ... 58
4.2 The Concept of Proposed System ... 59
4.3 Theoretical Calculations and Simulation Results ... 61
4.3.1 The Generated Optical Signal ... 61
4.3.3 Consider Dispersion Effect ... 69
4.4 Experimental Demonstration without Frequency Quadrupling ... 70
4.4.1 Experiment Setup ... 70
4.4.2 Results and Discussions ... 72
4.5 Experimental Demonstration with Frequency Quadrupling... 76
4.5.1 Experiment Setup ... 76
4.5.2 Results and Discussions ... 78
4.6 Summary ... 91
Chapter 5 ELECTRICAL I/Q UP-CONVERSION RADIO-OVER-FIBER SYSTEM ... 92
5.1 Preface ... 92
5.2 The Concept of Proposed System ... 93
5.3 Theoretical Calculations and Simulation Results ... 95
5.3.1 The Generated Optical Signal ... 95
5.3.2 The Generated Electrical Signal ... 97
5.3.3 Beat Noise in Proposed System ... 99
5.4 Experimental Demonstration of Proposed System ... 104
5.4.1 Experimental Setup for SISO System ... 104
5.4.2 Results and Discussions for OFDM Signal ... 107
5.4.3 Experimental Setup for SC-FDM Signal ... 123
5.4.4 Results and Discussions for SC-FDM Signal ... 124
5.4.5 Experimental Setup for MIMO System ... 136
5.4.6 Results and Discussions for MIMO System ... 138
5.5 Summary ... 140
6.1 Preface ... 141
6.2 Hybrid Access Network System with Frequency Doubling ... 142
6.2.1 Concept and Theoretical Analysis of Proposed System ... 142
6.2.2 Experimental Demonstration of Proposed System ... 146
6.3 Hybrid Access Network with Frequency Quadrupling ... 152
6.3.1 Concept of Frequency Quadrupling System ... 152
6.3.2 Experimental Demonstration of Frequency Quadrupling ... 154
6.3.3 Concept of Pre-coded Technique ... 163
6.3.4 Experimental Demonstration of Pre-coded Technique ... 174
6.3.5 Concept of Hybrid Access Network ... 182
6.3.6 Experimental Demonstration of Hybrid Access Network... 184
6.4 Summary ... 193
Chapter 7 CONCLUSION ... 195
REFERENCES ... 199
CURRICULUM VITAE ... 211
LIST OF FIGURES
Figure 1-1 Worldwide unlicensed band for 60 GHz. ... 4
Figure 1-2 Propagation losses at 2.4 GHz and 60 GHz. ... 4
Figure 1-3 Basic structure of wireless system. ... 6
Figure 1-4 Basic structure of Radio-over-Fiber system. ... 6
Figure 2-1 The principle diagram of the optical mm-wave generation using MZM. ... 18
Figure 2-2 The magnitude of Bessel functions versus different RF modulation index. ... 19
Figure 2-3 The generated optical spectrum: (a) DSB signal; (b) DSBCS signal. ... 19
Figure 2-4 The model of optical channel in a RoF system. (OBPF: optical bandpass filter; EDFA: erbium doped fiber amplifier.) ... 21
Figure 2-5 Simulated RF power of the generated mm-wave signal versus standard single-mode fiber length. ... 23
Figure 2-6 The model of wireless transmitter of RoF system. ... 24
Figure 2-7 Wireless receiver: (a) direct conversion; (b) multiple conversions; (c) digital conversion. (BPF: bandpass filter; LO: local oscillator; DSP: digital signal processing.) ... 27
Figure 2-8 The schematic diagram of inter-symbol interference. ... 28
Figure 2-9 The schematic diagram of I/Q imbalance. ... 29
Figure 2-10 The schematic diagram of PAPR. ... 30
Figure 3-1 The waveform of bandpass modulation signals. ... 33
Figure 3-2 Signal constellation: (a) BPSK, (b) QPSK, (c) 8-PSK. ... 34
Figure 3-4 The principle diagram of error vector magnitude (EVM). ... 35
Figure 3-5 Block diagrams of OFDM transmitter (a) and receiver (b). (IFFT: inverse fast Fourier transform, DAC: digital-to-analog converter, ADC: analog-to-digital converter, FFT: fast Fourier transform) ... 36
Figure 3-6 Basic idea for frequency domain equalization. ... 40
Figure 3-7 Block diagrams of SC-FDE transmitter and receiver. ... 40
Figure 3-8 Block diagrams of SC-FDMA transmitter and receiver. ... 42
Figure 3-9 Block diagrams of SC-FDE transmitter. ... 43
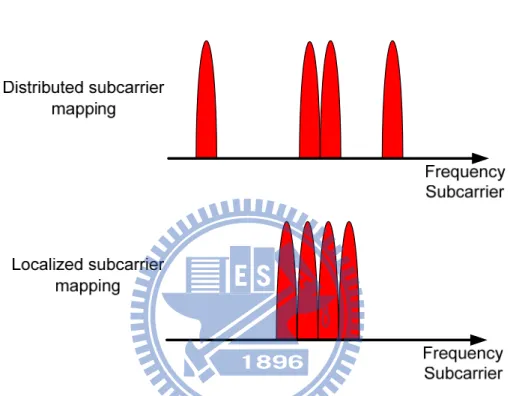
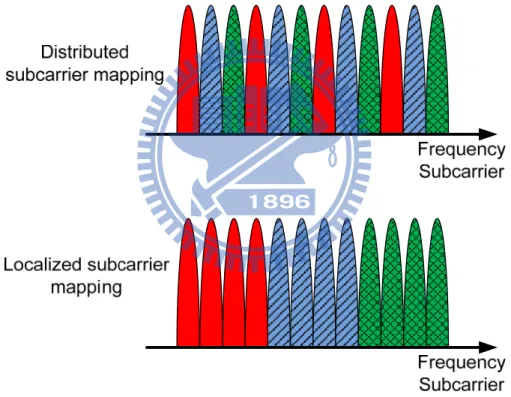
Figure 3-10 The distributed and localized subcarrier mapping modes for one user of SC-FDMA signal. ... 43
Figure 3-11 Block diagrams of proposed SC-FDM transmitter and receiver. .. 46
Figure 3-12 The distributed and localized subcarrier mapping modes for SC-FDM signal with 3 groups. ... 46
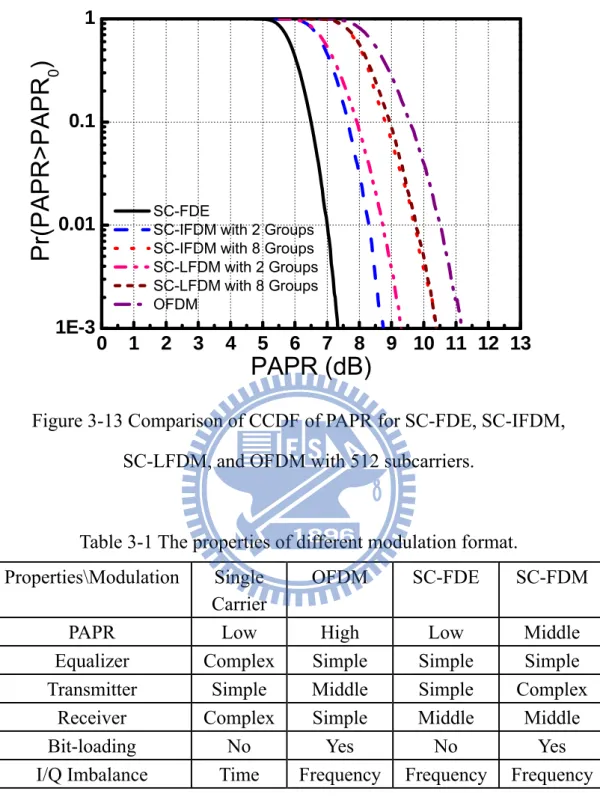
Figure 3-13 Comparison of CCDF of PAPR for SC-FDE, SC-IFDM, SC-LFDM, and OFDM with 512 subcarriers. ... 47
Figure 3-14 The principle diagram of water filling algorithm. ... 49
Figure 3-15 The principle diagram of adaptive bit-loading algorithm. ... 49
Figure 3-16 The principle diagram of Gram–Schmidt orthogonalization procedure (GSOP). ... 52
Figure 3-17 The effect of I/Q imbalance in frequency domain. ... 53
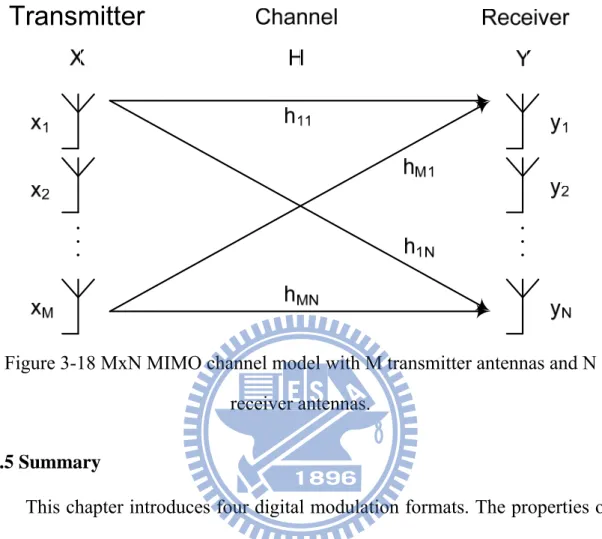
Figure 3-18 MxN MIMO channel model with M transmitter antennas and N receiver antennas. ... 56
Figure 4-1 Conceptual diagram of the 60-GHz RoF system using all-optical up-conversion. ... 61
Figure 4-3 Simulation results of QPSK signal of amplitude mismatch and conjugate misalignment. ... 68 Figure 4-4 Simulation results of 16-QAM signal of amplitude mismatch and
conjugate misalignment. ... 69 Figure 4-5 Experimental setup of the proposed optical I/Q up-conversion
system. ... 71 Figure 4-6 Experimental results of QPSK signal of amplitude mismatch and
conjugate misalignment. ... 73 Figure 4-7 Experimental results of 16-QAM signal of amplitude mismatch and
conjugate misalignment. ... 74 Figure 4-8 BER curves of (a) 5-Gb/s QPSK and (b) 10-Gb/s 16-QAM signals.
... 75 Figure 4-9 Experimental setup of the 60-GHz RoF system using all-optical
up-conversion. ... 78 Figure 4-10 Constellations of the 16-QAM OFDM signals. ... 82 Figure 4-11 BER curves of the 16-QAM OFDM signals. ... 83 Figure 4-12 The SNR and BER versus amplitude ratio between I and Q without and with I/Q imbalance compensation... 84 Figure 4-13 The SNR curves versus subcarrier number for OFDM signal with
1.2 amplitude ratios. ... 85 Figure 4-14 Constellations of the 16-QAM OFDM signals with 1.2 amplitude
ratios. ... 85 Figure 4-15 The SNR and BER versus phase difference between I and Q
without and with I/Q imbalance compensation. ... 86 Figure 4-16 The SNR curves versus subcarrier number for OFDM signal with 9
degree phase difference. ... 87 Figure 4-17 Constellations of the 16-QAM OFDM signals with 9 degree phase
difference. ... 87 Figure 4-18 The BER curves of 16QAM OFDM signal without and with I/Q
imbalance compensation. ... 88 Figure 4-19 The BER curves of 31.37Gbps bit-loading OFDM signal without
I/Q imbalance compensation. ... 88 Figure 4-20 The BER curves of 32.38Gbps bit-loading OFDM signal with I/Q
imbalance compensation. ... 89 Figure 4-21 The SNR curves versus subcarrier number for 32.38Gbps
bit-loading OFDM signal. ... 89 Figure 4-22 Constellations of the 32.38Gbps bit-loading OFDM signal with
-6dBm optical received power. ... 90 Figure 5-1 The proposed RoF system based on a single-electrode MZM. ... 95 Figure 5-2 The magnitude of Bessel functions versus different RF modulation
index. ... 97 Figure 5-3 Simulated RF power of the generated mm-wave signal versus
standard single-mode fiber length for various input frequency
differences (i.e. f2 - f1). ... 99
Figure 5-4 Beat noise interference in the proposed system and how to keep it from degrading system performance: (a) beat signal falls inside the desired band, (b) beat signal is far away from desired band, and (c) beat noise is just outside the desired frequency band. ... 102 Figure 5-5 Simulations results of RF fading at 60 GHZ band versus different
modulation format. ... 103
Figure 5-6 Experimental setup of the proposed RoF system. ... 107
Figure 5-7 BER curves of 13.875-Gb/s QPSK OFDM signal after transmission over the RoF system including 3 m wireless distance. ... 114
Figure 5-8 The down-convert electrical spectrums for different standard single-mode fiber transmission length. ... 115
Figure 5-9 Simulations results of RF fading with DSB system. ... 115
Figure 5-10 Simulations results of RF fading with proposed system. ... 116
Figure 5-11 Constellations of QPSK OFDM signals. ... 117
Figure 5-12 SNR versus different subcarrier for different standard single-mode fiber transmission length. ... 117
Figure 5-13 BER curves of 13.875-Gb/s QPSK OFDM signal without wireless transmission. ... 118
Figure 5-14 SNR versus different subcarrier for different optimized frequency. ... 118
Figure 5-15 SNR versus different subcarrier with I/Q imbalance compensation. ... 119
Figure 5-16 SNR and data format versus different subcarrier with adaptive bit-loading algorithm. ... 119
Figure 5-17 BER as functions of received optical power ... 120
Figure 5-18 BER as functions of RF received power ... 120
Figure 5-19 Data rate as function of optical fiber transmission distance. ... 121
Figure 5-20 Data rate as function of RF received power. ... 121
Figure 5-21 Data rate as functions of wireless distance. ... 122
Figure 5-23 Demodulated signal at 40 Gb/s for different subcarriers (a) 67 – 71 (b) 6 – 10, and (c) 24 and 37. ... 123 Figure 5-24 BER curves of the 64-QAM SC-FDM signal with one group and
512 IFFT size, (a) without I/Q imbalance compensation, (b) with I/Q imbalance compensation. ... 128 Figure 5-25 Simulations results of PAPR versus different IFFT size. ... 129 Figure 5-26 BER curves of the 64-QAM SC-FDM signal with different IFFT
size. ... 129 Figure 5-27 The down-convert electrical spectrums of the SC-FDM signal for
different standard single-mode fiber transmission length. ... 130 Figure 5-28 BER curves with different number of groups for BTB case. ... 130 Figure 5-29 Simulations results of PAPR versus different number of groups.131 Figure 5-30 Data rate as function of number of groups for BTB case. ... 131 Figure 5-31 BER curves with different number of groups after 5km fiber
transmission. ... 132 Figure 5-32 Data rate as function of number of groups after 5km fiber
transmission. ... 132 Figure 5-33 BER curves of SC-LFDM and SC-IFDM signal, (a) with 8 groups,
(b) with 64 groups. ... 133 Figure 5-34 Simulations results of PAPR for SC-LFDM and SC-IFDM signal.
... 134 Figure 5-35 Experimental results of data rate for SC-LFDM and SC-IFDM
signal. ... 134 Figure 5-36 Experimental results of data rate for SC-FDM and OFDM signal.
Figure 5-37 BER curves of the 128-QAM SC-FDM signal with one group and 512 IFFT size. ... 135 Figure 5-38 Experimental setup of 2x2 MIMO system. ... 137 Figure 5-39 The principle diagram of the signal design of 2x2 MIMO system.
... 138 Figure 5-40 Spatial arrangements for 2x2 MIMO RoF systems. ... 138 Figure 5-41 BER performance as function of wireless received power with
different fiber transmission distance. ... 139 Figure 6-1 The concept of proposed hybrid access network with frequency
doubling. ... 145
Figure 6-2 SIRRF and SIRBB versus modulation index of BB and RF,
respectively. ... 146 Figure 6-3 The principle of pre-coded scheme of the QPSK format with
frequency doubling system. (QPSK: quadruple phase-shift keying) ... 146 Figure 6-4 Experimental setup of the proposed system. (OOK: on-off-keying;
EDFA: erbium doped fiber amplifier; BPF: band pass filter; RN: remote node; BERT: bit error rate tester.) ... 149 Figure 6-5 Optical spectra (a) without OOK signal (b) with OOK signal. ... 150 Figure 6-6 BER curves of RF QPSK signal. (FEC: forward error correction)151 Figure 6-7 BER curves of BB OOK signal. ... 151 Figure 6-8 The concept of optical frequency quadrupling millimeter-wave
generation. (LD: laser diode) ... 154 Figure 6-9 Experimental results of the 40-GHz optical spectrum and electrical
Figure 6-10 Experimental results of the 60-GHz optical spectrum and electrical
waveform. ... 158
Figure 6-11 Experimental setup of the WDM up-conversion system using frequency quadrupling technique with four channels 1.25-Gbps OOK signal. (TOF: tunable optical filter; LPF: lowpass filter.) ... 159
Figure 6-12 The optical spectra (a) without up-conversion (b) with up-conversion. ... 160
Figure 6-13 Receiver sensitivities versus different sub-MZM bias drift. ... 161
Figure 6-14 The BER curves and eye diagrams for BTB and after 50-km standard single-mode fiber transmission. (a) BB wireline signals; (b) RF OOK wireless signals. ... 162
Figure 6-15 The concept of the millimeter-wave generation using single-electrode MZM. ... 169
Figure 6-16 The principle of pre-coded scheme of the QPSK format with frequency quadrupling system. ... 169
Figure 6-17 Electrical spectra of 12 pre-coded QPSK signals. ... 171
Figure 6-18 Constellation transfer path of 12 pre-coded QPSK signals... 172
Figure 6-19 The principle of pre-coded scheme of the 8-QAM format with frequency quadrupling system. ... 172
Figure 6-20 Electrical spectra of 8 pre-coded 8-QAM signals. ... 173
Figure 6-21 Experimental setup of pre-coded test system. ... 177
Figure 6-22 Electrical spectrum after arbitrary waveform generator. ... 178
Figure 6-23 Electrical spectrum after up-conversion. ... 178
Figure 6-24 Optical spectrum after MZM modulation. ... 179
Figure 6-26 SNR and path length versus different QPSK signals. ... 180
Figure 6-27 The BER curves for QPSK signals with different arrange type. . 180
Figure 6-28 SNR and path length versus different 8-QAM signals. ... 181
Figure 6-29 The BER curves for 8-QAM signals with different arrange type. ... 181
Figure 6-30 Concept of proposed hybrid access network system with frequency quadrupling. ... 183
Figure 6-31 Concept of pre-coded method with frequency quadrupling. ... 184
Figure 6-32 Experimental setup of the proposed hybrid access network system with frequency quadrupling. (RSOA: reflective semiconductor optical amplifier.) ... 188
Figure 6-33 Electrical spectrum after up-conversion. ... 189
Figure 6-34 Optical spectra of the RF signal before and after combing. ... 189
Figure 6-35 Electrical spectrum after down-conversion. ... 190
Figure 6-36 Optical spectra of different OPRs. ... 190
Figure 6-37 BB OOK and RF 8-PSK sensitivities with different OPRs. ... 191
Figure 6-38 BER curves of RF PSK signal. ... 191
Figure 6-39 BER curves of BB OOK signal. ... 192
Figure 6-40 BER curves of uplink OOK signal. ... 192
LIST OF TABLES
Table 3-1 The properties of different modulation format. ... 47 Table 6-1 Comparison of 12 pre-coded QPSK signals. ... 170 Table 6-2 Comparison of 8 pre-coded 8-QAM signals. ... 173
Chapter 1
INTRODUCTION
1.1 Review of Wireless Communication Systems
Instantaneous information exchanges, which drive wireless communications to be more and more important in the past 20 years, have become an important part of daily life for many people today. The general idea of wireless communications is transferring signals by electro-magnetic waves which provide mobility to the end users. The first-generation (1G) wireless communication system is the narrowband analog system which was launched in Japan by Nippon telegraph and telephone (NTT) in 1979. With the disadvantages of low spectral efficiency, incompatible with digital data services, and poor security, the second-generation (2G) which are narrowband digital systems was proposed in the 1991. Mobile devices, such as smart phones, tablet, ultrabooks, and e-readers, growth rapidly these days and provide conveniences of internet accesses for various kind of services, including social networking sites, online gaming, video calls, video streaming, cloud computing, and cloud storages. To support the tremendous amount of data transmission, broad-band wireless communications, including 3G, 4G (LTE, WiMAX), and WiFi, were proposed [1-7].
Today, these wireless technologies have become a part of daily life and continue developing to provide better quality of experience. On the other hand, the better quality of experience means the wireless systems need to provide higher data rates. However, data rates of current microwave wireless systems are still limited to several tens of Mbps which are hampered by congestion and
limited spectrum in their current frequency bands of operation. Since the key to achieve higher data rate is bandwidth, the most promising path to multi-Gbps wireless communication is the use of mm-wave frequencies where very large bands of frequency spectra are available [8]. Thanks for the advances in process technologies and low cost integration solutions over the past few years. The mm-wave technology has attracted great interest of the standards groups and industry alliances. For instance, the US Federal Communications Commission (FCC) released a number of unlicensed bandwidth at 60GHz (57-64 GHz), 70GHz (71-76 GHz), 80GHz (81-86GHz), and 90GHz (92-94GHz and 94.1-95GHz) [9, 10].
Since the 60 GHz technology enables many new applications which are difficult to be offered by wireless systems at lower frequencies, the 60 GHz band has attracted many standardization bodies based on the huge continuous unlicensed bandwidth. As show in Fig. 1-1, many countries define different unlicensed bandwidth at 60GHz. For example, 9-GHz bandwidth is available in Europe and 7GHz bandwidth is available in USA, Canada, Japan and Korea [11-38].
The huge unlicensed bandwidth represents great potential for gigabit wireless applications. Furthermore, the standers for 60GHz application allow much higher transmit power that could provide high signal quality than other frequency bands. For example, the equivalent isotropic radiated power (EIRP) for 60GHz band is 35dBm and the EIRP for 802.11n is 25dBm. The reason for the higher EIRP limitation at 60GHz is crowded applications in lower frequency band [12]. Because of the combination of high EIRP limit and huge unlicensed bandwidth, the 60GHz system could provide services, such as
uncompressed HD video streaming with high speed data transfer, which ensure high quality performance and low latency for exceptional use experience.
However, 60-GHz wireless networking brings many technical challenges owing to the high carrier frequencies and the wide channel bandwidths. The challenges include the significantly higher air-link loss, and reduced device performance and lower power efficiency. Figure 1-2 shows the propagation losses comparison between the 2.4-GHz WiFi and the 60-GHz wireless signals. The propagation loss of the 60-GHz wireless signals is about 30 dB higher than 2.4 GHz WiFi signal [12]. In addition, the wide channel bandwidth means higher noise power and reduced signal-to-noise ratio (SNR).
Because of the high path loss and high attenuation through building walls, in-building radio cells at 60 GHz are confined to a single room [36]. This reduces user interference resulting in very high wireless data capacity per user [37]. All of these factors make wireless networking at 60-GHz “pico-cellular” in nature with the radio cells typically smaller than 10 m. Consequently, multi-gigabit-per-second wireless networking at 60 GHz requires an extensive high-capacity feeder network to interconnect the large number of radio access points.
F Figure 1-1 Figure 1-2 P 1 Worldwid Propagatio de unlicens on losses at sed band fo t 2.4 GHz a or 60 GHz. and 60 GH . Hz.
1.2 Radio-over-Fiber Technologies
Figure 1-3 shows the basic structure of traditional wireless communication systems. The traditional wireless access points receive baseband on-off keying signal from the central office using Ethernet cables. The access points convert the wirelind baseband signal to wireless RF signal. Since the bandwidth of wireless channel is limited, the wireless systems need modulation formats with higher spectral efficiencies than wireline systems. After digital signal processing, the digital signal transfer to the analog signal by using digital to analog converter. The baseband analog signals up-convert to desire carrier frequency using electrical I/Q mixer. The generated RF signal is amplified using RF amplifiers and transmitted using wireless antennas.
Because of the high wireless path loss and high attenuation through building walls for the 60-GHz wireless signal, the signal coverage per cell is much smaller than the WiFi system. More antenna units are required for the 60-GHz wireless system to provide the same signal coverage as the WiFi system. However, more antenna units also increase the system complexity and cost. Complex antenna units are not practical solutions for the 60GHz applications. Therefore, the system needs to simplify the antenna units.
Recently, radio-over-fiber (RoF) systems have attracted considerable interest because of their potential implementation in future broadband wireless communications. Since RoF technology reduces the cost of the access points and shifts the system complexity to central office, it can provide the required feeder network as it is best suited to deal with the demands of small-cell networks [38].
based on RoF technology. The central office receives the data from the core network first. Then the central office generates the electrical RF signal. The electrical RF signal transfer to RoF signal by using optical modulator. After the optical fiber transmission, the RoF signal is sent into photodiode and converted to electrical RF signal at access point. For the RoF system, the access point does not need digital to analog converts, digital signal processing, electrical mixers, and RF local oscillators. Consequently, the advantages of RoF technologies have made them attractive options for 60 GHz wireless applications [18-35].
Figure 1-3 Basic structure of wireless system.
1.3 Digital Signal Processing
Since the capacity requirement for wireless communications continues to increase, high spectral efficiency modulation formats and a high carrier frequency are required for the next generation of ultra-high capacity wireless systems. Many standards have been proposed concerning the delivery of multi-gigabit-per-second services for 60-GHz wireless system in the 7-GHz license-free band, including IEEE 802.15.3c, ECMA 387, WirelessHD, IEEE 802.11.ad and Wireless Gigabit Alliance (WiGig). These standards utilize many data formats, such as phase-shift keying (PSK), minimum-shift keying (MSK), quadrature amplitude modulation (QAM), amplitude-shift keying (ASK), differential phase-shift keying (DPSK), single-carrier frequency-domain-equalization (SC-FDE), and orthogonal frequency-division multiplexing (OFDM). Moreover, these standards not only have different data formats but also have different data throughput. For example, the IEEE 802.15.3c supports data rate from 25.3Mbps to 5.67Gbps. The WirelessHD specification can support data rates up to 28 Gbps for 4K resolution and 3D TV support [12].
In order to achieve multi-standard operation, 60-GHz RoF systems must be able to handle wireless signals with different requirements. These standards may impose different system performance requirements on the 60-GHz RoF systems. For instance channel uniformity is very critical for single-carrier systems [29, 39]. On the other hand, the presence of multiple carrier transmission in the OFDM signal format makes linearity and the ability to handle a high peak-to-average power ratio (PAPR) very critical system parameters. Therefore, the properties of modulation format are very important
for the system design [33-35, 40].
Furthermore, the system requirements are rendered even more critical for the very wide-band (>1 GHz) channels being considered at 60 GHz and other mm-wave bands. The consequence of these requirements is that they lead to the use of digital signal processing (e.g. I/Q imbalance compensation and adaptive bit-loading algorithm) for signal demodulation.
1.4 Current State of 60 GHz RoF System
Although the feasibility of the 60-GHz RoF system has been demonstrated using electro-absorption-modulator (EAM) [18-22], 60-GHz equipment and components are required, subsequently increasing overall system costs significantly. Moreover, the EAM modulation generates a double sideband (DSB) signal, which suffers from dispersion-induced performance fading. Therefore, the maximum data throughput has been demonstrated is 21 Gbps by using OFDM modulation format [22].
Generating a 60-GHz millimeter-wave signal with frequency doubling and overcome the dispersion-induced performance fading warrants the development of a double sideband with carrier suppression (DSB-CS) modulation scheme using Mach-Zehnder modulator (MZM), and can support only an on-off-keying (OOK) modulation format [23, 24]. However, OOK format cannot fulfill next generation wireless multimedia services with a target bit rate reaching 10 Gb/s within the 7-GHz license-free band at 60 GHz.
Recently, some of complex RoF system architectures for radio-frequency OFDM signal transmission are proposed with a target bit rate reaching 14 Gbps [33, 34]. However, it is imperative that the employed RoF links are as simple as possible to reduce cost, while providing the needed performance. This is
especially true for certain applications such as in-building systems, where certain performance attributes offered by complex RoF systems are not even required. Therefore, the 60 GHz RoF system that has simple architecture and support vector signals is very important for future applications.
1.5 Objective and Outlines of the Thesis
In this thesis, four novel RoF systems were proposed for transporting and generating wideband signals at 60 GHz, and the performances were investigated both theoretically and experimentally. The first architecture demonstrates the feasibility of the generation of an RF direct-detection vector signal using optical I/Q up-conversion. The second system demonstrates a short-range RoF system employing a single-electrode Mach-Zehnder modulator (MZM). Both systems transmit single-carrier and multi-carrier signal, and employ several digital signal processing techniques. The third and fourth systems present two simple hybrid access network architectures for generating and transmitting a 60GHz radio frequency (RF) phase-shift keying (PSK) signal with a baseband (BB) on-off keying (OOK) signal simultaneously.
This thesis is organized as the following. Chapter 1 provides the review of wireless systems and the advantages of 60 GHz technology. The challenges of the transmission of the 60 GHz signal are also discussed. Therefore, the 60 GHz RoF systems with digital signal processing attract great interests for future applications. Chapter 2 describes the basic ideas of 60 GHz RoF systems using external modulator. RoF system can be separated into an optical system and a wireless system. Optical system includes the optical transmitter, the optical channel and the optical receiver. The optical double-sideband (DSB) and
double-sideband with carrier suppression (DSB-CS) modulation schemes will be discussed. The properties of 60 GHz components and 60 GHz wireless channel will be discussed. The impairments of 60 GHz RoF systems will also been investigated in Chapter 2. The properties of digital signal modulation formats and digital signal processing will be discussed in Chapter 3. The signal carrier, OFDM, SC-FDE, single-carrier frequency-division multiple access (SC-FDMA), and single-carrier frequency-division multiplexing (SC-FDM) modulation formats will be discussed. The digital signal processing for system impairments and concept of multiple-input multiple-output (MIMO) will also been discussed.
A novel optical I/Q up-conversion RoF system for 60 GHz wireless applications will be proposed in Chapter 4. The advantage of the proposed transmitter is that no electrical mixer is needed to generate RF signals. Therefore, I/Q data of RF signals are processed at baseband at the transmitter, which is independent of the carrier frequency of the generated RF signal. Theoretical analysis and experimental demonstration of this system will be performed. The impacts of the I/Q imbalance will also been discussed. In order to achieve multi-standard operation, signal carrier and OFDM signals are utilized in the proposed system. The I/Q imbalance correction and adaptive loading algorithm are used to improve system performance. In Chapter 5, a simple 60GHz RoF system employing a single-electrode MZM are demonstrated. This system uses only one single-electrode MZM with bandwidth less than 35.5 GHz. The impacts of fiber chromatic dispersion and beat-noise on the performance of the RoF system are investigated by theoretical analysis and experimental demonstration. OFDM, SC-FDE and
SC-FDM signal generation and modulation techniques will be developed. 2 x 2 MIMO technologies also investigated to increase the data throughput within the 7 GHz band.
In Chapter 6, two novel multi-service hybrid access network systems for 60GHz wireless and wireline applications using frequency multiplication techniques will be presented. One of architecture uses a single-electrode MZM with frequency doubling technology. The other architecture uses a dual-parallel MZM with frequency quadrupling technology. These two schemes employ a novel pre-coded method that is based on the digital signal processing. The proposed systems does not suffer from RF fading and needs no narrow-band optical filter at the remote node to separate the RF and baseband signals. A frequency multiplication method for RoF link is realized to reduce the bandwidth requirement of the transmitter. Finally, Chapter 7 reviews the main conclusion of the thesis.
Chapter 2
RADIO-OVER-FIBER SYSTEMS USING EXTERNAL
MODULATOR
2.1 The Architecture of 60 GHz Radio-over-Fiber Systems
There are two parts in radio-over-fiber (RoF) system: optical system and wireless system [38]. The optical system includes optical transmitter, optical channel, and optical receiver. The wireless system includes wireless transmitter, wireless channel, and wireless receiver. Optical transmitter converts an electrical input signal into the corresponding optical signal and then launches it into the optical fiber serving as a communication channel. Since the optical signal transfer in the optical fiber, the signal would suffer fiber dispersion that would induce frequency-selective fading. This phenomenon would introduce in 2.2.2. The role of an optical receiver is to convert the optical signal back into electrical form using photodiode. The generated electrical signal is at radio frequency and then launches it into the antenna serving as wireless transmitter.
For the wireless transmitter, the electrical amplifier amplified radio frequency signal and then broadcast the signal into the air by using antenna. The signal transfers the energy using electro-magnetic waves without wires. At wireless receiver side, the radio frequency signal down-converted to lower frequency and demodulated the signal. In this chapter, we will do an introduction about the radio-over-fiber systems using external Mach-Zehnder Modulator (MZM), and investigate its impairments of theoretically and experimentally in 2.3.
2.2 Optical System
2.2.1 Optical Transmitter
The traditional optical transmitter concludes RF driving signal, optical source, and optical modulator. The RF driving signal with high spectral efficiency modulation is required to provide higher data-rate transmission because the bandwidth of a wireless channel is limited. Therefore, high order quadrature amplitude modulation (QAM) is a good candidate [41]. The corresponding system requires I/Q mixer to up-convert the in-phase (I) and quadrature phase (Q) signals.
Presently, most RoF systems are using laser as optical source. The advantages of laser are compact size, high efficiency, good reliability small emissive area compatible with fiber core dimensions, and possibility of direct modulation at relatively high frequency.
For the optical modulator, direct modulation and external modulation are two modulations of generated optical signal. When the bandwidth of direct modulation signal is above 10 GHz, the frequency chirp imposed on signal becomes large enough. Hence, it is difficult to apply direct modulation to generate microwave/mm-wave signal. However, the bandwidth of signal generated by external modulator can exceed 10 GHz easily. Presently, most RoF systems are using external modulation with MZM or electro-absorption modulator (EAM) [18-22]. The most commonly used MZM are based on
LiNbO3 (lithium niobate) technology. According to number of electrode, there
are two types of LiNbO3 device: dual-drive Mach-Zehnder modulator
The SD-MZM has two arms and an electrode. The optical phase in each arm can be controlled by changing the voltage applied on the electrode. When the lightwaves are in phase, the modulator is in “on” state. On the other hand, when the lightwaves are in opposite phase, the modulator is in “off ” state, and the lightwave cannot propagate by waveguide for output.
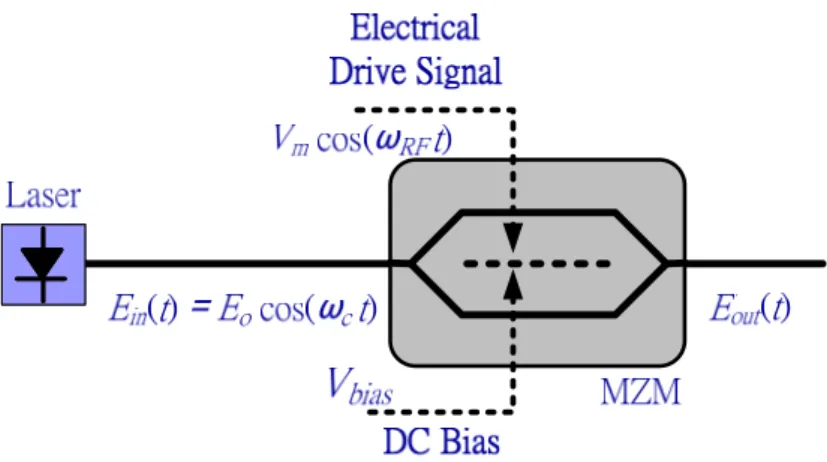
The modulator is used for converting electrical signal into optical form. Because the external dual-parallel modulator was composed of MZMs, we select MZM as modulator to build the architecture of optical transmitter. Figure
2-1 shows the schematic model of the MZM. The incident optical filed Ein is
divided into two optical fields by optical coupler. The two optical fields send into two isolated paths, which are called upper arm and lower arm. The applied electrical signal modifies the velocities of the optical fields by the Pockels-Effect [43]. The velocity variation corresponds to the phase modulation of the optical field. The output optical filed for upper arm is
E E ∙ √a ∙ e∆ (2-1)
Where a is the power splitting ratio of power coupler. ∆φ is the optical
carrier phase difference that is induced by driving voltage for upper arm. The power splitting ratio is defined as the ratio of the transmission power to the coupling power. A coupler always has non-ideal power splitting ratios due to
manufacturing limitations, e.g. a 1 2⁄ . Therefore, the output optical filed for
lower arm is
E E ∙ √1 a ∙ e∆φ (2-2)
∆φ is the optical carrier phase difference that is induced by driving voltage for
lower arm. The output optical filed for MZM is
b is the power splitting ratio of second power coupler in MZM. The power splitting ratio of two couplers of a balanced MZM is 0.5. The output optical filed of the balanced MZM is given by
E ∙ E ∙ e∆φ e∆φ (2-4)
E E ∙ cos ∆ ∙ exp j∆φ ∆φ (2-5)
∆φ is the combined phase shift and can be calculated as the difference between
∆φ and ∆φ (∆φ ∆φ ∆φ ). For single electro x-cut MZM, the driving
voltage for lower arm is the opposite of driving voltage for upper arm
(∆φ ∆φ ) [44]. Therefore, the output optical field for single electro x-cut
MZM can be simplify as
E E ∙ cos ∆ (2-6)
∆φ ≜ ∙ π (2-7)
The v is called half-wave voltage that can induce π combined phase shift if
the half-wave voltage is applied to the driving voltage [45]. If driving voltage
equals to v , the modulator output power has its minimum value. The optical
field E0 of the laser can be expressed by
E E cos t (2-8)
Where E0 and denote the amplitude and angular frequency of input optical
field, respectively. After add time component, the optical field will become as
E E ∙ cos ∆ ∙ cos t (2-9)
The loss of MZM is neglected in previous equations. consisting of an
electrical sinusoidal signal and a dc biased voltage can be written as,
where is the dc biased voltage, and are the amplitude and the angular frequency of the electrical driving signal, respectively. The optical
carrier phase difference induced by is given by
∆
∙ ∙ π (2-11)
Equation (2-10) can be written as:
E E ∙ cos
π ∙ π ∙ cos ω
E ∙ cos b m ∙ cos t ∙ cos ω
E ∙ cos ω t ∙ cos b ∙ cos m ∙ cos ω t sin b ∙ sin m ∙ cos ω t (2-12)
where ≜ π is a constant phase shift that is induced by the dc biased
voltage, and ≜ π is the MZM modulation index (MI). The time
dependent terms in Eq. (2-12) can be substituted with cos x cos θ and sin x cos θ . The cos x cos θ and sin x cos θ terms can be expanded applying Bessel functions. The expansion results can be summarized as follows [46]
cos x cos θ J x 2 1 J x cos 2nθ
∞
sin x cos θ 2 1 J x cos 2n 1 θ
∞
(2-13) Expanding Equation (2-12) using Bessel functions, as detailed in Equation (2-13). The optical field at the output of the MZM can be written as:
E E ∙ cos ∙
cos ∙ 2 ∙ 1 ∙ m ∙ cos 2
sin ∙ 2 ∙ 1 ∙ ∙ cos 2 1
∞
(2-14) where is the Bessel function of the first kind of order n. the optical field of the mm-wave signal can be written as
E E ∙ cos ∙ ∙ cos E ∙ cos ∙ ∙ cos ∞ 2 π E ∙ sin ∙ ∙ cos ∞ 2 1 (2-15)
When the MZM is biased at the maximum transmission point, the bias
voltage is set at 0, and cosb = 1 and sinb = 0. Consequently, the optical
field of the mm-wave driving signal can be written as
E E ∙ ∙ cos
E ∙ ∙ cos
∞
2
(2-16) The amplitudes of the generated optical sidebands are proportional to those of the corresponding Bessel functions associated with the phase modulation index . With the amplitude of the electrical driving signal
equal to , the is π 2⁄ . Due to the properties of Bessel function of the first
kind, the value of would increase as order n decrease when 0
0.5668, 0.2497, 0.069, and 0.014, respectively. Therefore, the optical sidebands with the Bessel function of first kind of high order term can be ignored, and Eq. (2-16) can be further simplified to
E E ∙ ∙ cos E ∙ ∙ cos 2 (2-17)
When the MZM is biased at the middle point, the bias voltage is set at
V , and cos b √ and sin b √ . Consequently, the optical field of
the mm-wave signal using double sideband (DSB) can be written as E
√ ∙ E ∙ ∙ cos ω t
√ ∙ E ∙ ∙ cos (2-18)
When the MZM is biased at the null point, the bias voltage is set at
V , and cos 0 and sin 1. Consequently, the optical field of
the mm-wave signal using DSB with carrier suppression (DSBCS) modulation can be written as
E E ∙ ∙ cos (2-19)
The generated optical spectrums of DSB and DSBCS signal are shown in Fig. 2-3 (a) and (b), respectively.
Figure 2-1 The principle diagram of the optical mm-wave generation using MZM.
0.00 0.25 0.50 0.75 1.00 1.25 1.50 1.75 2.00 -0.25 0.00 0.25 0.50 0.75 1.00
Modulation Index
J
1(m)
J
2(m)
J
3(m)
J
4(m)
Figure 2-2 The magnitude of Bessel functions versus different RF modulation index.
Figure 2-3 The generated optical spectrum: (a) DSB signal; (b) DSBCS signal.
2.2.2 Optical Channel
Communication channel concludes fiber, optical amplifier, etc.. Presently, most RoF systems are using standard single-mode fiber or dispersion compensated fiber (DCF) as the transmission medium. When the optical signal transmits in optical fiber, dispersion will be happened. DCF is use to
compensate dispersion. The transmission distance of any fiber-optic communication system is eventually limited by fiber losses. For long-haul systems, the loss limitation has traditionally been overcome using regenerator witch the optical signal is first converted into an electric current and then regenerated using a transmitter. Such regenerators become quite complex and expensive for WDM lightwave systems. An alternative approach to loss management makes use of optical amplifiers, which amplify the optical signal directly without requiring its conversion to the electric domain. Presently, most RoF systems are using erbium-doped fiber amplifier (EDFA). An optical band-pass filter (OBPF) is necessary to filter out the amplified spontaneous emission (ASE) noise. The model of communication channel is shown in Fig. 2-4.
When optical RF signals are transmitted over a standard single-mode fiber with dispersion, a phase shift to each optical sideband relative to optical carrier
is induced. The propagation constant of the dispersion fiber can be
expressed as [47]
⋯ (2-20)
where is the derivative of the propagation constant evaluated
at . The effect of high order fiber dispersion at 1550-nm band is
neglected. For carrier tones with central frequency at , the eq.
(2-20) can be expressed as
∙ D (2-22) where c is light speed in free space and D is the chromatic dispersion parameter. For a standard single-mode fiber, D is 17-ps/(nm.km) [43]. The fiber loss is ignored. Therefore, after transmission over a standard single-mode fiber of length z, the optical field for the DSB modulation scheme can be written as
E
√ E ∙ cos
cos ∓ (2-23)
The optical field for the DSBCS modulation scheme can be written as
E E ∙ cos ∓ (2-24)
Figure 2-4 The model of optical channel in a RoF system. (OBPF: optical bandpass filter; EDFA: erbium doped fiber amplifier.)
2.2.3 Optical Receiver
Optical receiver usually consists of the photodiode and the trans-impedance amplifier (TIA). The function of photodiode is to convert optical signal to electrical current. The function of TIA is to convert current to output voltage. The generated electrical signal is proportional to the square of the optical filed.
where R is the responsivity of photodiode [47]. The optical field for the DSB modulation scheme will generate the electrical signal after photodiode. The photocurrent for the DSB modulation scheme without optical fiber transmission at different frequency can be expressed as
∙ ∙ 2 ∙
∙ ∙ ∙ ∙
∙ ∙ ∙ (2-26)
For the RoF application, the frequency of desired mm-wave signal is ω .
The reason is that the photocurrent at ω is proportional to driving signal v
without significant distortion for small modulation index. Therefore, the DSB modulation scheme is one of RoF schemes for vector signal generation. In order to investigate the impairment of fiber dispersion, the he photocurrent with
optical fiber transmission at ω can be expressed as
∙ ∙ ∙ ∙ ∙ cos (2-27)
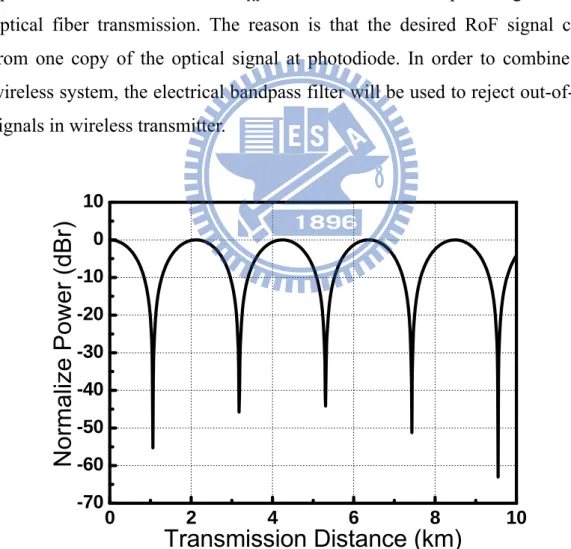
Due to fiber dispersion effect, the RF fading issue would be observed. The
RF signal power is related to cos . Therefore, the RF fading issue
would become serious when the magnitude of frequency become large.
As shown in the Fig. 2-5, when the frequency increases, the RF power
will drop off rapidly. For 60-GHz applications, the frequency is fixed at
60.5 GHz. The first deep appears following 1-km fiber transmission.
The photocurrent for the DSBCS modulation scheme without optical fiber transmission at different frequency can be expressed as
∙ ∙ ∙ (2-28)
The frequency of desired RoF signal is 2 . DSBCS modulation scheme
has effective in the millimeter-wave range with excellent spectral efficiency, a low bandwidth requirement for electrical components. However, the
photocurrent at 2 is proportional to the square of driving signal. Therefore,
DSBCS schemes can only support on-off keying (OOK) format, and none can transmit vector modulation formats, such as phase-shift keying (PSK), QAM, or OFDM signals, which are of utmost importance for wireless applications. In order to investigate the impairment of fiber dispersion, the photocurrent with
optical fiber transmission at 2 is the same with the optical signal without
optical fiber transmission. The reason is that the desired RoF signal comes from one copy of the optical signal at photodiode. In order to combine with wireless system, the electrical bandpass filter will be used to reject out-of-band signals in wireless transmitter.
0 2 4 6 8 10 -70 -60 -50 -40 -30 -20 -10 0 10
Normalize Power (dBr)
Transmission Distance (km)
Figure 2-5 Simulated RF power of the generated mm-wave signal versus standard single-mode fiber length.
2.3 Wireless System
2.3.1 Wireless Transmitter
Thanks to the RoF technology, the wireless transmitter does not need electrical mixer and local oscillator to up-convert signal to wanted carrier frequency. Therefore, the wireless transmitter only consists of electrical bandpass filter, electrical amplifier and, antennas, as shown in Fig. 2-6. Since the high transmit power is necessary to overcome the higher path loss at 60 GHz, FCC allocated the 60 GHz license-free band in US from 57 to 64 GHz with a maximum equivalent isotropically radiated power (EIRP) of 40 dBm average and 43 dBm peak [12]. However, the output power for 60 GHz amplifier is typically limited to 10 dBm because the implementation of efficient power amplifiers at 60 GHz is challenging. Thanks for the huge antenna gain can be used to increase EIRP. The huge antenna gain at 60 GHz has significantly boosted the allowable EIRP limits.
Figure 2-6 The model of wireless transmitter of RoF system.
2.3.2 Wireless channel
In order to improve the quality of 60GHz communications, understand the characteristics of 60GHz wireless channel is very important. The path loss is an important parameter for the wireless application. The Friis free space propagation formula could be express as
P P G G (2-29)
where PR and PT are the transmitted and received power, respectively. λ is the
signal wavelength, d is the transmission dictation between transmitter antenna
and receiver antenna, GT and GR are transmit and receiver antenna gain,
respectively. From this equation, the higher carrier frequency signals have lower wavelength and high path loss. Compared with signal propagation in 2.4 GHz, the path loss in 60 GHz is 20-30dB attenuation.
The other phenomenon of wireless communication is multipath fading. The wireless signals at low frequency suffer serious frequency-selective fading because of the scattering effect which comes from objects that are roughness compared to the wavelength. Things change in 60 GHz signal, the signal wavelength is much smaller than low frequency signal. The reflection effect which comes from objects that are smooth compared to the wavelength. Therefore, the 60-GHz signal does not suffer too much scattering effect, but reflection effect. Because of the reflection loss for the 60-GHz signal is about 10dB, the main propagation phenomenon for 60-GHz signal consists line-of-sight (LoS), first, and second order reflections [12].
2.3.3 Wireless Receiver
RF bandpass filter is used to reject out-of-band signals. In order to keep the SNR of signal as high as possible, the in-band RF signals are then amplified by a low-noise amplifier (LNA). After the LNA, there have three methods for the RF front-end architecture [12].
In first method, the RF signal split into two signals, two RF signals are down-converted to baseband with two mixers and the quadrature local oscillators. Two baseband signals are transferred to digital signals by using analog to digital converters, as shown in Fig. 2-7 (a). Since this direct down-convert system is very challenging in 60 GHz circuit, the system has multiple down-converter stage is more practical. In second method (see Fig. 2-7 (b)), the RF signal is down-converted to intermediate frequency (IF) by a local oscillator and electrical mixer. And then the IF signal split into two signals, two IF signals are down-converted to baseband with two mixers and the quadrature local oscillators. Two baseband signals are transferred to digital signals by using analog to digital converters. In third method, the system is almost the same with second method. As Fig. 2-7 (c) shows, These IF signals are not directly down-converted into baseband but send the IF signal into analog-to-digital converter (ADC). The IF signals are digitalized by ADC. Then, the function of I/Q mixer is done in the digital domain.
Because of the I/Q mixer in digital domain is more accurate than analog I/Q mixer and high sampled scope is not difficult for experiment, this thesis use third method for experimental demonstration.
Figure 2-7 Wireless receiver: (a) direct conversion; (b) multiple conversions; (c) digital conversion. (BPF: bandpass filter; LO: local oscillator; DSP: digital
signal processing.)
2.4 The Impairments of 60 GHz Radio-over-Fiber Systems
2.4.1 Inter-Symbol Interference
One of impairment of 60 GHz RoF system is inter-symbol interference (ISI), which causes a transmitted symbol to be interfered by other transmitted symbols. ISI is usually caused by multipath propagation and non-ideal channel
impulse response. Multipath propagation means that the signal from transmitter to receiver has many different paths. The causes of this include reflection, refraction and atmospheric effects. This effect always occurs in the wireless signal transmission and the connections between components that do not match. Non-ideal channel impulse response means that the channel impulse response is not impulse. The receiver signal equals to the convolution of transmitter signal and channel impulse response. Since the channel impulse response is not impulse, a transmitted symbol would be interfered by other transmitted symbols, as shown in Fig. 2-8. This effect always happens at components which have uneven impulse response and fiber induced fiber dispersion [23, 29].
Figure 2-8 The schematic diagram of inter-symbol interference.
2.4.2 Frequency-Selective Fading
Fading means that the single has large attenuation at some of frequencies. This effect caused by partial cancellation of a signal by itself. The signal arrives at the receiver by two different paths. These two paths have same amplitude response and 180 degree difference phase response. At receiver side, the combination signal would disappear due to disruptive interference. In 60 GHz RoF systems, fading always may be due to multipath propagation or due to fiber dispersion. A good example is shown in Fig. 2-5, where a carrier frequency of 60.5 GHz is chosen, resulting in the huge deep occurs after 1 km fiber transmission [26].
2.4.3 I/Q Imbalance
For the vector signal generation, the generator needs I/Q modulator to up-convert the in-phase (I) and quadrature phase (Q) signals. Since the I and Q data go through different paths, the amplitude and phase imbalance would contribute an additional interfering component at image frequency and induce signal performance degradation, as shown in Fig. 2-9. Due to the 7-GHz wide signal at 60 GHz band, different frequency has different imbalance coefficient. Therefore, it is difficult to maintain the I/Q balance at every frequency by using time domain compensation algorithm. Therefore, an adaptive I/Q imbalance correction scheme in frequency domain is needed to compensate the wideband signal. , k l
R
, k lR
* , , k l k lC
R
* , , k l k lC
R
, k lR
, k lR
Figure 2-9 The schematic diagram of I/Q imbalance.
2.4.4 Peak-to-Average Power Ratio
Peak-to-Average Power Ratio (PAPR) is calculated from the peak amplitude of the waveform divided by the average power of the waveform [48]. If waveforms have same average power, high PAPR waveforms which have high peak power compared with low PAPR waveforms, as shown in Fig. 2-10. Since the linear region of system is limited, the high PAPR signals are easily distorted. Due to the large power variation for high PAPR signals, these signals
also induce high quantization noise for the digital-to-analog converter (DAC) and ADC. Since some of components have limited input peak power, the output power for the high PAPR signals is limited. Therefore, the high PAPR signals would degrade system performance.
Figure 2-10 The schematic diagram of PAPR.
2.5 Summary
Optical RF signal generations using an external MZM based on DSB and DSBCS modulation schemes are reliable techniques. The DSB modulation signal undergoes performance fading that restricts the fiber transmission distance due to fiber dispersion. Although DSBCS modulation has been demonstrated to be effective in the millimeter-wave range, it cannot generate vector modulation formats which are of utmost importance in wireless applications. The transmission distance of the 60-GHz wireless signal is dramatically restricted in a small range due to the high path losses. The main propagation phenomenon for 60-GHz signal consists LoS, first and second order reflections. Wireless transmitter and receiver were discussed in this chapter. The impairments of 60-GHz RoF systems are also investigated in this chapter. They include inter-symbol interference, fading, I/Q imbalance, and PAPR.
Chapter 3
DIGITAL MODULATION TECHNIQUES
3.1 Preface
In this chapter, we will give the brief overviews for digital signal techniques. The digital modulation formats including 1: single carrier, 2: orthogonal frequency-division multiplexing (OFDM), 3: single-carrier frequency-domain-equalization (SC-FDE), 4: single-carrier frequency-division multiple access (SC-FDMA), 5: single-carrier frequency-division multiplexing (SC-FDM). The digital signal processing for system impairments including: 1. Adaptive bit-loading algorithm, 2: I/Q imbalance compensation algorithm. This chapter also introduces multiple-input multiple-output (MIMO) technique in 3.4.
3.2 Digital Modulation Formats
3.2.1 Single Carrier
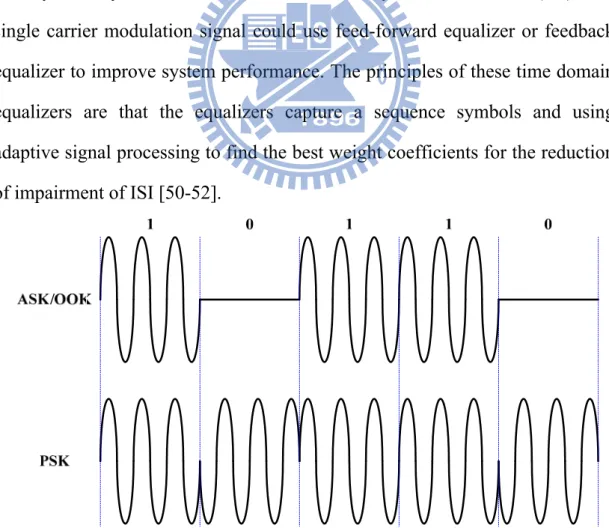
The single carrier modulation is a popular modulation format in digital communication systems. A single carrier system modulates a sequence of digital symbols into a high frequency sinusoidal signal called carrier. The modulated signal has three parameters: frequency, phase, and amplitude. Figure 3-1 shows two basic single carrier modulations with one bit per symbol. They are amplitude-shift keying (ASK) and phase-shift keying (PSK) [41]. The ASK signal with one bit per symbol is also called on-off keying (OOK). The PSK signal with one bit per symbol is also called binary PSK (BPSK). For the BPSK signal, the signal has 180 degree phase different between 1 and 0. The
BPSK signal can be expressed as
cos 2 , for 1
cos 2 cos 2 , for 0 (3-1)
where A and are the amplitude and frequency of carrier signal,
respectively. The BPSK signals can be graphically represented by a constellation diagram. The constellation diagrams only consider the amplitude and phase information of transmitted signal.
The BPSK signal contains only one bit per symbol which is very low spectral efficiency. Modulation format with high spectral efficiency is very important for wireless communication systems. Figure 3-2 shows the constellation diagrams for the PSK, quadrature PSK (QPSK), and 8PSK signals. The QPSK and 8PSK signal have 2 and 3 bits per symbol, respectively. Based on amplitude and phase modulations, a variety of modulation schemes can be derived from their combinations. For example, by modulating both amplitude and phase of the carrier, we can obtain a scheme called quadrature amplitude modulation (QAM). Figure 3-3 shows the constellation diagrams for the 8QAM, 16QAM, and 32QAM signals. The transmitted s(t) can be express as
cos 2π sin 2π (3-2)
where I(t) and Q(t) are the in-phase and quadrature component, respectively. At the receiver, the I(t) and Q(t) can be obtained by multiplying the received signal with cosine and sine signals, respectively.
While transmitting through the channel, the signal suffers distortions, interferences, and noises which may introduce error after demodulation. Therefore, bit-error rate (BER) is the preferred measurement to verify system performance. When the real-time BER measurement is impossible in some of
digital receiver, the BER estimation from the demodulated constellation is very important. The BER of square QAM signal can be related to the signal to noise ratio (SNR):
BER ∙ 1
√ ∙
∙
∙ (3-3)
The SNR can be derived from error vector magnitude (EVM):
SNR = –20 log (EVM/100%) (3-4) The EVM is defined as the noise power from constellation over the signal power from constellation, as shown in Fig. 3-4. The importance of the above equation is that it relates EVM to BER through the SNR. These equations assume that the noise is Additive White Gaussian Noise (AWGN) [41, 49].
By the way, the channel also induces inter-symbol interference (ISI). The single carrier modulation signal could use feed-forward equalizer or feedback equalizer to improve system performance. The principles of these time domain equalizers are that the equalizers capture a sequence symbols and using adaptive signal processing to find the best weight coefficients for the reduction of impairment of ISI [50-52].
Figure 3-2 Signal constellation: (a) BPSK, (b) QPSK, (c) 8-PSK.
Figure 3-4 The principle diagram of error vector magnitude (EVM).
3.2.2 Orthogonal Frequency-Division Multiplexing
Recently, the multicarrier modulations have attracted significant interest because of many advantages [53-56]. One of advantages is that the symbol rate of multicarrier modulations is much lower than single carrier modulations. Thus the effect of ISI will be reduced and the equalization in the demodulation will be easier than single carrier modulation system with high symbol rate. In order to increase data throughput within limited bandwidth, the frequency spacing between subcarriers is set as low as possible. The minimum frequency spacing between subcarriers is equal to the symbol rate, so that all subcarriers are orthogonal to each other and can be separated without using filter in the receiver. This modulation format is called OFDM.
The block diagram of the OFDM transmitter consists of serial-to-parallel conversion, modulation mapping, inverse fast Fourier transform (IFFT), cyclic prefix (CP) insertion, and digital-to-analog converter (DAC), as shown in Fig. 3-5 (a). The serial binary data sequence is firstly transfer to parallel sequence for each subcarrier. The binary data is mapped onto high order modulation symbols that can enhance spectral efficiency. The symbols are
transferred into time domain waveform through an IFFT. After the IFFT operator, the symbols at different subcarriers are assigned to suitable frequencies which are orthogonal each other. Then, a generated single inserts a waveform referred to as a CP. The CP that is a copy of the last part of the block could provide a guard time to prevent ISI.
The block diagram of the typical OFDM receiver is shown in Fig. 3-5 (b). This demodulation process includes synchronization, fast Fourier transform (FFT), equalization, and symbol decoding. After timing synchronization by using training symbols, the FFT operator is used to transfer time domain signal to frequency domain. The channel information can be found from received training symbols. Due to the bandwidth of one subcarrier is fairly narrow for OFDM signals, the equalization can be implemented by just multiplying a value for each subcarrier. This equalization is called one-tap equalization or frequency domain equalization.
Figure 3-5 Block diagrams of OFDM transmitter (a) and receiver (b). (IFFT: inverse fast Fourier transform, DAC: digital-to-analog converter, ADC:
3.2.3 Single-Carrier Frequency-Domain-Equalization
The drawback of OFDM signals is the high peak-to-average power ratio (PAPR). The OFDM signal is the sum of all the subcarriers. If many subcarriers are in phase for some input data, the signal would have high peak power. There are some issues for high PAPR signal. Because the system is not completely linear, the high peak power of a signal would be clipped by the system. Therefore, the high PAPR signals are easily distorted and cause performance degradation. On the other hand, since the high PAPR signals have large power distribution, the signal would suffer more quantization noise and also induce performance degradation. Moreover, some of components limit the peak power of the signal. The system would have less power budget that would limit the transmission length. Due to these reasons, high PAPR become a big issue for the OFDM signal.
The equalizer is needed to compensate ISI that is introduced by the multipath propagation channel. The traditional single carrier signal use conventional time domain equalizers that are not practical for the broadband signal because of the long channel impulse response in the time domain. Therefore, the FDE is more practical for the 60 GHZ systems with broadband channels. The transitional single carrier signal has low PAPR, but without using frequency domain equalization (FDE). If we can combine the advantage of OFDM and single carrier signal, this SC-FDE signal would have higher quality than the OFDM and traditional signal carrier signal. Therefore, the SC-FDE is used in this research [57, 58].
Figure 3-6 shows the basic idea of the time domain equalizer and the FDE. The input signal and channel impulse response are x and h, respectively. The