DOI 10.1007/s11082-005-4188-3
Resolution improvement in optical coherence
tomography with segmented spectrum management
c h i h - w e i l u, m e n g - t s a n t s a i, y i h - m i n g wa n g, y e a n - w o e i k i a n g a n d c . c . y a n g∗
Graduate Institute of Electro-Optical Engineering and Department of Electrical Engineering, National Taiwan University, 1, Roosevelt Road, Section 4, Taipei, Taiwan, R.O.C.
(∗author for correspondence: E-mail: ccy@cc.ee.ntu.edu.tw)
Received 15 February 2005; accepted 15 September 2005
Abstract. We demonstrate resolution improvement in an optical coherence tomography (OCT) system with multiple scans of segmented spectral bands and software signal processing. With an effective spec-tral full-width at half-maximum (FWHM) of 45 nm, centered at 950 nm, we compress the interference fringe FWHM from 31µm down to 7 µm, which is smaller than the theoretical limit of 8.9 µm if a Gaussian spectral shape is assumed, through the combined effect of dispersion compensation and spec-tral shaping. With the amplitude adjustments of the OCT images of the segmented specspec-tral bands, side-lobes can be significantly suppressed with a slight increase of the fringe envelope FWHM. With other amplitude adjustments, the envelope FWHM can be reduced to 5.6µm at the expense of significant side-lobes.
Key words: biophotonics, optical coherence tomograph, dispersion compensation, spectral shaping
1. Introduction
In developing optical coherence tomography (OCT), the axial resolution has been one of the key issues. Because the OCT axial resolution is inversely proportional to the spectral width of the used light source, the generation of broadband light sources has been a topic of great interest (Marks et al. 2002; Kowalevicz et al. 2002; Unterhuber et al. 2003; Wang
et al. 2003). Besides the use of broadband light sources for achieving high
resolution, other efforts are helpful for improving the OCT resolution. Such efforts include dispersion compensation for balancing the group delay dispersion between the reference and sample arms of an OCT system (de Boer et al. 2001; Fercher et al. 2001, 2002; Smith et al. 2002; Marks
et al. 2003; Niblack et al. 2003; Zvyagin et al. 2003). Without dispersion
compensation, the OCT resolution will be degraded. The other means for improving resolution is the spectral shaping technique. Spectral shaping means to modify the spectral intensity and phase distributions for control-ling the time-domain behaviors. It has been widely used for modifying the pulse shape and width (Weiner and Kan’an 1998; Grote and Fouckhardt
for improving the OCT resolution.
In this paper, we report an alternative technique for spectral manage-ment. In this technique, OCT images are first obtained with segmented light source spectra. Then, an appropriate combination of these images of different central wavelengths can result in various results of either higher axial resolution or reduced side-lobe intensity. Such a combination can be dynamically adjusted for different purposes. Also, it can be used for dis-persion compensation. This technique is particularly useful for an OCT system of a large source spectral width. Although the proposed method is somewhat similar to the spectral-domain OCT in concept (Wojtkowski
et al. 2004), it is quite valuable because the time-domain OCT still has
cer-tain advantages over the spectral-domain counterpart. In this paper, we dis-cuss the OCT experimental setup for demonstrating the proposed spectral management technique in Section 2. The spectral management results are presented in Section 3. Several features of the proposed technique are dis-cussed in Section 4. Finally, conclusions are drawn in Section 5.
2. Experimental procedures
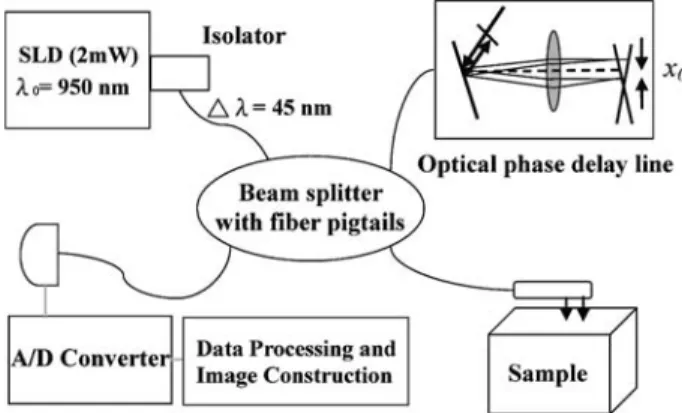
The OCT system setup used for demonstrating the proposed spectral man-agement approach is shown in Fig. 1. A super-luminescence diode (SLD) was used as the light source with the center wavelength at 950 nm and the bandwidth of about 70 nm. However, because of the imperfect isolator used for protecting the SLD, the available spectrum was only 45 nm in full-width at half-maximum (FWHM), which corresponds to a theoretical axial res-olution of 8.9µm if the spectral shape is Gaussian. In the reference arm, an optical phase delay line (OPDL) was used for group- and phase-delay modulations. To match the optical paths between the reference and sample arms, an about 25 cm fiber length difference is required. In this situation, the interference fringe envelope is broadened because of the dispersion mis-match. As shown in Fig. 2, the FWHM of the interference fringe envelope
Fig. 1. Experimental setup of the OCT system.
Fig. 2. Interference fringe without dispersion compensation. The FWHM is about 100µm.
is as large as 100µm. In the proposed approach, we used a spatial filter, located between the lens and the galvanometer optical scanner, for gating different wavelength bands of the light source spectrum (see Fig. 3). We conducted a longitudinal scan with each spectral band. Due to dispersion, the interference fringes of different spectral bands will appear at different longitudinal positions. After properly adjusting the positions and ampli-tudes of the scanning images of various segmented spectral bands, their superposition leads to the results of various spectral management effects.
In our experiment, the focal length of the lens in the OPDL was 10 cm. The grating and galvanometer optical scanner were first placed on the focal planes. With such an arrangement, the FWHM of the interference fringe envelope was 100µm, as shown in Fig. 2. Here, one can observe the chirped interference fringe. To improve the system resolution, we reduce the distance between the lens and the grating to 9 cm. With this arrangement, the FWHM of the interference fringe envelope was reduced to 31µm, as shown in Fig. 4. Because dispersion is not fully compensated, this enve-lope width is still quite large and its shape is asymmetric. The spectral
Fig. 3. The spatial filter inserted between the lens and the galvanometer optical scanner to gate different wavelength bands.
Fig. 4. Interference fringe envelope after decreasing the distance between the grating and the lens in the OPDL. The FWHM is reduced from 100µm to 31 µm.
segmentation is implemented by translating the 1-mm wide spatial filter in the transverse direction to the optical path. Six segmented spectral bands and hence six depth scans were obtained by translating the spatial filter with 700µm in step size. The central wavelengths of the six bands are located at 930 through 980 nm with 10 nm in step size. Each has a FWHM of about 15 nm and a super-Gaussian shape.
3. Experimental results
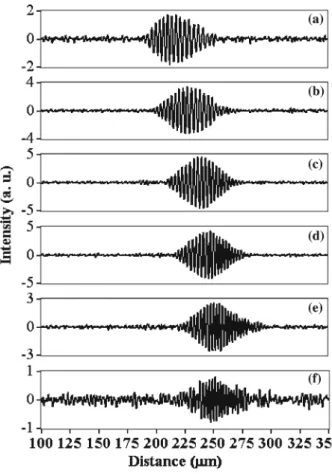
In Fig. 5, the interference fringe patterns from the six longitudinal scans of a glass surface with the six successive segmented spectral bands are shown. Parts (a)–(f) correspond to the results from the short to the long central wavelength. Here, one can see that the six fringe patterns are located
Fig. 5. The six interference fringes with different segmented spectral bands.
at slightly different positions due to dispersion. The FWHMs of those interference fringe envelopes are all about 27µm, which is close to the theoretical limit of the 15 nm FWHM in a segmented spectral band. This result shows that the dispersion effect is negligible in such a small band-width. It actually justifies the choice of 1 mm for the upper limit of the win-dow width of the spatial filter. If the spatial filter winwin-dow is too small, the available optical power in each segmented spectral band becomes too small to guarantee the sensitivity of the OCT system. Note that the modulation frequencies of the six interference fringes are also different because of their different central wavelengths.
After shifting the positions of the six interference-fringe patterns to align their envelope maxima in the horizontal axis, their summation results in a new one of a smaller envelope width, in which the dispersion mismatch has been significantly compensated. The envelope FWHM is now reduced to 7µm, as shown in Fig. 6. Note that significant side-lobes exist in Fig. 6
with the intensity up to 22.6% of the main peak. The OCT resolution of 7µm is higher than the theoretical limit (8.9 µm) if the spectral shape is Gaussian. The smaller envelope FWHM can be attributed to the larger effective full spectral width, which can be obtained by taking the sum-mation of the six segmented spectral bands, because the two successive bands overlap by 5 nm. In other words, spectral shaping has been effectively implemented. The reduced envelope FWHM was obtained at the expense of significant side-lobes.
Spectral management can also be used for side-lobe suppression. Follow-ing the same procedure as above except that the amplitudes of the six pat-terns in Fig. 5 are multiplied by 0.7, 0.6, 1, 1.2, 1.1, and 0.9 (from parts (a) to (f)), respectively, before the maximum alignment and superposition, we obtain the fringe envelope in Fig. 7. Here, the FWHM is slightly increased to 7.4µm. However, the side-lobes are significantly suppressed. The inten-sities of the side-lobes are now lower than 14.7% of the main peak.
Spectral management can lead to an even more significant envelope FWHM reduction at the expense of more significant side-lobes. Figure 8
Fig. 7. Interference fringe envelope with the side-lobes significantly suppressed after certain spectral shaping.
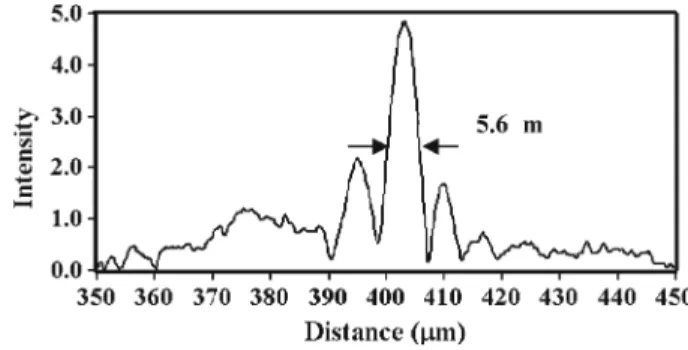
Fig. 8. Interference fringe envelope (reduced to 5.6µm) after the spectral shaping process with another set of parameters.
shows the result by multiplying the amplitudes of parts (a)–(f) in Fig. 5 by 3, 1, 1, 1, 2.5 and 5, respectively, before the maximum alignment and super-position. Now, the FWHM is reduced to 5.6µm. However, the side-lobe intensity becomes as large as 45.3% of the main peak. Such an interference fringe envelope may not be suitable for biomedical diagnosis; however, it can be used for the scanning of a multiple-layer structure, in which only the main peak feature is needed.
4. Discussions
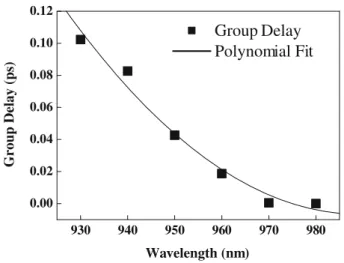
The major cost we need to pay for the system improvement with the proposed spectral management method is the longer imaging time because multiple scans of segmented spectral bands are required. However, it has several advantages as discussed in the following. First, it can be flexibly used for optimizing the effects of improving the OCT resolution or suppressing the side-lobes, depending on the particular scanning need. Second, it can also be used for dispersion compensation. The alignment of the envelope max-ima of parts (a)–(f) in Fig. 5 before superposition means to compensate the dispersion mismatch between the reference and sample arms. In other words, the separations between the six interference fringes represent the group delay differences of the OCT system at various wavelengths. Figure 9 shows the relative group delay data and a curve of quadratic polynomial fitting. With the concave-upward curve, one can read the decreasing trend of nor-mal dispersion with increasing wavelength in this OCT system. The results shown in Figs. 6–8 were obtained through the combined effects of dispersion compensation and spectral shaping.
It is noted that in concept the proposed dispersion management method is somewhat similar to the technique of spectral-domain OCT. Spectral-domain OCT has the advantages of faster scanning, higher signal-to-noise
930 940 950 960 970 980 Wavelength (nm)
Fig. 9. Data of the relative group delay in the OCT system and their quadratic polynomial fit (the con-tinuous curve).
ratio (de Boer et al. 2003), and systematical software dispersion compensation (Wojtkowski et al. 2004). However, so far it still has certain limitations, including the unavailability of arrayed detectors beyond 1µm in wave-length, the sensitivity to sample motion, and the fast drop of signal-to-noise ratio when the path lengths of the sample and reference arms are not exactly matched (Leitgeb et al. 2003). Time-domain OCT with the proposed dispersion compensation method still deserves exploration.
5. Conclusions
In summary, we have demonstrated an alternative approach for spectral management in an OCT system with multiple scans of segmented spectral bands and software signal processing. With an effective spectral FWHM of 45 nm, centered at 950 nm, we compressed the interference fringe FWHM from 31µm down to 7 µm, which was smaller than the theoretical limit of 8.9µm if a Gaussian spectral shape was assumed, through the com-bined effect of dispersion compensation and spectral management. With the amplitude adjustments of the OCT images of the segmented spectral bands, side-lobes could be significantly suppressed with slight degradation of axial resolution. With other amplitude adjustments, the fringe-envelope FWHM was reduced to 5.6µm at the expense of more significant side-lobes.
Acknowledgement
This research was supported by National Health Research Institute, The Republic of China, under the grant of NHRI-EX93-9220EI.
References
de Boer, J.F., C.E. Saxer and J.S. Nelson. Appl. Opt. 40 5787, 2001.
de Boer, J.F., B. Cense, B.H. Park, M.C. Pierce, G.J. Tearney and B.E. Bouma. Opt. Lett. 28 2067, 2003.
Fercher, A.F., C.K. Hitzenberger, M. Sticker, R. Zawadzki, B. Karamata and T. Lasser. Opt. Exp. 9 610, 2001.
Fercher, A.F., C.K. Hitzenberger, M. Sticker, R. Zawadzki, B. Karamata and T. Lasser. Opt. Comm. 204 67, 2002.
Grote, R. and H. Fouckhardt. Opt. Exp. 8 328, 1999.
Hsu, I.J., C.W. Sun, C.W. Lu, C.C. Yang, C.P. Chiang and C.W. Lin. Appl. Opt. 42 227, 2003. Kowalevicz, A.M., T. Ko, I. Hartl and J.G. Fujimoto. Opt. Exp. 10 349, 2002.
Leitgeb, R., C.K. Hitzenberger and A.F. Fercher. Opt. Exp. 11 889, 2003. Marks, D.L., A.L. Oldenburg and J.J. Reynolds. Opt. Lett. 27 2010, 2002.
Marks, D.L., A.L. Oldenburg, J.J. Reynolds and S.A. Boppart. Appl. Opt. 42 204, 2003. Niblack, W.K., J.O. Schenk, B. Liu and M.E. Brezinski. Appl. Opt. 42 4115, 2003. Smith, E.D.J., A.V. Zvyagin and D.D. Sampson. Opt. Lett. 27 1998, 2002. Takeoka, M., D. Fujishima and F. Kannari. Opt. Lett. 26 1592, 2001.
Tripathi, R., N. Nassif, J.S. Nelson, B.H. Park and J.F. de Boer. Opt. Lett. 27 406, 2002. Unterhuber, A., B. Povazay, B. Hermann, H. Sattmann and W. Drexler. Opt. Lett. 28 905, 2003. Wang, Y., Y. Zhao, J.S. Nelson and Z. Chen. Opt. Lett. 28 182, 2003.
Weiner, A.M. and A.M. Kan’an. IEEE J. Select. Top. Quan. Electron. 4 317, 1998.
Wojtkowski, M., V.J. Srinivasan, T.H. Ko, J.G. Fujimoto, A. Kowalczyk and J.S. Duker. Opt. Exp. 12 2404, 2004.