Contents lists available atScienceDirect
Physica A
journal homepage:www.elsevier.com/locate/physa
Concurrent sympathetic activation and vagal withdrawal in
hyperthyroidism: Evidence from detrended fluctuation analysis of heart
rate variability
Jin-Long Chen
a,b, Yuo-Hsien Shiau
c, Yin-Jiun Tseng
d, Hung-Wen Chiu
e, Tzu-Chien Hsiao
f,
Niels Wessel
b,g, Jürgen Kurths
g,h, Woei-Chyn Chu
d,∗aDepartment of Medical Informatics, Tzu Chi University, Hualien, Taiwan bInstitute of Physics and Astronomy, University of Potsdam, Potsdam, Germany cGraduate Institute of Applied Physics, National Chengchi University, Taipei, Taiwan dInstitute of Biomedical Engineering, National Yang-Ming University, Taipei, Taiwan eGraduate Institute of Medical Informatics, Taipei Medical University, Taipei, Taiwan fDepartment of Computer Science, National Chiao Tung University, Hsinchu, Taiwan gInstitute of Physics, Humboldt University, Berlin, Germany
hPotsdam Institute for Climate Impact Research, Potsdam, Germany
a r t i c l e i n f o
Article history:
Received 29 August 2009 Available online 13 January 2010
Keywords:
Hyperthyroidism Autonomic nervous system Heart rate variability Detrended fluctuation analysis Nonlinear dynamics
a b s t r a c t
Despite many previous studies on the association between hyperthyroidism and the hy-peradrenergic state, controversies still exist. Detrended fluctuation analysis (DFA) is a well recognized method in the nonlinear analysis of heart rate variability (HRV), and it has phys-iological significance related to the autonomic nervous system. In particular, an increased short-term scaling exponentα1 calculated from DFA is associated with both increased sym-pathetic activity and decreased vagal activity. No study has investigated the DFA of HRV in hyperthyroidism. This study was designed to assess the sympathovagal balance in hyper-thyroidism. We performed the DFA along with the linear analysis of HRV in 36 hyperthy-roid Graves’ disease patients (32 females and 4 males; age 30±1 years, means±SE) and 36 normal controls matched by sex, age and body mass index. Compared with the normal controls, the hyperthyroid patients revealed a significant increase (P<0.001) inα1 (hy-perthyroid 1.28±0.04 versus control 0.91±0.02), long-term scaling exponentα2(1.05±
0.02 versus 0.90±0.01), overall scaling exponentα (1.11±0.02 versus 0.89±0.01), low frequency power in normalized units (LF%) and the ratio of low frequency power to high frequency power (LF/HF); and a significant decrease (P < 0.001) in the standard devia-tion of the R–R intervals (SDNN) and high frequency power (HF). In conclusion, hyperthy-roidism is characterized by concurrent sympathetic activation and vagal withdrawal. This sympathovagal imbalance state in hyperthyroidism helps to explain the higher prevalence of atrial fibrillation and exercise intolerance among hyperthyroid patients.
© 2010 Elsevier B.V. All rights reserved. 1. Introduction
Hyperthyroidism is characterized by clinical manifestations that resemble those of a hyperadrenergic state. Moreover, the fact that beta-adrenergic receptor blockers ameliorate these symptoms and signs has further suggested enhanced ∗Corresponding address: Institute of Biomedical Engineering, National Yang-Ming University, 155 Li-Nong St. Sec. 2, Beitou, Taipei 112, Taiwan. Tel.: +886 2 28267025; fax: +886 2 28210847.
E-mail address:[email protected](W.-C. Chu).
0378-4371/$ – see front matter©2010 Elsevier B.V. All rights reserved.
sympathetic activity in hyperthyroidism [1]. This concept is supported by a recent study that disclosed the presence of in-creased 24 h urinary catecholamine excretion in hyperthyroid patients [2]. However, previous studies of the catecholamine metabolism indicated that the plasma levels and secretion rate of catecholamines are normal or even reduced in hyper-thyroidism [3–6]. Proposed possible mechanisms to explain the apparent hyperadrenergic state in hyperthyroidism include enhanced sensitivity of the heart to catecholamines mediated by an increase in the number or affinity of the beta-adrenergic receptors [7,8]; alterations in the quantity of guanine nucleotide-binding proteins [9]; an increase in catecholamine turnover at neural synapses [5,6]; and structural similarities between thyroid hormones and catecholamines [10]. Notwithstanding these possibilities, the notion that hyperthyroidism is associated with an increased sympathetic tone could not be fully ver-ified from these studies. On the other hand, a smaller increase in heart rate induced by atropine during the hyperthyroid state compared with the euthyroid state implied reduced vagal inhibition of heart rate in hyperthyroidism [11,12].
Analysis of the heart rate variability (HRV) provides a non-invasive and sensitive tool for the evaluation of autonomic regulation of the heart [13,14]. In clinical applications, reduced HRV is associated with increased cardiac mortality after acute myocardial infarction [15] and is an early warning sign of diabetic neuropathy among diabetic patients [16,17]. HRV analysis can be categorized into linear and nonlinear methods [14]. Conventionally, the beat-to-beat variation exhibited by the sinoatrial node is analyzed using linear methods. Previous studies have applied the linear analysis of HRV to investigate the autonomic nervous system of hyperthyroid patients; some have disclosed reduced [18–20] or normal [21] vagal activity, whereas others have shown both increased sympathetic and decreased vagal modulation of the heart rate in patients with hyperthyroidism [2,22].
However, multiple nonlinear mechanisms such as sympathetic nerves, vagal nerves, hormones and hemodynamics are involved in the regulation of the heart rate and these affecting factors interact mutually. Consequently, the heart rate regulating system appears to be a possible example where chaos theory can be applied [23,24]. These nonlinear phenomena could affect the genesis of heart rate fluctuation [25] and therefore a nonlinear analysis of HRV would be a more appropriate approach to interpreting the complex phenomena of heart rate dynamics. A recent study using a nonlinear analysis of HRV with the correlation dimension for hyperthyroidism has shown reduced complexity and impaired tolerance to cardiovascular stresses in hyperthyroid patients [26].
Nonlinear analysis of HRV can be quantified using parameters derived from chaos and fractal theory [27]. Detrended fluctuation analysis (DFA) is a nonlinear analysis of HRV [28]. Recent studies have indicated that DFA could be used not only to differentiate various patient groups from normal controls [29,30] but also to stratify high risk patient groups among post-myocardial infarction patients [31,32]. In addition, the short-term scaling exponent
α
1, which is calculated from the DFA, could be related to the state of the autonomic nervous system. An increasedα
1 is associated with concurrent increased sympathetic activity and decreased vagal activity. Conversely, a decreasedα
1 is related to co-activation of both the sympathetic and the vagal components of the autonomic nervous system [33].At present, no study has investigated the DFA of HRV in hyperthyroidism. This study was designed to assess the autonomic nervous system in hyperthyroidism by the nonlinear analysis of HRV with DFA. We hypothesized that the autonomic dys-function in hyperthyroid patients is caused by the joint effect of increased sympathetic activity and decreased vagal activity. 2. Subjects and methods
2.1. Subjects
A group of 36, newly diagnosed, untreated hyperthyroid Graves’ disease patients from the outpatient clinic of a university hospital and a group of 36 healthy normal control subjects were recruited for this study. The hyperthyroid and control groups were matched for sex (32 females and 4 males versus 32 females and 4 males, hyperthyroid versus control), age (30
±
1 versus 29±
1 years, means±
SE) and body mass index (20.7±
0.4 versus 21.
8±
0.
5 kg/
m2). The diagnosis of Graves’ disease was established on the basis of clinical, biochemical, immunological, thyroid scintigraphic scanning and uptake data. Individuals with diabetes, cardiac arrhythmia, cardiovascular disease, pregnancy or those using medication were excluded. The study protocol was approved by the local ethics committee and all participants gave their informed consent. The study was conducted according to the principles of the Helsinki declaration.2.2. Study protocol
The hyperthyroid patients were studied at the time of diagnosis before any medication was administered. For all participants, no alcoholic or caffeine-containing drinks were taken for at least 24 h before the study. The examination was performed in a quiet room during the daytime. Subjects received one-channel electrocardiogram (ECG) measurement for 30 min in the supine position after five minutes rest. During the ECG measurement, the subjects were instructed to fully relax, stay awake, breathe regularly, and not to speak.
2.3. Measurement of the ECG
The acquired analog ECG signals were transformed into digital signals by a 16-bit analog-to-digital converter with a sampling rate of 500 Hz. The digitized ECG signals were processed off-line. First, the R waves were detected and then
artifacts and ectopic beats were eliminated. If the percentage of elimination was
>
5%, the ECG signals were discarded. The time intervals between adjacent R waves were calculated to obtain a series of normal R–R intervals.2.4. Linear analysis of HRV
From the normal R–R interval series, the mean R–R interval, the standard deviation of the R–R intervals (SDNN) and the power spectral parameters were calculated. The power spectral parameters of HRV were computed by the fast Fourier transform algorithm using Welch’s averaged periodogram method as previously described [22]. In brief, total power (TP) (0–0.5 Hz), very low frequency power (VLF) (0–0.04 Hz), low frequency power (LF) (0.04–0.15 Hz) and high frequency power (HF) (0.15–0.5 Hz) were determined by integrating the power spectral density in the respective frequency range. Afterwards, the LF in normalized units (LF%) [
=
100×
LF/(
TP−
VLF)
], HF in normalized units (HF%) [=
100×
HF/(
TP−
VLF)
] and the ratio of LF to HF (LF/HF) were calculated.2.5. Detrended fluctuation analysis of HRV
The DFA algorithm was first proposed by Peng et al. [28]. For a total N beats R–R interval time series, the mean R–R interval was first subtracted from each R–R interval and the integrated R–R interval time series y
(
k)
was calculated asy
(
k) =
kX
i=1
(
RRi−
RRmean),
where RRiis the ith R–R interval and RRmeanis the mean of the entire R–R interval time series. The total N beats integrated R–R interval time series was further divided into boxes of equal length with n beats in each box. In each box, we calculated a
least-squares line to fit the integrated R–R interval time series y
(
k)
. The y coordinate of the straight line segment is denoted by yn(
k)
. This least-squares line is regarded as the trend in each box.Then, we computed the fluctuation F
(
n)
of the integrated R–R interval time series y(
k)
with respect to the least-squares line yn(
k)
by the root-mean-square method:F
(
n) =
v
u
u
t
1 N NX
k=1[
y(
k) −
yn(
k)]
2.
This computation was repeated for all different box lengths, which corresponds to all time scales. Thus, we can observe the relationship between the fluctuation F
(
n)
and the box length n. In general, F(
n)
increases with increasing n. A linear relationship on a double log plot implies a power-law relationship between these two variables. This relationship can be characterized by the slope of the least-squares line fit to the correlation points in the plot of log F(
n)
versus log n. This slope is the scaling exponentα
of the DFA.Due to the frequently observed crossover phenomenon in DFA (the values of the scaling exponents differ for different ranges of time scales) [28,34], the scaling exponents are usually calculated in short time scales (4
≤
n≤
11) as the short-term scaling exponentα
1 and long time scales (n>
11) as the long-term scaling exponentα
2, to describe the different scaling properties in different time scales [30,35]. Additionally, we calculated the overall scaling exponentα
over all time scales to observe the overall correlations.2.6. Assays
Serum T3, T4, free T3 (FT3), free T4 (FT4) and TSH were measured by a luminescent immunoassay (Vitros assay, Ortho-Clinical Diagnostics, UK).
2.7. Statistical analysis
The Mann–Whitney U test was used for comparisons between the hyperthyroid patients and the normal controls. The Wilcoxon signed ranks test was applied for comparisons among DFA parameters in the hyperthyroid patients and in the normal controls. All correlations were computed by Spearman’s correlation coefficient. The level of statistical significance was set at P
<
0.
05. Data were expressed as means±
SE. The data analysis was performed with SPSS for Windows (SPSS, USA).3. Results
Hyperthyroid patients revealed high levels of serum thyroid hormones (T3
:
8.
75±
0.
47 nmol/
L, normal range, 1.49–2.60; T4:
262.
8±
9.
3 nmol/
L, normal range, 71.2–141; FT3:
30.
34±
1.
01 pmol/
L, normal range, 4.26–8.10; FT4:
71.
6±
2.
8 pmol/
L, normal range, 10.0–28.2) and a low level of serum TSH (0.
006±
0.
002 mIU/
L, normal range, 0.465–4.68).0.5 1.5 2.5 3. log n 0.5 1.5 2.5 log F(n) Control Hyperthyroid α 2 = 1.00 α 1 = 1.02 α 1 = 1.39 α 2 = 1.07 5 0 1.0 2.0 3.0 1.0 2.0 3.0
Fig. 1. Plots of log F(n)versus log n with relevantα1 andα2 in a hyperthyroid patient and a normal control subject. The arrows indicate the break points.
1.80 1.60 1.40 1.20 1.00 0.80 0.60 α1 α2 α
Fig. 2. Boxplot for comparisons betweenα1,α2 andαin the hyperthyroid patients. Boxes represent the 75th percentile, median and 25th percentile. Whiskers show the largest and the smallest observed values. Differences were assessed by Wilcoxon signed ranks test (∗∗∗P≤0.001).
Fig. 1compares the plots of log F
(
n)
versus log n in one hyperthyroid patient and one normal control subject. For both subjects, we calculated the slopes of the least-squares fit lines over two regions, separated by a break point, with the slopeα
1 for short time scales andα
2 for long time scales. The hyperthyroid patient revealed greater values of bothα
1 andα
2 compared with those of the normal control. In addition, the hyperthyroid patient exhibited a crossover phenomenon indicated by an arrow inFig. 1. The break point was noted at n=
11–12. Furthermore, significant differences were also noted betweenα
1 andα
2,α
2 andα
, as well asα
1 andα
in the hyperthyroid patients (Fig. 2). However, the crossover phenomenon was not obvious in the normal control subject (Fig. 1). In agreement with this, there was no significant difference between any pair ofα
1,α
2 andα
among normal control subjects (Fig. 3).Next we focus on the comparison of the short time scales in the plots of log F
(
n)
versus log n in one hyperthyroid patient and one normal control (Fig. 1). For both subjects, the correlation points between log F(
n)
and log n approximated to a line. The short-term scaling exponentα
1 was calculated as the slope of the least-squares line fit for the first eight correlation points (corresponding to 4≤
n≤
11). Compared with the normal control subject, the hyperthyroid patient showed a steeper slope of the fit line (Fig. 1). Thus, theα
1 value of the hyperthyroid patient was greater than that of the normal control subject. This was further verified by a significant increase in theα
1 of the hyperthyroid patients compared with the normal control subjects (hyperthyroid 1.28±
0.04 versus control 0.91±
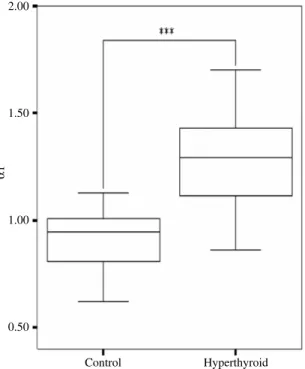
0.02,Fig. 4,Table 1).A comparison between the HRV parameters for the hyperthyroid patients and the normal controls is given inTable 1. For the nonlinear method of HRV analysis with DFA, the hyperthyroid patients revealed a significant increase in
α
1,α
2 andα
compared with the normal controls. The linear HRV parameters SDNN, TP, VLF, LF, HF and HF% were significantly reduced in the hyperthyroid patients. Furthermore, the hyperthyroid patients showed a significant increase in LF% and LF/HF.The correlations between serum thyroid hormone concentrations and DFA parameters of the hyperthyroid patients are presented in Table 2. There was no correlation between
α
1 and the serum thyroid hormone concentrations in the hyperthyroid patients. The long-term scaling exponentα
2 showed significant positive correlations with the serum concentrations of the free form thyroid hormones, FT3 and FT4. In addition, significant positive correlations were observed betweenα
and all of the four thyroid hormone levels in the hyperthyroid patients.1.20 1.10 1.00 0.90 0.80 0.70 0.60 0.50 α1 α2 α
Fig. 3. Boxplot for comparisons betweenα1,α2 andαin the normal control subjects. Boxes represent the 75th percentile, median and 25th percentile. Whiskers show the largest and the smallest observed values. Differences were assessed by Wilcoxon signed ranks test.
2.00 1.50 1.00 0.50 Control Hyperthyroid α1
Fig. 4. Boxplot for comparison ofα1 between hyperthyroid patients and normal controls. Boxes represent the 75th percentile, median and 25th percentile. Whiskers show the largest and the smallest observed values. Difference was assessed by Mann–Whitney U test (∗∗∗
P<0.001).
Correlations of the HRV parameters between the linear analysis and the DFA in the hyperthyroid patients and the normal control subjects are shown inTables 3and4respectively. The short-term scaling exponent
α
1 correlated significantly with LF%, HF% and LF/HF in both hyperthyroid patients and normal control subjects. In the hyperthyroid patients, bothα
2 andα
revealed significant negative correlations with TP, LF and HF. The mean R–R interval correlated significantly with bothα
2 andα
, but not withα
1 in the hyperthyroid patients. For the relationships amongα
1,α
2 andα
, a significant correlation was noted betweenα
2 andα
in both hyperthyroid patients (r=
0.
961, P<
0.
001) and normal controls (r=
0.
863, P<
0.
001). 4. Discussion and conclusionsOur results indicated that
α
1 calculated from the DFA was significantly increased in the hyperthyroid patients compared with the normal controls. This suggests that hyperthyroidism is associated with concurrent increased sympathetic activity and decreased vagal activity.Methods of nonlinear analysis of HRV have been developed to quantify the nonlinear characteristics of the heart rate regulating system. DFA is a modified root-mean-square analysis of a random walk and it quantifies the fractal correlation properties in the R–R interval series. In addition, it can detect the intrinsic self-similarity embedded in the time series [28].
Table 1
Heart rate variability parameters in hyperthyroid patients and normal controls.
Controls (n=36) Hyperthyroid (n=36) P value
RRI (ms) 869±16 609±14 <0.001 SDNN (ms) 54±4 25±2 <0.001 TP (ms2) 1633±318 397±73 <0.001 VLF (ms2) 552±90 245±48 <0.001 LF (ms2) 468±104 113±21 <0.001 HF (ms2) 612±133 38±7 <0.001 LF% (nu) 43.11±1.73 74.95±1.94 <0.001 HF% (nu) 56.89±1.73 25.05±1.94 <0.001 LF/HF 0.81±0.05 4.14±0.49 <0.001 α1 0.91±0.02 1.28±0.04 <0.001 α2 0.90±0.01 1.05±0.02 <0.001 α 0.89±0.01 1.11±0.02 <0.001
Data are means±SE. Differences between means were assessed by Mann–Whitney U test. RRI=mean R–R interval; SDNN=standard deviation of the
R–R intervals; TP=total power; VLF=very low frequency power; LF=low frequency power; HF=high frequency power; LF%=low frequency power in normalized units; HF%=high frequency power in normalized units; LF/HF=ratio of LF to HF;α1=short-term scaling exponent;α2=long-term scaling exponent;α =overall scaling exponent.
Table 2
Correlations between serum thyroid hormone concentrations and parameters of detrended fluctuation analysis of heart rate variability in hyperthyroid patients.
T3 T4 FT3 FT4
α1 −0.036 0.005 −0.225 −0.177
α2 0.246 0.323 0.432** 0.403*
α 0.334* 0.412* 0.484** 0.479**
Correlations were computed by Spearman’s correlation coefficient. FT3=free T3; FT4=free T4;α1=short-term scaling exponent;α2=long-term scaling exponent;α =overall scaling exponent.
*P<0.05; **P<0.01. Table 3
Correlations of heart rate variability parameters between linear analysis and detrended fluctuation analysis in hyperthyroid patients.
RRI SDNN TP VLF LF HF LF% HF% LF/HF
α1 0.099 0.222 0.298 0.276 0.390* −0.034 0.719*** −0.719*** 0.719***
α2 −0.382* −0.153 −0.349* −0.273 −0.473** −0.469** 0.044 −0.044 0.044 α −0.423* −0.206 −0.386* −0.312 −0.476** −0.580*** 0.236 −0.236 0.236 Correlations were computed by Spearman’s correlation coefficient. RRI=mean R–R interval; SDNN=standard deviation of the R–R intervals; TP=total power; VLF=very low frequency power; LF=low frequency power; HF=high frequency power; LF%=low frequency power in normalized units; HF%=high frequency power in normalized units; LF/HF=ratio of LF to HF;α1=short-term scaling exponent;α2=long-term scaling exponent;
α =overall scaling exponent. *P<0.05;
**P<0.01; ***P<0.001. Table 4
Correlations of heart rate variability parameters between linear analysis and detrended fluctuation analysis in normal controls.
RRI SDNN TP VLF LF HF LF% HF% LF/HF
α1 −0.192 −0.080 −0.147 0.015 0.022 −0.338 0.833*** −0.833*** 0.833***
α2 0.068 0.042 −0.057 0.147 −0.197 −0.169 −0.082 0.082 −0.082
α −0.025 −0.105 −0.217 0.102 −0.319 −0.412* 0.188 −0.188 0.188
Correlations were computed by Spearman’s correlation coefficient. RRI=mean R–R interval; SDNN=standard deviation of the R–R intervals; TP=total power; VLF=very low frequency power; LF=low frequency power; HF=high frequency power; LF%=low frequency power in normalized units; HF%=high frequency power in normalized units; LF/HF=ratio of LF to HF;α1=short-term scaling exponent;α2=long-term scaling exponent;
α =overall scaling exponent. *P<0.05;
***P<0.001.
Altered fractal organization of heart rate dynamics evaluated by the DFA has been observed in aging [34], heart failure [29] and angina pectoris [30], as well as before the onset of atrial fibrillation [36], ventricular fibrillation [37], etc. Furthermore, the short-term scaling exponent
α
1 obtained from DFA has been found to be the most powerful predictor of mortality among linear and nonlinear HRV parameters in patients surviving an acute myocardial infarction [31].In the DFA method, a fractal signal (1
/
f noise) results in an exponent value of around 1.0; a completely random,uncorrelated signal (white noise) results in an exponent value of 0.5; and a strongly correlated signal (Brownian noise) results in an exponent value of 1.5 [28,34]. Our finding that both
α
1 andα
2 of the normal control subjects were around1.0 suggests fractal-like signals for the R–R interval series in the normal subjects. This finding is in agreement with previous reports concerning the DFA of heart rate dynamics [30,34,38]. In contrast, there were greater exponent values (
>
1.0) observed in the hyperthyroid patients, which reveals a stronger correlation of heart rate dynamics in these patients compared with the normal controls.Recently, Tulppo et al. have shown that
α
1 increases during both sympathetic activation and vagal withdrawal (cold hand immersion) and decreases during simultaneous sympathetic and vagal activation (cold face test) [33]. Our finding thatα
1 values were increased in the hyperthyroid patients compared with the normal controls suggests concurrent increased sympathetic activity and decreased vagal activity in hyperthyroidism. This result is consistent with recent studies using power spectral analysis of HRV in hyperthyroid patients, where it was found that there was an increase in LF% (reflecting increased sympathetic activity) [22] and LF/HF (denoting the sympathovagal imbalance) [2,18,22]; and a decrease in HF (representing decreased vagal activity) [2,18,22]. This finding might explain the apparent hyperadrenergic manifestations of the hyperthyroid patients. In addition, it also supplies the rationale for the use of beta-adrenergic receptor blockers to reduce these manifestations. In general, the effects of thyroid hormone on the heart can be grouped into three categories: direct cardiac effects of thyroid hormone, effects mediated by the action of thyroid hormone on the autonomic nervous system, and effects secondary to hemodynamic changes. The direct cardiac effects are associated with alterations in T3-mediated gene expression [39]. Our finding that hyperthyroidism is characterized by concurrent sympathetic activation and vagal withdrawal highlights the effects mediated by thyroid hormone’s action on the autonomic nervous system.The prevalence of atrial fibrillation among hyperthyroid patients is higher than that among normal subjects [40–42]. It is known that thyroid hormone affects the action potential duration and repolarization currents in cardiac myocytes through both genomic and nongenomic mechanisms [43]. Despite these known mechanisms, it is not clear how hyperthyroidism predisposes to atrial fibrillation [39]. A combination of genomic and nongenomic actions on atrial ion channels as well as the enlargement of the atrium as a result of the expanded blood volume has been postulated as the underlying causes [39]. However, it is noteworthy that the autonomic nervous system plays an important role in the initiation of atrial fibrillation [44–47]. Recently, increased sympathetic and reduced vagal modulation of the sinus node has been observed to precede the onset of paroxysmal atrial fibrillation [48]. Therefore, the concurrent sympathetic activation and vagal withdrawal in hyperthyroidism might explain the increased prevalence of atrial fibrillation in these patients.
It is a common observation that hyperthyroid patients are in a state similar to exercise because they both exhibit increased heart rate and stressful physical conditions. In comparing the HRV parameters during moderate exercise and baseline conditions, significant differences have been noted among all these parameters [49]. Of interest, the changes in HRV parameters induced by moderate exercise are the same as those present in hyperthyroid patients, namely a decrease in the mean R–R interval, TP, LF, HF and HF% together with an increase in LF%, LF/HF and
α
1. Based on this novel observation of the similarity of HRV parameters between hyperthyroidism and exercise, it could be reasoned that both hyperthyroidism and exercise are in a state of concurrent sympathetic activation and vagal withdrawal. Many hyperthyroid patients experience exercise intolerance, which has been attributed to a combination of reduced ability to increase cardiac output appropriately and weakness of skeletal and respiratory muscles [50–52]. According to our novel observation, hyperthyroid patients are already in a condition similar to exercise; more exercise may not be tolerated by these patients. This inference could help to explain why hyperthyroid patients manifest exercise intolerance.In the detrended fluctuation analysis of HRV, crossover phenomena are often observed [28,30,34]. This phenomenon describes a situation where the scaling exponent is not always a constant. Instead, the value of the scaling exponent differs for different ranges of scales. A crossover phenomenon is usually due to a change in the correlation properties of the signal over the different time or space scales, or it can be a result of nonstationarities in the signal [53]. We observed the crossover phenomenon in the hyperthyroid patients and, in contrast, this phenomenon was not obvious in the normal control subjects. This observation was further supported by the findings that there were significant differences between
α
1 andα
2 in the hyperthyroid patients but not in the normal controls. Iyengar et al. performed the DFA of HRV to compare elderly healthy subjects with young healthy subjects. They found the crossover phenomenon in the elderly healthy subjects, but it was not obvious in the healthy young subjects [34]. These findings together suggest that pathologic states and aging are associated with the appearance of the crossover phenomenon in the DFA of HRV, namely pathologic states and aging tend to have different scaling properties over different time scales.Additionally, we calculated the overall scaling exponent
α
. Of interest, significant positive correlations were noted betweenα
and the serum levels of thyroid hormones T3, T4, FT3 and FT4 in the hyperthyroid patients. This indicates that althoughα
is a rough estimate of the correlation properties of the R–R interval signal over all time scales, it might partially reflect the degree of severity of the hyperthyroid state in hyperthyroid patients.We found that the short-term scaling exponent
α
1 was significantly correlated with LF%, HF% and LF/HF in both the hyperthyroid patients and the normal control subjects. This correlation has been previously reported for healthy subjects under baseline conditions, during head-up tilt and during exercise [49,54]. On the other hand, bothα
2 andα
revealed a significant negative correlation with TP, LF and HF in the hyperthyroid patients. Therefore, it appears thatα
1 is related to the parameters of normalized units of power in the linear analysis andα
2 together withα
are associated with the parameters of absolute values of power. Though a close relationship between DFA and the spectral analysis of HRV has been proposed mathematically [55], the parameters derived from DFA seem to be able to detect more subtle changes in heart rate dynamics than traditional spectral parameters [56,57]. Moreover, the mean R–R interval did not correlate significantly withα
1 in both hyperthyroid patients and normal controls. This implies thatα
1 is independent of the effect of heart rate.With DFA, we are the first to show that hyperthyroid patients are featured by altered fractal organization of the heart rate dynamics. Further studies can be designed to investigate whether the parameters derived from DFA could be used as the risk stratifers in predicting the recurrence of hyperthyroidism after antithyroid drug treatment in hyperthyroid patients. In conclusion, hyperthyroidism is characterized by concurrent sympathetic activation and vagal withdrawal. This sympathovagal imbalance state in hyperthyroidism helps to explain the higher prevalence of atrial fibrillation and exercise intolerance among hyperthyroid patients.
Acknowledgements
We are grateful to Dr. Ming-Chya Wu for technical assistance and to Ling-Yuh Chen and Tsai-Huey Huang for secretarial assistance. Dr. Jin-Long Chen received a scholarship from the National Science Council (Taiwan) and Deutscher Akademischer Austausch Dienst (German Academic Exchange Service). This study was supported in part by the National Science Council (Taiwan) Grant NSC 95-2627-B-010-010.
References
[1] G.S. Levey, I. Klein, Am. J. Med. 88 (1990) 642.
[2] J. Burggraaf, J.H. Tulen, S. Lalezari, R.C. Schoemaker, P.H. De Meyer, A.E. Meinders, A.F. Cohen, H. Pijl, Am. J. Physiol. Endocrinol. Metab. 281 (2001) E190.
[3] P. Coulombe, J.H. Dussault, P. Walker, Metabolism 25 (1976) 973.
[4] P. Moghetti, R. Castello, F. Tosi, M.G. Zenti, C. Magnani, A. Bolner, L. Perobelli, M. Muggeo, J. Clin. Endocrinol. Metab. 78 (1994) 169. [5] P. Coulombe, J.H. Dussault, J. Letarte, S.J. Simmard, J. Clin. Endocrinol. Metab. 42 (1976) 125.
[6] P. Coulombe, J.H. Dussault, P. Walker, J. Clin. Endocrinol. Metab. 44 (1977) 1185. [7] J.P. Bilezikian, J.N. Loeb, Endocr. Rev. 4 (1983) 378.
[8] S.B. Liggett, S.D. Shah, P.E. Cryer, J. Clin. Invest. 83 (1989) 803.
[9] M.A. Levine, A.M. Feldman, J.D. Robishaw, P.W. Ladenson, T.G. Ahn, J.F. Moroney, P.M. Smallwood, J. Biol. Chem. 265 (1990) 3553. [10] M.B. Dratman, M. Goldman, F.L. Crutchfield, J.T. Gordon, Life Sci. 30 (1982) 611.
[11] D.M. Heimbach, J.R. Crout, Arch. Intern. Med. 129 (1972) 430.
[12] B.C. Maciel, L. Gallo Jr., J.A. Marin Neto, L.M. Maciel, M.L. Alves, G.M. Paccola, N. Iazigi, Clin. Sci. 72 (1987) 239. [13] S. Akselrod, D. Gordon, F.A. Ubel, D.C. Shannon, A.C. Berger, R.J. Cohen, Science 213 (1981) 220.
[14] Task force of the European society of cardiology and the north American society of pacing and electrophysiology, Circulation 93 (1996) 1043. [15] R.E. Kleiger, J.P. Miller, J.T. Bigger Jr., A.J. Moss, Am. J. Cardiol. 59 (1987) 256.
[16] S.C. Malpas, T.J. Maling, Diabetes 39 (1990) 1177.
[17] D.J. Ewing, J.M. Neilson, C.M. Shapiro, J.A. Stewart, W. Reid, Br. Heart J. 65 (1991) 239.
[18] V. Cacciatori, F. Bellavere, A. Pezzarossa, A. Dellera, M.L. Gemma, K. Thomaseth, R. Castello, P. Moghetti, M. Muggeo, J. Clin. Endocrinol. Metab. 81 (1996) 2828.
[19] M. Petretta, D. Bonaduce, L. Spinelli, M.L. Vicario, V. Nuzzo, F. Marciano, P. Camuso, V. De Sanctis, G. Lupoli, Eur. J. Endocrinol. 145 (2001) 691. [20] F. Osman, J.A. Franklyn, J. Daykin, S. Chowdhary, R.L. Holder, M.C. Sheppard, M.D. Gammage, Am. J. Cardiol. 94 (2004) 465.
[21] M.V. Pitzalis, F. Mastropasqua, F. Massari, A. Ciampolillo, A. Passantino, M. Ognissanti, A. Mannarini, D. Zanna, R. Giorgino, P. Rizzon, Int. J. Cardiol. 64 (1998) 145.
[22] J.-L. Chen, H.-W. Chiu, Y.-J. Tseng, W.-C. Chu, Clin. Endocrinol. (Oxf) 64 (2006) 611.
[23] T.A. Denton, G.A. Diamond, R.H. Helfant, S. Khan, H. Karagueuzian, Am. Heart J. 120 (1990) 1419. [24] A.L. Goldberger, Lancet 347 (1996) 1312.
[25] C. Braun, P. Kowallik, A. Freking, D. Hadeler, K.D. Kniffki, M. Meesmann, Am. J. Physiol. Heart Circ. Physiol. 275 (1998) H1577. [26] J.-L. Chen, Y.-J. Tseng, H.-W. Chiu, T.-C. Hsiao, W.-C. Chu, Physiol. Meas. 28 (2007) 427.
[27] N. Wessel, H. Malberg, R. Bauernschmitt, J. Kurths, Internat. J. Bifur. Chaos 17 (2007) 3325. [28] C.-K. Peng, S. Havlin, H.E. Stanley, A.L. Goldberger, Chaos 5 (1995) 82.
[29] K.K. Ho, G.B. Moody, C.-K. Peng, J.E. Mietus, M.G. Larson, D. Levy, A.L. Goldberger, Circulation 96 (1997) 842. [30] T.H. Mäkikallio, T. Ristimäe, K.E. Airaksinen, C.-K. Peng, A.L. Goldberger, H.V. Huikuri, Am. J. Cardiol. 81 (1998) 27.
[31] J.M. Tapanainen, P.E. Thomsen, L. Kober, C. Torp-Pedersen, T.H. Mäkikallio, A.M. Still, K.S. Lindgren, H.V. Huikuri, Am. J. Cardiol. 90 (2002) 347. [32] P.K. Stein, P.P. Domitrovich, H.V. Huikuri, R.E. Kleiger, J. Cardiovasc. Electrophysiol. 16 (2005) 13.
[33] M.P. Tulppo, A.M. Kiviniemi, A.J. Hautala, M. Kallio, T. Seppanen, T.H. Mäkikallio, H.V. Huikuri, Circulation 112 (2005) 314. [34] N. Iyengar, C.-K. Peng, R. Morin, A.L. Goldberger, L.A. Lipsitz, Am. J. Physiol. Regul. Integr. Comp. Physiol. 271 (1996) R1078.
[35] T.H. Mäkikallio, T. Seppanen, K.E. Airaksinen, J. Koistinen, M.P. Tulppo, C.-K. Peng, A.L. Goldberger, H.V. Huikuri, Am. J. Cardiol. 80 (1997) 779. [36] S. Vikman, T.H. Mäkikallio, S. Yli-Mäyry, S. Pikkujämsä, A.M. Koivisto, P. Reinikainen, K.E. Airaksinen, H.V. Huikuri, Circulation 100 (1999) 2079. [37] T.H. Mäkikallio, J. Koistinen, L. Jordaens, M.P. Tulppo, N. Wood, B. Golosarsky, C.-K. Peng, A.L. Goldberger, H.V. Huikuri, Am. J. Cardiol. 83 (1999) 880. [38] A.L. Goldberger, L.A.N. Amaral, J.M. Hausdorff, P.C. Ivanov, C.-K. Peng, H.E. Stanley, Proc. Natl. Acad. Sci. USA 99 (Suppl. 1) (2002) 2466.
[39] I. Klein, S. Danzi, Circulation 116 (2007) 1725.
[40] J. Auer, P. Scheibner, T. Mische, W. Langsteger, O. Eber, B. Eber, Am. Heart J. 142 (2001) 838. [41] L. Frost, P. Vestergaard, L. Mosekilde, Arch. Intern. Med. 164 (2004) 1675.
[42] F. Osman, J.A. Franklyn, R.L. Holder, M.C. Sheppard, M.D. Gammage, J. Am. Coll. Cardiol. 49 (2007) 71. [43] Z.Q. Sun, K. Ojamaa, W.A. Coetzee, M. Artman, I. Klein, Am. J. Physiol. Endocrinol. Metab. 278 (2000) E302. [44] P. Coumel, J. Cardiovasc. Electrophysiol. 7 (1996) 999.
[45] J.-L. Huang, Z.-C. Wen, W.-L. Lee, M.-S. Chang, S.-A. Chen, Int. J. Cardiol. 66 (1998) 275.
[46] C. Dimmer, R. Tavernier, N. Gjorgov, G. Van Nooten, D.L. Clement, L. Jordaens, Am. J. Cardiol. 82 (1998) 22. [47] M. Bettoni, M. Zimmermann, Circulation 105 (2002) 2753.
[48] F. Lombardi, D. Tarricone, F. Tundo, F. Colombo, S. Belletti, C. Fiorentini, Eur. Heart J. 25 (2004) 1242.
[49] M.P. Tulppo, R.L. Hughson, T.H. Mäkikallio, K.E. Airaksinen, T. Seppanen, H.V. Huikuri, Am. J. Physiol. Heart Circ. Physiol. 280 (2001) H1081. [50] J.C. Forfar, A.L. Muir, S.A. Sawers, A.D. Toft, N. Engl. J. Med. 307 (1982) 1165.
[51] G.J. Kahaly, C. Kampmann, S. Mohr-Kahaly, Thyroid 12 (2002) 473.
[52] B.R. Olson, I. Klein, R. Benner, R. Burdett, P. Trzepacz, G.S. Levey, Thyroid 1 (1991) 137. [53] Z. Chen, P. Ivanov, K. Hu, H.E. Stanley, Phys. Rev. E 65 (2002) 041107.
[54] F. Beckers, B. Verheyden, A.E. Aubert, Am. J. Physiol. Heart Circ. Physiol. 290 (2006) H2560. [55] K. Willson, D.P. Francis, Physiol. Meas. 24 (2003) N1.
[56] F. Lombardi, T.H. Mäkikallio, R.J. Myerburg, H.V. Huikuri, Cardiovasc. Res. 50 (2001) 210.