For Review Only
An Intelligent Telecardiology System Using a Wearable and Wireless ECG to Detect Atrial Fibrillation
Journal: Transactions on Information Technology in BioMedicine Manuscript ID: TITB-00225-2009.R2
Manuscript Type: Smart Wearable Devices for Human Health and Protection (Submission Deadline: 30-Jun-09)
Date Submitted by the
Author: 20-Feb-2010
Complete List of Authors: Lin, Chin-Teng; National Chiao Tung University, Brain Recearch Center and Department of Electrial and Control Engineering Chang, Kuan-Cheng; China Medical University Hospital
Lin, Chun-Ling; National Chiao Tung University, Brain Research Center and Department of Electrical and Control Engineering Chiang, Chia-Cheng; National Chiao Tung University, Brain Research Center and Department of Electrical and Control Engineering
Lu, Shao-Wei; National Chiao Tung University, Brain Research Center
Chang, Shih-Sheng; China Medical University Hospital
Lin, Bor-Shyh; National Chiao Tung University, Brain Research Center and Institute of Biophotonics and Imaging Science Liang, Hsin-Yueh; China Medical University Hospital Chen, Ray-Jade; China Medical University Hospital Li, Yuan-De; China Medical University Hospital
Ko, Li-Wei; National Chiao Tung University, Brain Research Center and Department of Electrical Engineering
TIPS: atrial fibrillation, Electrocardiogram (ECG), expert systems, wireless, chronic cardiovascular diseases
For Review Only
Abstract—This study presents a novel wireless, ambulatory,
real-time, and auto-alarm intelligent telecardiology system to improve healthcare for cardiovascular disease, which is one of the most prevalent and costly health problems in the world. This system consists of a light-weight and power-saving wireless electrocardiogram (ECG) device equipped with a built-in automatic warning expert system. This device is connected to a mobile and ubiquitous real-time display platform. The acquired ECG signals are instantaneously transmitted to mobile devices, such as netbooks or mobile phones, through Bluetooth, and then processed by the expert system. An alert signal is sent to the remote database server, which can be accessed by an Internet browser, once an abnormal ECG is detected. The current version of the expert system can identify five types of abnormal cardiac rhythms in real-time, including sinus tachycardia, sinus bradycardia, wide QRS complex, atrial fibrillation (AF), and cardiac asystole, which is very important for both the subjects who are being monitored and the healthcare personnel tracking cardiac rhythm disorders. The proposed system also activates an emergency medical alarm system when problems occur. Clinical testing reveals that the proposed system is approximately 94% accurate, with high sensitivity, specificity, and positive prediction rates for 10 normal subjects and 20 AF patients. We believe that in the future a business-card-like ECG device, accompanied with a mobile phone, can make universal cardiac protection service possible.
Index Terms—Electrocardiogram, atrial fibrillation, expert
systems, mobile, wireless
*Correspondence Author: Li-Wei Ko, email: lwko@mail.nctu.edu.tw C.-T. Lin and K.-C. Chang contributed equally to this work. C.-T. Lin, S.-W. Lu, C.C. Chiang, C.-L. Lin, and L.-W. Ko are with the Brain Research Center and the Department of Electrical Engineering, National Chiao Tung University, Hsinchu 30010, Taiwan, R. O. C.
B.-S. Lin is with the Brain Research Center and the Institute of Biophotonics and Imaging Science, National Chiao Tung University, Hsinchu 30010, Taiwan, R. O. C.
K.-C. Chang, H.-Y. Liang, S.-S. Chang, Y.-D. Lee, and R.-J. Chen are with the China Medical University Hospital, Taichung 40447, Taiwan, R. O. C.
I. INTRODUCTION
ardiovascular disease (CVD) is one of the most prevalent and serious health problems in the world. An estimated 17.5 million people died from CVD in 2005, representing 30% of all deaths worldwide. Based on current trends, over 20 million people will die from CVD by 2015. In 2000, 56% of CVD deaths occurred before the age of 75. However, CVD is becoming more common in younger people with most of those affected now aged between 34 and 65 years [1]. In addition to the fatal cases, at least 20 million people experience non-fatal heart attacks and strokes every year; many requiring continuing costly medical care.
Developed countries around the world continue to experience significant problems in providing healthcare services, including:
- the increasing proportion of elderly, whose lifestyle changes are increasing the demand for chronic disease healthcare services;
- demand for increased accessibility to hospitals and mobile healthcare services, as well as in-home care; - financial constraints in efficiently improving
personalized and quality-oriented healthcare [2].
Though the current trend of centralizing specialized clinics can certainly reduce clinical costs, decentralized healthcare allows the alternatives of in-hospital and out-hospital care, and even further, home healthcare [3]. Rapid developments in information and communication technologies have made it possible to overcome the challenges mentioned above and to provide a changing society with an improved quality of life and medical services.
Atrial fibrillation (AF) is the most common cardiac arrhythmia, affecting nearly 1% of the population. Its prevalence increases with age; although relatively infrequent in those under 40 years old, it occurs in up to 5% of those over 80.
Most people with a normal sinus rhythm have a resting
An Intelligent Telecardiology System Using a
Wearable and Wireless ECG to Detect Atrial
Fibrillation
Chin-Teng. Lin, Fellow, IEEE, Kuan-Cheng Chang, MD, Chun-Ling Lin,Chia-Cheng Chiang, MD, Shao-Wei Lu, Shih-Sheng Chang, MD, Bor-Shyh Lin, Hsin-Yueh Liang, MD, Ray-Jade
Chen, MD, Yuan-Teh Lee, MD, and Li-Wei Ko*, Member, IEEE
C
3 4 5 6 7 8 9 10 11 12 13 14 15 16 17 18 19 20 21 22 23 24 25 26 27 28 29 30 31 32 33 34 35 36 37 38 39 40 41 42 43 44 45 46 47 48 49 50 51 52 53 54 55 56 57 58 59 60For Review Only
heart rate of between 60 and 100 beats per minute. In AF patients, the atria contract rapidly and irregularly at rates between 400 to 800 beat per minute. Fortunately, the atrioventricular node compensates for this activity; only about 1 or 2 out of 3 atrial beats pass to the ventricles [8]. A typical ECG in AF shows a rapid irregular tachycardia in which recognizable P waves are sometimes absent [10]. The ventricular rate in patients with untreated AF is generally 110 to 180 beats per minute. However, slower ventricular rates may occur in elderly patients with untreated AF.
Data from the Framingham study [12] demonstrates that chronic heart failure is associated with a 4.5-fold increase of risk of AF in men and a 5.9-fold increase in women. Apart from the epidemiological data, most evidence on the prevalence of AF in heart failure patients stems from analysis of a number of clinical trials conducted within the last 10–15 years on populations with heart failure.
AF might have no detectable CVD. Hemodynamic
impairment and thromboembolic events related to AF patients included in these trials were selected for different purposes, which are reflected in the varying prevalence of AF. In addition, AF, often associated with structural heart disease, causes significant morbidity, mortality, and healthcare cost in a substantial proportion of patients, making it a major global healthcare challenge [4]. In this study, we attempted to develop an intelligent expert system with a built-in abnormal ECG detection mechanism in the telecardiology healthcare service to facilitate diagnosis and management of patients with AF and other rhythm disorders. Simplicity, reliability, and universality are the main concepts behind this service. So this study constructs a ubiquitous and intelligent telecardiology healthcare network consisted of a miniature wireless ECG device embedded an alert expert system for the early detection of cardiac disorders.
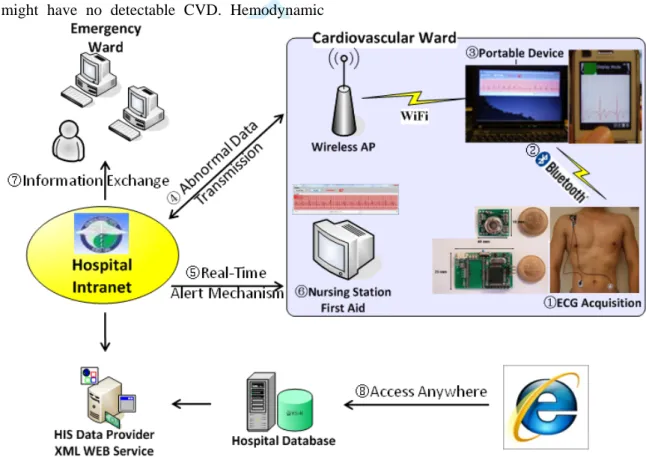
Fig. 1. System flowchart of the proposed intelligent telecardiology healthcare system
The system covers a three-lead wireless ECG acquisition device, a JAVA-based expert system in the portable device and a web-based monitoring window allowing access to the data server and plot in real-time by using an IE browser. Step ①: attach the device on body by disposable electrodes and acquire data. Step ②: Bluetooth connects between the ECG and the portable device. Step ③: The JAVA-based application shows a real-time plot and computes data every 6 seconds. Step ④: Abnormal data is detected by the expert system and transmitted through WiFi/3G/2G. Step ⑤: A non-delayed alert message is sent to a nursing station in a cardiovascular ward. Step ⑥: Emergency treatment can be administered. Step ⑦: Information is exchanged through the intranet from other departments. Step ⑧: The web-based monitoring system gives universal telehealth
3 4 5 6 7 8 9 10 11 12 13 14 15 16 17 18 19 20 21 22 23 24 25 26 27 28 29 30 31 32 33 34 35 36 37 38 39 40 41 42 43 44 45 46 47 48 49 50 51 52 53 54 55 56 57 58 59 60
For Review Only
II. Intelligent Telecardiology System
Telecardiology applications can be categorized in pre-hospital, in-hospital, and post-hospital stages. The pre-hospital stage detects CVD and transmits the information to emergency service providers before the patient arrives at the hospital. An in-hospital healthcare system helps medical staff to supervise the inpatients and provide suitable treatments at the right time. Finally, the main purpose of the post-hospital stage is outpatient follow-up monitoring and treatment to assure a favorable prognosis [6]. All these stages of diseases management can be assisted by a ubiquitous wireless sensor network (WSN) telehealth system, avoiding unnecessary hospitalization, rationalizing healthcare life costs, and providing a safe and effective way to improve life quality. The main objectives in constructing an integrated intelligent telecardiology system include easy manipulation, reliable results, and rapid communication. The system proposed in this study uses a three-lead wireless ECG device, a JAVA-based expert system application, and a web-based monitoring platform to meet these objectives. A small, three-lead ECG device is first set up using disposable button electrodes (Medi-Trace 200, Kendall) affixed to areas on the user’s body (Fig. 1, Step①). This light-weight ECG can be connected to portable devices, such as a notebook or mobile phone, using Bluetooth (Fig. 1, Step②). A JAVA-based GUI application installed on a notebook or mobile phone can then initiate data recording and data transmission.
Successive data are transmitted to a portable device and processed in a period of six seconds by an expert system built in the JAVA application (Fig. 1, Step③). A lead II signal, coordinated with the direction of cardiac conduction pathway from top right to bottom left, is extracted for signal analysis. As long as an abnormal ECG signal was detected, the system automatically transmitted data over a WiFi/3G/2G networks to a remote data server (Fig. 1, Step④). At the same time, the system will send out an alert message to a nursing station in the cardiovascular ward for further examination (Fig. 1, Step
⑤ and ⑥). If necessary, the emergency ward or other departments can also access this data through an intranet (Fig. 1, Step ⑦). With the convenience of the World Wide Web protocol, anyone, including physicians, nurses, and family members, can access the data server and monitor real time ECG plots using a web browser, such as Internet Explorer (IE) (Fig. 1, Step⑧).
For patients admitted to a cardiovascular ward or intensive care unit (ICU), the proposed cardio-healthcare system provides greater freedom of movement than products currently on the market. Paring light-weight
wireless ECG devices with mobile phones offers continuous and reliable patient monitoring. A warning system is also activated when unstable ECGs appear.
The integration of real time transmission and the expert system allows this telecardiology system to not only be applied to inpatients, but also to normal subjects as a health monitor. This system might also be able to replace the 24-hour Holter monitor for longer monitoring and real-time detection.
III.WIRELESS ECGDEVICE
The proposed three-lead ECG device contains two main parts: the data acquisition unit and the wireless transmission unit. This study is based on our previous research on a wearable and wireless brain-computer interface [7]. The whole system size measures about 90 x 35 x 15 mm, and looks similar to a business card. An additional feature of the proposed portable device is its tunable gain and bandwidths.
A. Data Acquisition Unit
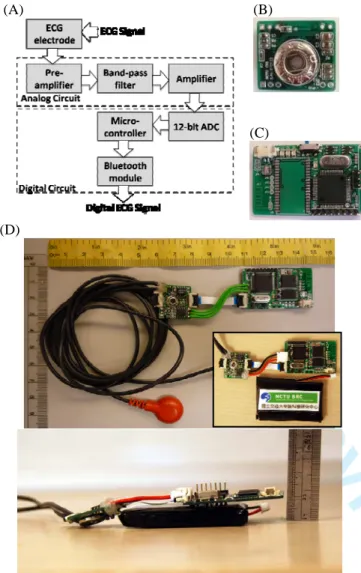
The data acquisition unit integrates an analog preamplifier, filter, and an analog-to-digital converter (ADC) into a small (20 x 18 mm2), lightweight, and battery-powered data acquisition system (DAQ) (Fig. 2B). The ECG signal is sampled at 512 Hz with 12-bit resolution, amplified by 100 times, and band-pass filtered between 1 to 150 Hz (Fig. 2A). To reduce the number of wires for high-density recordings, the power, clocks, and measured signals are daisy-chained from one node to another with bit-serial output. Therefore, adjacent nodes (electrodes) are connected together to (1) share the power, reference voltage, and ADC clocks, and to (2) daisy chain the digital signal outputs.
B. Wireless Transmission Unit
The wireless-transmission unit consists of a wireless module and a micro-controller. This unit uses a Bluetooth module to send the acquired ECG signals to a custom real-time DSP unit or a Bluetooth-enable mobile phone serving as a real-time signal-processing unit. The wireless transmission circuit (as shown in Fig. 2C) measures 40 x 25 mm2. Figure 2D shows a picture of the integrated three- limb lead wireless ECG system. A reference and a ground channel were also included in the system (not shown). The minimal power consumption of the device enables a usage time of up to 33 hours on a single 1100mAh Li-ion battery.
3 4 5 6 7 8 9 10 11 12 13 14 15 16 17 18 19 20 21 22 23 24 25 26 27 28 29 30 31 32 33 34 35 36 37 38 39 40 41 42 43 44 45 46 47 48 49 50 51 52 53 54 55 56 57 58 59 60
For Review Only
(B) (A)
(C)
(D)
All modules included one wireless transmission unit and three DAQs, weighing less than 100g in total. Since the overall power consumption of the whole system is about 29.5 mA, the theoretical maximum running time is estimated at about 33 hours when using an 1100 mAh Li-ion battery. However, when we applied the system to patients, the total running time decreased to slightly over 10 hours with continuous acquisition and transmission of the physiological signal to the expert system. According to cardiologists’ suggestions, the system’s current performance is useful for long-term telemonitoring of certain patients with chronic CVD.
IV.JAVA-BASED SOFTWARE IN AMOBILE SYSTEM
A. QRS Wave Detection Algorithm
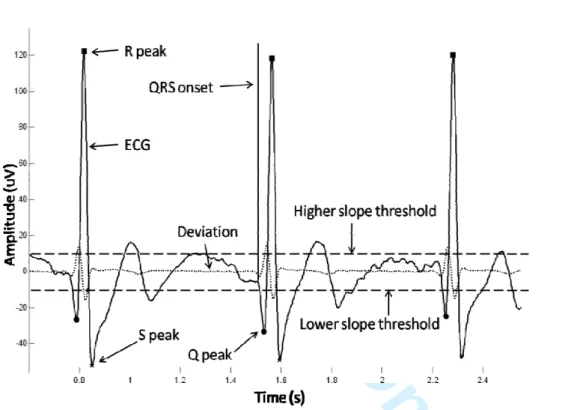
The ECG signals are amplified and recorded with a sampling rate of 512 Hz and band-pass filtered between 1 Hz to 150 Hz. Artifacts were removed before R peak detection. A 50 Hz notch filter is used to eliminate the power line interference, producing high frequency, noise–free, smooth data. Two segments of the baseline signal are extracted to compute mean and standard deviation (SD). Besides, the QRS detector requires the first and second order derivative of the pre-processed ECG signal. The latter gives spikes at the fiducial points. There are also false spikes, but their relative magnitudes are lower than those of the spikes at the fiducial points. Accordingly, the R peak is clipped by higher magnitude negative peaks and high positive peaks in the first derivative plot (Fig. 3). The procedure of defining the QRS complex [8] onset is as follows: after 256 ms of flat segment in the ECG, the first sample, where the slope becomes steeper (high positive peaks) than the higher slope threshold, is defined as the QRS onset. The lower slope threshold is used to detect the higher magnitude negative peaks. Both thresholds are updated to search for missing beats. After identifying the QRS onset, the R peak is labeled by searching for the maximal value of the ECG samples in the 36 ms following the QRS onset [8].
When R peak is determined, the QRS detector searches forward and backward to identify the two most negative points on the ECG plot and labels them as the Q wave peak and the S wave peak, respectively. The QRS complex duration is set from QRS onset time to 20 ms after the S wave peak [9].
B. Expert System on abnormal ECG Detection
After defining the QRS complex and the Q, R, and S wave peak, we then sought to detect common and important rhythm disorders, including sinus tachycardia,
sinus bradycardia, cardiac assystole, atrial fibrillation,
and wide QRS complex. Sinus tachycardia is detected by the condition of the heart rate > 100 beats per minute, whereas sinus bradycardia refers to a heart rate <60 beats per minute. An asystole indicates the situation of no heart rate. Wide QRS complex occurred as the duration of QRS complex was greater than or equal to 120 ms.
Fig. 2 (A) Block diagram of the wireless ECG device; (B) The 12x18 mm2 data acquisition unit for each electrode; (C) The 40x25 mm2 wireless transmission unit; (D) The integrated circuits of the NCTU three-limb lead ECG acquisition device
3 4 5 6 7 8 9 10 11 12 13 14 15 16 17 18 19 20 21 22 23 24 25 26 27 28 29 30 31 32 33 34 35 36 37 38 39 40 41 42 43 44 45 46 47 48 49 50 51 52 53 54 55 56 57 58 59 60
For Review Only
C. Atrial Fibrillation Detection
Since an irregular rhythm of the QRS complexes is the major feature of AF, the R-R interval (RRI), defined as the interval of neighboring QRS complexes, is an ideal parameter to identify AF. This study uses two different algorithms for AF detection.
Algorithm I:
Step 1: Detection of R waves and marking of R peaks Step 2: Calculation of RRI (the duration of adjoined R
peaks)
Step 3: Calculation of the variation of consecutive RRI (△RRI)
Step 4: Activation of the alarm system when △RRI > 150 ms occurs twice within each 6 seconds of computation
Algorithm II:
Step 1: Detection of R waves and marking of R peaks Step 2: Calculation of RRI (the duration of adjoined R
peaks)
Step 3: Calculation of the variation of consecutive RRI (△RRI)
Step 4: Calculation of the standard deviation of RRI (RRIstd) in each 6-second recording
Step 5: Activation of the alarm system when △RRI > 150 ms occurs twice and RRIstd > 60 ms within
6 seconds of computation
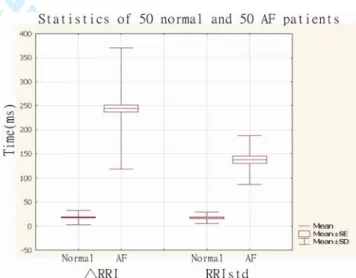
Theoretically, Algorithm I is very sensitive in detecting an irregular ventricular rhythm, yet in the uncommon situation of recording frequent premature beats, the power to differentiate AF from premature beats is impaired. To overcome this potential drawback, we formulated Algorithm II, which uses a cut-off value of RRIstd> 60 ms for AF detection. This criterion reflects the standard deviation of six-seconds’ total RRIs greater than 60 ms, when it alerts. The cut-off value of 60 ms was based on comparing 50 normal subjects’ and 50 AF patients’ RRI measurements in the 12-lead ECGs stored in the MUSE ECG system (GE healthcare, USA) in China Medical University Hospital’s (CMUH) database. Figure 4 demonstrates statistical results of the differences between normal and AF patients regarding △RRI and RRIstd. Accordingly, the thresholds of △RRI and RRIstd were given as 150 ms and 60 ms respectively.
V. CLINICAL TESTING RESULTS
In order to evaluate system performance and sensitivity for AF patient detection, cardiology outpatients were recruited to participate in this study. The diagnosis of AF patients was based on the 12-lead ECG findings of the cardiologists at CMUH.
A. Data Collection
The proposed wireless ECG device was first attached to fixed points on the body. Patients were asked to refrain from body movement or speaking and maintain regular breathing during the 6 minutes of recording. Raw data were recorded by the JAVA-based GUI program installed
Fig. 3 QRS detection in the normal ECG waves. The black curve means the normal ECG signal in which contains three waves. The dotted line shows the first deviation of the normal ECG signal. Results show that full squares mark the R wave peaks, full circles mark the Q wave peaks, and full star mark the S wave peak. QRS onset is defined by the vertical line.
Fig. 4 Statistics of 50 normal and 50 AF patients in (A) △RRI and (B) RRIstd
3 4 5 6 7 8 9 10 11 12 13 14 15 16 17 18 19 20 21 22 23 24 25 26 27 28 29 30 31 32 33 34 35 36 37 38 39 40 41 42 43 44 45 46 47 48 49 50 51 52 53 54 55 56 57 58 59 60
For Review Only
in a netbook and then saved to the hard disk in a TXT format. At the same time, heart rate and the detection results of AF were manually recorded every 6 seconds for AF patients and every 15 seconds for normal subjects.
Patients were divided into two groups according to AF determined algorithms. A total of 10 normal subjects (average age: 71.6 years old, ranging from 57 to 88 years old) and 20 AF patients (average age: 71.4 years old, ranging from 50 to 89 years old) participated in the clinical study. Nursing staff and patient’s family members were allowed to stay with the participants during the recording. The Institutional Review Board (IRB) of CMUH approved all the procedures and measurements.
B. Evaluation of Measurement Accuracy
Comparison and calculation was performed according to the recommendations of the American National Standard for ambulatory ECG analyzers (ANSI/AAMI EC38-1994) [11]. A true positive (TP) indicates that the algorithm successfully detected a true AF episode during every six seconds of computation. On the contrary, a false negative (FN) indicates a failed detection of AF ECG. Finally, false positive (FP) represents a false AF detection whereas true negative (TN) means normal subjects have nothing detected.
Accuracy, Sensitivity and positive predictive values were used for further analysis. The recorded data was shown in Table 1 for normal people and Table 2 & 3 for AF patients under different algorithm testing.
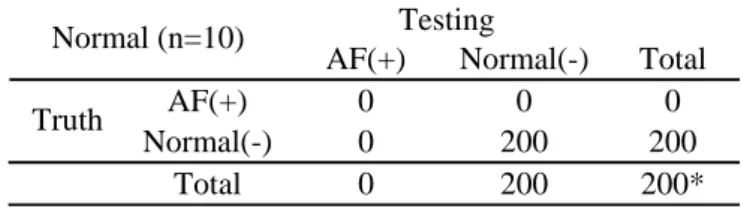
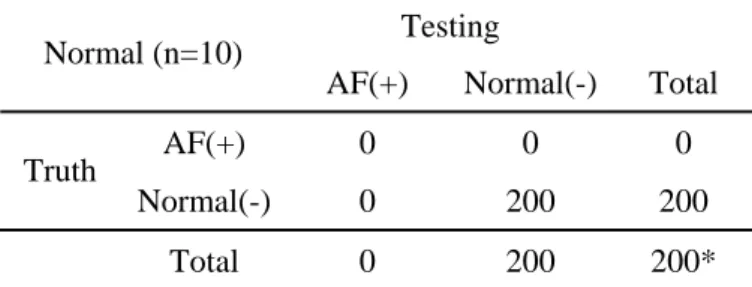
Table 1. Testing results of AF detection in normal subjects (control group)
Testing Normal (n=10)
AF(+) Normal(-) Total AF(+) 0 0 0 Truth
Normal(-) 0 200 200 Total 0 200 200*
* Each subject was tested 20 times (every 15 seconds for a total of 300 seconds). A total of 200 tests were done in 10 subjects.
Table 1 shows the testing performance in the 10 normal subjects. Normal subjects are as the control group in this study. Each diagnostic result was recorded and computed real time per 15 seconds. Totally recording time was 5 minutes. Thus, there were a total of 200 detection trials from the 10 control subjects. We can clearly see that the detecting accuracy is 100% which shows that our detection algorithm works normally on normal subjects and the threshold was set at a reasonable level. It will not occur to the false positive detection.
Twenty patients were tested using Algorithm I, and the
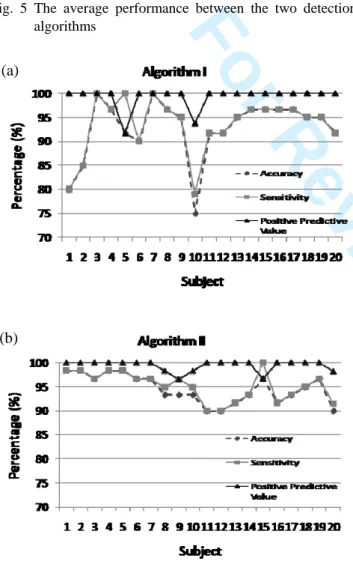
experimental results are shown in Table 2 and Figure 5. As shown in Figure 5, the average accuracy was 92.83%, its sensitivity performance is 93.45%, and the positive predictive value is 99.27%.
The same 20 patients were also tested using Algorithm II, in which AF is detected only when two conditions were met. The average accuracy, sensitivity, and positive predictive performance were 94%, 94.56%, and 99.39%, respectively (as shown in Fig. 5). In comparison with the performance of using algorithms I and II, the performance in Algorithm II were all better than those tested using Algorithm I. These results showed that combining with the two conditions as the detection criteria in Algorithm II will improve the AF detection performance, especially in terms of accuracy and sensitivity performance.
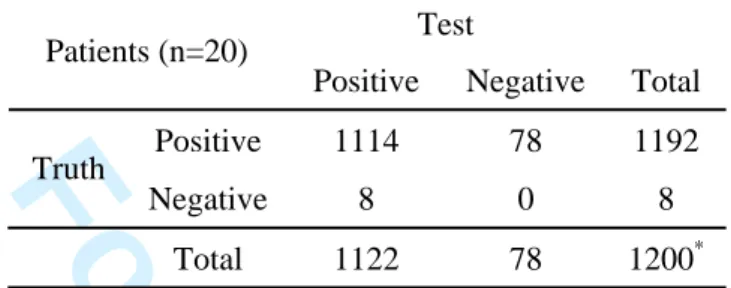
Table 2. Testing results of AF detection in patient group using Algorithm I
Test Patients (n=20)
Positive Negative Total
Positive 1114 78 1192 Truth
Negative 8 0 8 Total 1122 78 1200*
* Each subject was tested 60 times (every 6 seconds for a total of 360 seconds). A total of 1200 tests were done in 20 subjects.
Table 3. Testing results of AF detection in patient group using Algorithm II
Test Patients (n=20)
Positive Negative Total
Positive 1135 58 1193 Truth
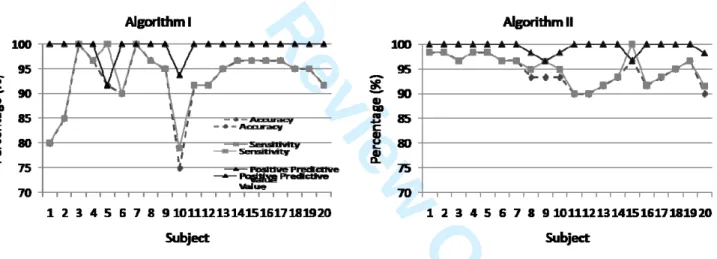
Negative 7 0 7 Total 1142 58 1200 High positive predictive value indicates that △RRI > 150 ms and RRIstd > 60 ms can be the principle parameters for AF detection. In practical clinical diagnosis, medical doctors only use the temporal ECG signals to visually diagnose the AF syndrome as the same as we used in the Algorithm I. According to the performance in Tables 2 and 3, Figures 5 and 6, we fully suggest that the variance of the RRIstd value is also the important indicator for the AF detection which is not easy to recognize the changes via the visual abilities. In addition, it can improve the AF prediction performance. On the other hand, single patient detection performances are also shown in Fig. 6. Among a total of 20 patients, algorithm II displays the stable and high impact results across subjects. The results suggest that our system can provide a reliable AF detection function in telecardiology
3 4 5 6 7 8 9 10 11 12 13 14 15 16 17 18 19 20 21 22 23 24 25 26 27 28 29 30 31 32 33 34 35 36 37 38 39 40 41 42 43 44 45 46 47 48 49 50 51 52 53 54 55 56 57 58 59 60
For Review Only
healthcare services.
Fig. 5 The average performance between the two detection algorithms
Fig. 6 AF detection performance between patients when using Algorithm I (a) and Algorithm II (b)
VI.DISCUSSION AND CONCLUSION
Atrial Fibrillation (AF), the most common sustained cardiac arrhythmia, causes significant mortality and morbidity, and remains a major healthcare challenge. Early detection is very important to providing appropriate
therapeutic interventions and managing disease-related complications, such as congestive heart failure and stroke. This study demonstrates that the proposed intelligent telecardiology system is capable of accurately detecting AF episodes and instantaneously alerting both the user and the healthcare personnel, facilitating early medical intervention. Furthermore, this intelligent telecardiology system is superior to conventional healthcare devices because it integrates all the key elements in one system. The following list describes the most important features of the proposed system:
- wireless: communications between devices are all wireless (Bluetooth / WiFi / 3G / 2G), reducing wire stock usage and allowing convenient operation.
- ambulatory: the miniature ECG device is very light–weight, can easily be applied to the body, and can operate for a considerable length of time. The system can be run anywhere with a notebook or mobile phone, eliminating the problems of limited power or restricted areas.
- real-time: ECG signals can be transmitted to nearby mobile devices instantly and there is only a few seconds lag when the signals are transmitted to a remote database server, depending on network capacity.
- self-alarm: the built-in expert system automatically detects abnormal ECG signals and alerts both the user and healthcare personnel using a mobile phone or by sending a message to a remote database server installed in the hospital computer system and the emergency service system.
This novel system not only can be used for inpatients and outpatients, but also provides a long lasting health monitor to normal people. Patients wearing the light-weight three-limb lead wireless ECG device can hardly feel its presence, but still enjoy a sense of protection.
However, there are several limitations for the expert system. Firstly, AF detection is based on the RRI variation, when the user has frequent atrial or ventricular premature beats, which can be misdiagnosed as AF. Secondly, in patients with AF and markedly impaired AV nodal conduction, RRI variations may become too small for the system to diagnose AF accurately. Lastly, there is still considerable motion noise during the recording, which might impair diagnostic accuracy.
In conclusion, this novel intelligent telecardiology system is capable of early AF detection, and represents a successful first step toward improving efficiency and quality of care in CVD. Further researches aimed at improving both hardware and software designs are necessary to enhance the efficiency and accuracy in future (a) (b) 3 4 5 6 7 8 9 10 11 12 13 14 15 16 17 18 19 20 21 22 23 24 25 26 27 28 29 30 31 32 33 34 35 36 37 38 39 40 41 42 43 44 45 46 47 48 49 50 51 52 53 54 55 56 57 58 59 60
For Review Only
models of this system.
ACKNOWLEDGMENTS
The authors would like to thank C.-J. Chang, Y.-T. Wang in National Chiao Tung University and cardiac nurses in China Medical University Hospital for their great help in performing the clinical experiments. This work was supported in part by the Aiming for the Top University Plan of National Chiao Tung University, the Ministry of Education, Taiwan, under Contract 98W962, in part by the Ministry of Economic Affairs (MOEA), Taiwan, under Contract 97-EC-17-A-03-S1-005, and in part by the National Science Council, Taiwan, under Contracts NSC 97-2220-E-009-052 and 98-2221-E-009 -167.
REFERENCES
[1] The World Health Report 2008. World Health Organization, Geneva, 2008.
[2] S. Koch, “Home telehealth – Current state and future trends,” Int. J. Med. Inform., vol. 75, pp.565-576, 2006.
[3] R. J. Romanow. Building on Values: The future of
healthcare in Canada – Final report. Commission of
the Future of health care in Canada, Ottawa. November 2002. Available:
http://www.cbc.ca/healthcare/final_report.pdf
[4] ACC/AHA/ESC 2006 Guidelines for the Management of Patients With Atrial Fibrillation. J. Am. Coll.
Cardiol., vol. 48, pp. 149-246, 2006.
[5] C. Papaloukas, D. I. Fotiadis, A. Likas, C. S. Stroumbis and L. K. Michalis, “Use of a novel rule-based expert system in the detection of changes in the ST segment and the T wave in long duration ECG.” J. Electrocardiol. vol. 35, no. 1, pp. 27-34, 2002.
[6] G. Vanagas, R. Zaliunas, R. Benetis and R. Slapikas, “Factors affecting relevance of tele-ECG systems application to high risk for future ischemic heart disease events patients group.” Telemed. J. e-Health. vol. 14, no. 4, pp. 345-349, 2008.
[7] C. T. Lin, L. W. Ko, C. J. Chang, Y. T. Wang, C. H. Chung, F. S. Yang, J. R. Duann, T. P. Jung and J. C. Chiou, “Wearable and wireless brain-computer interface and its applications.” 13th Int. Conf. on Human Computer Interface, San Diego, 2009.
[8] J. E. P. Waktare, “Atrial Fibrillation.” Circulation. vol. 106, pp. 41-16, 2002.
[9] L. Pang, I Techoudovski, M. Braecklein, K. Egorouchkina, W. Kellermann and A. Bolz, “Real time ischemia detection in the smart home care system.” Proc.27th Annu. Conf. IEEE Eng. Med. Biol.,
Shanghai, China, September 1-4, 2005
[10] J. Hurst, “Naming of the waves in the ECG, with a brief account of their Genesis.” Circulation, vol. 98, pp. 1937-1942, 1998.
[11] American National Standard for Ambulatory
Electrocardiographs, ANSI / AAMI EC38-1994,
Association for the Advancement of Medical Instrumentation, 1994.
[12] W. B. Kannel and D. L. McGee, “Diabetes and Cardiovascular Disease. The Framingham Study,”
The Journal of American Medical Association, vol.
241, no. 19, pp. 2035-2038, 1979. 3 4 5 6 7 8 9 10 11 12 13 14 15 16 17 18 19 20 21 22 23 24 25 26 27 28 29 30 31 32 33 34 35 36 37 38 39 40 41 42 43 44 45 46 47 48 49 50 51 52 53 54 55 56 57 58 59 60
For Review Only
Reviewer #1: Comments to the Corresponding Author
1. Paper has been greatly improved and comments have been addressed. Figure 3 caption still speaks
about colored curves, which are actually black and white.
Response: Many appreciate the reviewer’s approval on the major revision. And now, in the latest revised
manuscript, we had been modified the Figure 3 caption with black and white colors.
Fig. 3 QRS detection in the normal ECG waves. The black curve means the
normal ECG signal in which contains three waves. The dotted line
shows the first deviation of the normal ECG signal. Results show that
full squares mark the R wave peaks, full circles mark the Q wave
peaks, and full star mark the S wave peak. QRS onset is defined by the
vertical line.
3 4 5 6 7 8 9 10 11 12 13 14 15 16 17 18 19 20 21 22 23 24 25 26 27 28 29 30 31 32 33 34 35 36 37 38 39 40 41 42 43 44 45 46 47 48 49 50 51 52 53 54 55 56 57 58 59 60For Review Only
corresponding patient age ranges.
Response: Many thanks for the reviewer pointing out the mistakes for correction. We have corrected the
erroneous mistakes in this latest revised manuscript. Please see the details in the following.
Original Manuscript:
Patients were divided into two groups according to AF determined algorithms. A total of 10 normal
subjects (average age: 71.6 years old, from 26 to 39 years old) and 20 AF patients (average age: 71.4
years old, from 26 to 39 years old) participated the clinical study.
Revised Manuscript:
Patients were divided into two groups according to AF determined algorithms. A total of 10 normal
subjects (average age: 71.6 years old, ranging from 57 to 88 years old) and 20 AF patients (average age:
71.4 years old, ranging from 50 to 89 years old) participated in the clinical study.
3 4 5 6 7 8 9 10 11 12 13 14 15 16 17 18 19 20 21 22 23 24 25 26 27 28 29 30 31 32 33 34 35 36 37 38 39 40 41 42 43 44 45 46 47 48 49 50 51 52 53 54 55 56 57 58 59 60
For Review Only
Reviewer #2: Comments to the Corresponding Author
1. The authors improved the manuscript in the new version. However, there are still a few issues to be
addressed before publication. As I suggested in the first revision, I think it could be better to have a
different validation. Now you used algorithm I for 10 patients and then algorithm II on the
remaining 10 patients and then compared the results. Especially because the patients’ number is not
very large, your results could be different just because of differences in the patients!! Therefore, I’d
suggest you use algorithm I on all the dataset you have (20 patients) and then use algorithm II on
the same 20 patients again. Then you can correctly compare the results!!!
Response:
Authors many appreciate the reviewer’s comments on the major revision. According to the comment, we
finished the testing performance of all the dataset we have (20 patients) using both algorithms I and II and
then compare the results. Both two algorithms (I and II) were tested on the same 20 patients (average age:
71.4 years old, ranging from 50 to 89 years old). The new testing results in Figures 5 and 6 are showed in
this latest revised manuscript as follows.
Revised manuscript:
Twenty patients were tested using Algorithm I, and the experimental results are shown in Table 2 and
Figure 5. As shown in Figure 5, the average accuracy was 92.83%, its sensitivity performance is 93.45%,
and the positive predictive value is 99.27%.
The same 20 patients were also tested using Algorithm II, in which AF is detected only when two
conditions were met. The average accuracy, sensitivity, and positive predictive performance were 94%,
94.56%, and 99.39%, respectively (as shown in Fig. 5). In comparison with the performance of using
algorithms I and II, the performance in Algorithm II were all better than those tested using Algorithm I.
These results showed that combining with the two conditions as the detection criteria in Algorithm II will
improve the AF detection performance, especially in terms of accuracy and sensitivity performance.
Therefore, we believe that the variance of the RRIstd value is also the important indicator for the AF
3 4 5 6 7 8 9 10 11 12 13 14 15 16 17 18 19 20 21 22 23 24 25 26 27 28 29 30 31 32 33 34 35 36 37 38 39 40 41 42 43 44 45 46 47 48 49 50 51 52 53 54 55 56 57 58 59 60
For Review Only
can improve the AF prediction performance.
Fig. 5 The average performance between the two detection algorithms
Fig. 6 AF detection performance between patients when using algorithm I (left) and algorithm II (right).
2. Section Java-based software on mobile system is number IV and not VI.
Response:
Many thanks for this comment. We have corrected the mistake.
Original Manuscript in page 4:
VI. JAVA-BASED SOFTWARE IN A MOBILE SYSTEM
Revised Manuscript in page 4:
IV. JAVA-BASED SOFTWARE ON MOBILE SYSTEM
3 4 5 6 7 8 9 10 11 12 13 14 15 16 17 18 19 20 21 22 23 24 25 26 27 28 29 30 31 32 33 34 35 36 37 38 39 40 41 42 43 44 45 46 47 48 49 50 51 52 53 54 55 56 57 58 59 60
For Review Only
the condition of the heart rate > 100 beats per MINUTE and not per second (analogously for the
bradycardia)
Response:
Many thanks for this comment. We have corrected the unit of heart rate.
Original Manuscript in page 5:
Sinus tachycardia is detected by the condition of the heart rate > 100 beats per SECOND, whereas sinus
bradycardia refers to a heart rate < 60 beats per SECOND.
Revised Manuscript in page 4:
Sinus tachycardia is detected by the condition of the heart rate > 100 beats per minute, whereas sinus
bradycardia refers to a heart rate <60 beats per minute.
4. Section C, Atrial Fibrillation Detection: I’d suggest you move the part before the definition of the
algorithms in the introduction section, leaving here only one short sentence.
Response:
We appreciate the reviewer’s suggestion. We have rearranged Section C, Atrial Fibrillation Detection. The
importance and description parts of detecting AF have been moved to the introduction section in pages 1 and
2 of the revised manuscript.
Original Manuscript in pages 1 and 2:
Atrial fibrillation is the most common sustained cardiac rhythm disorder, increasing in prevalence with
age. Recent data from the Framingham study [12] indicate that chronic heart failure (CHF) is associated
with a 4.5- and 5.9-fold risk of AF for men and women, respectively. Apart from the epidemiological data,
most evidence on the prevalence of AF in heart failure patients stems from analysis of a number of clinical
trials in heart failure populations conducted within the last 10–15 years.
Revised Manuscript in pages 1 and 2:
Atrial fibrillation (AF) is the most common cardiac arrhythmia, affecting nearly 1% of the population. Its
prevalence increases with age; although relatively infrequent in those under 40 years old, it occurs in up to
5% of those over 80.
3 4 5 6 7 8 9 10 11 12 13 14 15 16 17 18 19 20 21 22 23 24 25 26 27 28 29 30 31 32 33 34 35 36 37 38 39 40 41 42 43 44 45 46 47 48 49 50 51 52 53 54 55 56 57 58 59 60For Review Only
In AF patients, the atria contract rapidly and irregularly at rates between 400 to 800 beat per minute.
Fortunately, the atrioventricular node compensates for this activity; only about 1 or 2 out of 3 atrial beats
pass to the ventricles [8].
A typical ECG in AF shows a rapid irregular tachycardia in which recognizable P waves are sometimes
absent [10]. The ventricular rate in patients with untreated AF is generally 110 to 180 beats per minute.
However, slower ventricular rates may occur in elderly patients with untreated AF.
Data from the Framingham study [12] demonstrates that chronic heart failure is associated with a 4.5-fold
increase of risk of AF in men and a 5.9-fold increase in women. Apart from the epidemiological data, most
evidence on the prevalence of AF in heart failure patients stems from analysis of a number of clinical trials
conducted within the last 10–15 years on populations with heart failure.
AF might have no detectable CVD. Hemodynamic impairment and thromboembolic events related to AF
patients included in these trials were selected for different purposes, which are reflected in the varying
prevalence of AF. In addition, AF, often associated with structural heart disease, causes significant morbidity,
mortality, and healthcare cost in a substantial proportion of patients, making it a major global healthcare
challenge [4].
5. The three tables are not very clear, try to clarify them!
Response:
Many thanks for this important suggestion. We have described more details to clarify the three tables in
the latest revised manuscript and modify the captions of the three tables in the following.
Table 1. Testing results of AF detection in normal subjects (control group) Testing Normal (n=10)
AF(+) Normal(-) Total AF(+) 0 0 0 Truth
Normal(-) 0 200 200 Total 0 200 200*
* Each subject was tested 20 times (every 15 seconds for a total of 300 seconds). A total of 200 tests were done in 10 subjects.
Table 1 shows the testing performance in the 10 normal subjects. Normal subjects are as the control group
3 4 5 6 7 8 9 10 11 12 13 14 15 16 17 18 19 20 21 22 23 24 25 26 27 28 29 30 31 32 33 34 35 36 37 38 39 40 41 42 43 44 45 46 47 48 49 50 51 52 53 54 55 56 57 58 59 60
For Review Only
time was 5 minutes. Thus, there were a total of 200 detection trials from the 10 control subjects. We can
clearly see that the detecting accuracy is 100% which shows that our detection algorithm works normally on
normal subjects and the threshold was set at a reasonable level. It will not occur to the false positive
detection.
Table 2. Testing results of AF detection in patient group using Algorithm I Test Patients (n=20)
Positive Negative Total
Positive 1114 78 1192 Truth
Negative 8 0 8 Total 1122 78 1200*
* Each subject was tested 60 times (every 6 seconds for a total of 360 seconds). A total of 1200 tests were done in 20 subjects.
Table 3. Testing results of AF detection in patient group using Algorithm II Test
Patients (n=20)
Positive Negative Total
Positive 1135 58 1193 Truth
Negative 7 0 7 Total 1142 58 1200
Twenty patients were tested using Algorithm I, and the experimental results are shown in Table 2 and
Figure 5. As shown in Figure 5, the average accuracy was 92.83%, its sensitivity performance is 93.45%,
and the positive predictive value is 99.27%.
The same 20 patients were also tested using Algorithm II, in which AF is detected only when two
conditions were met. The average accuracy, sensitivity, and positive predictive performance were 94%,
94.56%, and 99.39%, respectively (as shown in Fig. 5). In comparison with the performance of using
algorithms I and II, the performance in Algorithm II were all better than those tested using Algorithm I.
These results showed that combining with the two conditions as the detection criteria in Algorithm II will
improve the AF detection performance, especially in terms of accuracy and sensitivity performance.
High positive predictive value indicates that △RRI > 150 ms and RRIstd > 60 ms can be the principle
3 4 5 6 7 8 9 10 11 12 13 14 15 16 17 18 19 20 21 22 23 24 25 26 27 28 29 30 31 32 33 34 35 36 37 38 39 40 41 42 43 44 45 46 47 48 49 50 51 52 53 54 55 56 57 58 59 60
For Review Only
signals to visually diagnose the AF syndrome as the same as we used in the Algorithm I. According to the
performance in Tables 2 and 3, Figures 5 and 6, we fully suggest that the variance of the RRIstd value is also
the important indicator for the AF detection which is not easy to recognize the changes via the visual
abilities. In addition, it can improve the AF prediction performance.
3 4 5 6 7 8 9 10 11 12 13 14 15 16 17 18 19 20 21 22 23 24 25 26 27 28 29 30 31 32 33 34 35 36 37 38 39 40 41 42 43 44 45 46 47 48 49 50 51 52 53 54 55 56 57 58 59 60