Infrared absorption of CH3OSO and CD3OSO radicals produced upon photolysis of
CH3OS(O)Cl and CD3OS(O)Cl in p-H2 matrices
Yu-Fang Lee, Lin-Jun Kong, and Yuan-Pern Lee
Citation: The Journal of Chemical Physics 136, 124510 (2012); doi: 10.1063/1.3696894
View online: http://dx.doi.org/10.1063/1.3696894
View Table of Contents: http://scitation.aip.org/content/aip/journal/jcp/136/12?ver=pdfcov Published by the AIP Publishing
Articles you may be interested in
Infrared absorption of 3-propenonyl (CH2CHCO) radical generated upon photolysis of acryloyl chloride [CH2CHC(O)Cl] in solid para-H2
J. Chem. Phys. 139, 084320 (2013); 10.1063/1.4818880
The dissociation of vibrationally excited CH3OSO radicals and their photolytic precursor, methoxysulfinyl chloride J. Chem. Phys. 134, 194304 (2011); 10.1063/1.3589273
Infrared absorption of CH3SO2 observed upon irradiation of a p-H2 matrix containing CH3I and SO2 J. Chem. Phys. 134, 124314 (2011); 10.1063/1.3567117
Chloroacetone photodissociation at 193 nm and the subsequent dynamics of the CH3C(O)CH2 radical—an intermediate formed in the OH + allene reaction en route to CH3 + ketene
J. Chem. Phys. 134, 054301 (2011); 10.1063/1.3525465
Tunneling chemical reactions in solid parahydrogen: Direct measurement of the rate constants of R + H 2 RH + H ( R = CD 3 , CD 2 H , CDH 2 , CH 3 ) at 5 K
Infrared absorption of CH
3OSO and CD
3OSO radicals produced upon
photolysis of CH
3OS(O)Cl and CD
3OS(O)Cl in
p
-H
2matrices
Yu-Fang Lee,1Lin-Jun Kong,1and Yuan-Pern Lee1,2,a)
1Department of Applied Chemistry and Institute of Molecular Science, National Chiao Tung University, 1001 Ta-Hsueh Rd., Hsinchu 30010, Taiwan
2Institute of Atomic and Molecular Sciences, Academia Sinica, Taipei 10617, Taiwan
(Received 18 January 2012; accepted 2 March 2012; published online 29 March 2012)
Irradiation at 239± 20 nm of a p-H2matrix containing methoxysulfinyl chloride, CH3OS(O)Cl, at 3.2 K with filtered light from a medium-pressure mercury lamp produced infrared (IR) absorption lines at 3028.4 (attributable to ν1, CH2 antisymmetric stretching), 2999.5 (ν2, CH3 antisymmetric stretching), 2950.4 (ν3, CH3 symmetric stretching), 1465.2 (ν4, CH2 scissoring), 1452.0 (ν5, CH3 deformation), 1417.8 (ν6, CH3 umbrella), 1165.2 (ν7, CH3 wagging), 1152.1 (ν8, S=O stretching mixed with CH3rocking), 1147.8 (ν9, S=O stretching mixed with CH3wagging), 989.7 (ν10, C−O stretching), and 714.5 cm−1 (ν11, S−O stretching) modes of syn-CH3OSO. When CD3OS(O)Cl in a p-H2 matrix was used, lines at 2275.9 (ν1), 2251.9 (ν2), 2083.3 (ν3), 1070.3 (ν4), 1056.0 (ν5), 1085.5 (ν6), 1159.7 (ν7), 920.1 (ν8), 889.0 (ν9), 976.9 (ν10), and 688.9 (ν11) cm−1 appeared and are assigned to syn-CD3OSO; the mode numbers correspond to those used for syn-CH3OSO. The assignments are based on the photolytic behavior and a comparison of observed vibrational wavenumbers, infrared intensities, and deuterium isotopic shifts with those predicted with the B3P86/aug-cc-pVTZ method. Our results extend the previously reported four transient IR absorp-tion bands of gaseous syn-CH3OSO near 2991, 2956, 1152, and 994 cm−1 to 11 lines, including those associated with C−O, O−S, and S=O stretching modes. Vibrational wavenumbers of syn-CD3OSO are new. These results demonstrate the advantage of a diminished cage effect of solid p-H2 such that the Cl atom, produced via UV photodissociation of CH3OS(O)Cl in situ, might escape from the original cage to yield isolated CH3OSO radicals. © 2012 American Institute of Physics. [http://dx.doi.org/10.1063/1.3696894]
I. INTRODUCTION
The oxidation of reduced sulfur compounds such as dimethyl sulfide (DMS, CH3SCH3),1 dimethyl disulfide (DMDS, CH3SSCH3), and methanethiol (or methyl mercap-tan, CH3SH), plays an important role in the formation of acid rain and cloud in the atmosphere.2CH
3SO2, existing in three isomeric forms: methylsulfonyl (CH3SO2), methylthio peroxyl (CH3SOO), and methoxy sulfinyl (CH3OSO), has been proposed to be an important intermediate in the oxi-dation of reduced sulfur compounds in the atmosphere.3–5 Although theoretical computations predict that CH3OSO is the most stable among these three isomers, present reports indicate that it is less likely to be produced via direct re-actions involving CH3S with O2 because of a large barrier; photoisomerization from CH3SO2 or CH3SOO might, how-ever, lead to the formation of CH3OSO.6–12 CH3OSO might also play an important role in the combustion of fuels con-taining sulfur species at high temperature, similar to the key role that HOSO plays in the combustion of sulfur-rich fossil fuels.13
According to quantum-chemical computations, two con-formers of CH3OSO are stable, with syn-CH3OSO more sta-ble than anti-CH3OSO by∼8 kJ mol−1. The barrier for con-a)Author to whom correspondence should be addressed. Electronic mail:
[email protected]. FAX: 886-3-5713491.
version from anti-CH3OSO to syn-CH3OSO is only 1−3 kJ mol−1. In comparison with other isomers, syn-CH3OSO is more stable than CH3SO2by 9−56 kJ mol−1 (Refs.6,7,10,
11,12, and14) and CH3SOO by 236−314 kJ mol−1.8,9,12The barrier for isomerization of CH3SO2to CH3OSO is reported to be 98 kJ mol−1(Ref.6) or 166−199 kJ mol−1.9,11,12
Reac-tions of CH3with SO2might proceed via two paths: a nearly barrierless channel to produce CH3SO2and another channel with a barrier 47−58 kJ mol−1to produce anti-CH
3OSO and
syn-CH3OSO.6The reaction of CH3S with O2 is expected to yield mainly CH3SOO, which might subsequently produce CH3SO and other secondary products.14
Gaseous CH3OSO was produced with collisional elec-tron transfer and detected with a neutralization-reionization mass spectrometer by Frank and Turecek.6 The
electron-paramagnetic-resonance spectrum of CH3OSO in the con-densed phase was also reported.15,16 Our laboratory has
em-ployed a step-scan Fourier-transform infrared (FTIR) spec-trometer to detect four transient infrared (IR) absorption bands of gaseous syn-CH3OSO, produced upon irradiation at 248 nm of CH3OS(O)Cl in excess N2 or CO2.17 The intense band near 1152 cm−1was attributed to two overlapping bands at 1154± 3 and 1151 ± 3 cm−1, assigned to the S=O stretch-ing mixed with CH3 rocking (ν8) and the S=O stretching mixed with CH3wagging (ν9) modes, respectively. A second feature at 994± 6 cm−1, with only half of the band observed because of a limitation in the spectral range of the detector,
124510-2 Lee, Kong, and Lee J. Chem. Phys. 136, 124510 (2012)
was assigned to the C−O stretching (ν10) mode. Two weak bands at 2991± 6 and 2956 ± 3 cm−1 were assigned to the CH3 antisymmetric stretching (ν2) and symmetric stretching (ν3) modes, respectively, but the important O−S stretching mode was unobserved because of the limited spectral range of the photovoltaic detector.
The matrix-isolation technique is suitable for further spectral investigation of CH3OSO because the sample can be accumulated over an extended period to increase its ab-sorbance so that weaker lines might be observed. Further-more, because of the small widths of lines and the ab-sence of rotation in matrices because of the low tempera-ture, overlapped bands such as ν8 and ν9 in gaseous syn-CH3OSO might be resolved in the matrix.18,19 The small amount of samples required for matrix-isolation spectroscopy also makes isotopic experiments feasible. For conventional inert-gas matrices, however, the matrix cage effects typi-cally prevent formation of free radicals from the photoly-sis of chloro compounds in situ because the Cl atom can-not escape from the original cage.20 The diminished cage
effect of the quantum solid p-H2 as a matrix host has been demonstrated to allow the production of free radicals via photofragmentation21–24 or bimolecular reactions25–29 upon
UV irradiation. For example, in our laboratory, irradiation with a mercury lamp at 254 nm of a p-H2 matrix containing CH3I and SO2 at 3.2 K followed by annealing of the matrix produced prominent features at 633.8, 917.5, 1071.1, 1272.5, and 1416.0 cm−1that are attributable to ν11(C−S stretching),
ν10 (CH3wagging), ν8 (SO2symmetric stretching), ν7 (SO2 antisymmetric stretching), and ν4(CH2scissoring) modes of CH3SO2, respectively.27 These results demonstrate that the cage effect of solid p-H2 is diminished so that CH3radicals, produced via UV photodissociation of CH3I in situ, might re-act with SO2 to form CH3SO2 during irradiation and upon annealing. The present work on CH3SO2 isolated in a p-H2 matrix extends the previous observation of two transient IR absorption bands of gaseous CH3SO2at 1280 and 1076 cm−1 (Ref.30) to five lines to include the important one associated with the C−S stretching mode.
We have extended the project to matrix-isolated CH3OSO and CD3OSO produced via UV photolysis of a
p-H2 matrix containing CH3OS(O)Cl and CD3OS(O)Cl, re-spectively. Eleven fundamental vibrational modes of syn-CH3OSO, including the C−O, O−S, and S=O stretching modes are characterized.
II. EXPERIMENTS AND COMPUTATIONS
The matrix sample substrate is a gold-plated copper block, cooled to 3.2 K with a closed-cycle refrigerator system (Janis RDK-415); it also serves as a mirror to reflect the in-cident IR beam to the detector.25,31Typically, a gaseous mix-ture of CH3OS(O)Cl/p-H2 (1/300−1/2000, flow rate 14.7− 16.1 mmol h−1) was deposited over a period of 2−6.5 h. IR absorption spectra were recorded with a FTIR spectrom-eter (Bomem, DA8) equipped with a KBr beam splitter and a HgCdTe detector at 77 K to cover the spectral range 450−4100 cm−1. The IR spectrum of the sample at 3.2 K were recorded generally at resolution 0.25 cm−1and averaged
with 600 interferometric scans after each stage of the experi-ment. The IR beam was passed through a filter (2.40ILP-50, Andover Corp.) to block light with wavenumber greater than 4100 cm−1to avoid reaction of Cl with vibrationally excited H2produced after absorption of the IR light.32
A medium-pressure mercury (Hg) lamp (200 W, China Electric, Model H200X) coupled with an interference filter passing either 239± 20 nm or 254 ± 10 nm serves as a source for initial photolysis. Transmission for Hg emission lines near 253.7 and 226.2 nm is∼6.5% and 10.5%, respectively, for the 239 nm filter and∼15% and 0%, respectively, for the 254 nm filter.
Normal H2 (99.9999%, Scott Specialty Gases), after passing through a trap at 77 K, entered a copper cell filled with hydrous iron(III) oxide catalyst (Aldrich) and cooled with a closed-cycle refrigerator (Advanced Research Sys-tems, DE204AF) for p-H2conversion. The efficiency of con-version was controlled by the temperature of the catalyst; the conversion temperature is typically set at 13 K at which the concentration of o-H2is less than 40 ppm.
CH3OS(O)Cl was synthesized33 on slow addition of CH3OH (∼1 g) to equal moles of Cl2SO under stirring, followed by further addition of CH3OH (0.4 g) and stir-ring for 30 min until no bubble was observed. The prod-ucts were stored in a refrigerator at 253 K for a few days for completion of the reaction before being pumped under vacuum at 193 K to remove HCl and SO2. For the syn-thesis of CD3OS(O)Cl, CH3OH was replaced with CD3OH. CH3OH (Absolute Grade, 100.0%, J. T. Baker), CD3OH (iso-topic purity 99.5%, Cambridge Isotope Laboratories), and Cl2SO (>98%, Riedel–de Haën) were used without further purification.
The geometry and vibrational wavenumbers of CH3OSO are well characterized.17,30 In this work, we employed the
GAUSSIAN 09 program to calculate the harmonic and
an-harmonic vibrational wavenumbers, and IR intensities of CH3OSO and CD3OSO with the B3P86 density-functional theory.34 Dunning’s correlation-consistent polarized-valence
triple-zeta basis set, augmented with s, p, d, and f func-tions (aug-cc-pVTZ),35,36 was employed. Harmonic
vibra-tional wavenumbers were calculated analytically at each sta-tionary point. The anharmonic effects were calculated with a second-order perturbation approach using effective finite-difference evaluation of the third and semidiagonal fourth derivatives.
III. EXPERIMENTAL RESULTS
A. Photolysis of CH3OS(O)Cl/p-H2matrices
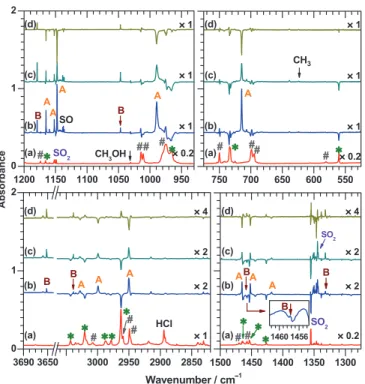
The IR spectrum of a sample of CH3OS(O)Cl/p-H2 (1/500) at 3.2 K is shown in Fig.1(a)for some selected spec-tral regions. Lines at 3043.1, 3020.8, 2987.4, 2978.1, 2962.9, 1464.2, 1453.4, 1426.4, 1234.8, 1223.1, 1166.0, 965.2, 733.7, and 560.1 cm−1are due to CH3OS(O)Cl; those shown in Fig. 1(a)are marked as *. Our experimental observations are consistent with the anharmonic vibrational wavenum-bers predicted for syn-CH3OS(O)Cl, with four intense IR bands at 1231, 970, 709, and 453 cm−1 and some weaker
FIG. 1. (a) Partial IR spectra of a CH3OS(O)Cl/p-H2 (1/500) matrix after
deposition for 3 h (trace a). Lines of CH3OS(O)Cl are marked as * and those
of (CH3O)2SO impurity are marked as #. (b) Difference spectra of the matrix
in (a) after irradiation at 3.2 K and 239± 20 nm for 1.5 h. (c) Difference spectra obtained on further irradiation at 3.2 K and 239± 20 nm for an ad-ditional 1.5 h. (d) Difference spectra obtained on subtracting trace (b) from trace (c). Lines in groups A and B are assigned to syn-CH3OSO and CH2OH,
respectively.
ones at 3036, 3014, 3001, 1472, 1438, 1434, 1144, and 547 cm−1. The observations fit less satisfactorily with anharmonic vibrational wavenumbers predicted for anti-CH3OS(O)Cl with five intense IR bands at 1264, 994, 729, 470, and 445 cm−1 and several weaker ones near 3017, 2994, 2984, 1469, 1453, 1441, and 1165 cm−1. Because
syn-CH3OS(O)Cl is predicted to be more stable than anti-CH3OS(O)Cl by∼8 kJ mol−1and the observed wavenumbers agree with syn-CH3OS(O)Cl better than with anti-CH3OS(O)Cl, these lines are assigned to the syn conformer. The major impurity from synthesis of CH3OS(O)Cl is (CH3O)2SO, which absorbs at 3007.5, 2959.4, 2949.3, 1470.2, 1457.3, 1210.7, 1174.1, 1014.2, 1010.8, 974.7, 750.0, 699.2, 694.8, and 580.4 cm−1, as marked # in Fig. 1(a). These features are similar to lines at 3028.0, 3005.1, 2960.5, 2952.8, 1469.1, 1467.8, 1457.6, 1454.0, 1208.6, 1187.9, 1016.6, 980.1, 748.3, 696.9, and 578.2 cm−1reported for the GT form of (CH3O)2SO in an Ar matrix, but contribu-tions from the GG form cannot be excluded; the latter lines were reported at 3028.0, 3014.5, 3005.1, 2960.5, 2955.1, 1464.5, 1455.7, 1451.3, 1233.2, 1185.4, 1009.7, 972.1, 733.2, 693.8, 688.5, and 578.2 cm−1.37 A line at 1030.7 cm−1 is
due to CH3OH.31 Some weaker lines near 1355.8/1355.4 and 1149.7/1148.7 cm−1 are due to SO2 impurity.27 Lines at 2894.1 and 2892.2 cm−1 are due to HCl.38 Extremely
weak lines at 1246.2 and 497.5 cm−1might be due to Cl2SO, consistent with values 1251 and 492 cm−1reported in the gas phase.39
We found that irradiation of the matrix sample with the medium-pressure Hg lamp produced more intense lines of the CH3OSO product in the initial stage of photolysis when a 239 ± 20 nm filter was used than when a 254 ± 10 nm filter was used, presumably CH3OSO was dissociated with the UV light near 254 nm more readily than near 226 nm. We describe here only experiments with a filter passing light in the region 239 ± 20 nm.
Among various experiments, the following procedure provided the best results for identification of the CH3OSO product: (1) irradiation of the matrix with light near 239 ± 20 nm for 1.5 h, and (2) further irradiation for additional 1.5 h. The matrix was maintained at 3.2 K during the photol-ysis and the recording of spectra.
Upon irradiation of the CH3OS(O)Cl/p-H2 (1/500) ma-trix at 239 ± 20 nm for 1.5 h, lines due to CH3OS(O)Cl (marked * in Fig. 1(a)) and SO2 decreased in intensity, as shown in Fig. 1(b); those of (CH3O)2SO (marked # in Fig. 1(a)), and Cl2SO also decreased slightly. Trace (b) is a difference spectrum recorded upon irradiation near 239 ± 20 nm for 1.5 h after deposition. The difference spectrum was obtained on subtracting the spectrum recorded in the pre-ceding step from that recorded after this step; features point-ing upward thus indicate production, whereas those pointpoint-ing downward indicate destruction. Trace (c) is a difference spec-trum obtained after irradiation near 239± 20 nm for an addi-tional 1.5 h. Some features increased in intensity more in this step, whereas some increased less. To differentiate this behav-ior, we subtracted trace (b) from trace (c), as shown in trace (d). The features pointing upwards in traces (b) and (c) but downwards in trace (d) are associated with species that were produced more in the initial stage and less in the second stage; they are indicated as group A. The features pointing upward in traces (b), (c), and (d) are thus associated with species that were produced more in the second stage than in the first stage; they are indicated as group B.
Lines in group A at 3028.4, 2999.5, 2950.4, 1465.2, 1452.0, 1417.8, 1165.2, 1152.1, 1147.8, 989.7, and 714.5 cm−1 show similar relative intensities in separate stages of various experiments; the line at 1147.8 cm−1 is overlapped with another one at 1147.4 cm−1. These lines are assigned to syn-CH3OSO, to be discussed in Sec.IV A. Lines in group B at 3651.9, 3038.5, 1457.6, 1332.1, 1179.2, and 1047.0 cm−1 have small intensities except the one at 1179.2 cm−1. These features are readily assigned to CH2OH because they have vibrational wavenumbers similar to those reported for CH2OH in an Ar matrix at 3650, 1459, 1334, 1183, and 1048 cm−1, with the latter two being more intense than others.40,41 We also observed a line at 943.8 cm−1 due to atomic Cl (Ref.42) and a line of SO at 1136.2 cm−1.43
After prolonged irradiation, weak lines of CH3, CH3SO2, CH4, ClSO2, and ClSO appeared. CH3 absorbed at 3170.6, 1402.7/1402.3/1401.7, and 624.0 cm−1, consistent with the reports for CH3 of absorption at 3171.6/3171.4 (ν1), 1402.7/1402.4/1401.7 (ν3), and 624.0 (ν2).22,24 CH3SO2 ab-sorbs at 1273.6/1273.0/1272.5 cm−1, similar to the val-ues reported for CH3SO2 produced from the reaction of CH3 + SO2 in a p-H2 matrix.27 Lines of CH4 were ob-served at 3025.9/3025.1 (ν3) and 1308.3 (ν4),21 and lines
124510-4 Lee, Kong, and Lee J. Chem. Phys. 136, 124510 (2012)
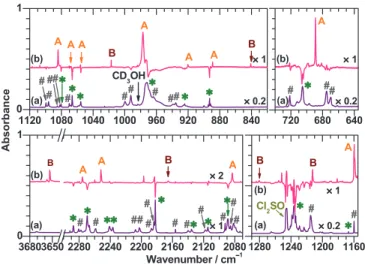
FIG. 2. (a) Partial IR spectra of a CD3OS(O)Cl/p-H2 (1/500) matrix
af-ter deposition for 4 h. Lines of CD3OS(O)Cl are marked as * and those of
(CD3O)2SO impurity are marked as #. (b) Difference spectra of the matrix in
(a) after irradiation at 3.2 K and 239± 20 nm for 1 h. Lines in groups A and B are assigned to syn-CD3OSO and CD2OH, respectively.
at 1299.6/1298.7 and 1104.1/1103.1 cm−1 might be due to ClSO2, consistent with the values 1311.0/1309.6 and 1099.8/1098.2 cm−1 reported for ClSO2 in an Ar matrix.44 ClSO was also observed at 1169.6 cm−1, consistent with 1162.9 cm−1reported in the gaseous phase.45
B. Photolysis of a CD3OS(O)Cl/p-H2matrix
The IR spectrum of a sample of CD3OS(O)Cl/p-H2 (1/500) at 3.2 K is shown in Fig. 2(a). Lines at 2287.4, 2269.6, 2241.0, 2236.6, 2182.1, 2135.7, 2114.6, 2088.8, 1235.9, 1167.0, 1080.4, 1066.4, 1055.6, 971.8, 924.4, 892.7, 705.6, and 541.3 cm−1, as marked * in Fig. 2(a), are due to CD3OS(O)Cl, consistent with the anharmonic vibrational wavenumbers 2280, 2263, 2100, 1234, 1074, 1073, 1044, 967, 919, 887, 688, 530, and 451 cm−1 predicted with the B3P86/aug-cc-pVTZ method. Lines at 2280.6, 2277.3, 2258.5, 2207.7, 2202.5, 2187.0, 2183.9, 2156.3, 2140.1, 2117.9, 2092.6, 2085.5, 2081.9, 1215.1, 1159.9, 1099.5, 1096.3, 1085.2, 1082.0, 1070.1, 999.6, 992.3, 963.9, 940.0, 935.5, 721.4, 675.1, 669.8, and 559.9 cm−1, as marked # in Fig. 2(a), are due to impurity (CD3O)2SO, consistent with the harmonic vibrational wavenumbers at 2349, 2337, 2329, 2304, 2188, 2174, 1247, 1120, 1103, 1081, 1080, 1069, 1065, 1013, 992, 947, 934, 908, 903, 700, 661, and 547 cm−1 predicted with the B3P86/aug-cc-pVTZ method. Line at 983.5 cm−1 is due to CD3OH, consistent with value 988 cm−1reported in the gas phase.46Lines at 1355.8/1355.4 and 1149.7/1148.7 cm−1 are due to SO2 impurity. Lines at 1246.2 and 497.5 cm−1are due to Cl2SO.39
Trace (b) of Fig. 2 shows the difference spectrum of the CD3OS(O)Cl/p-H2(1/500) matrix after irradiation at 239 ± 20 nm for 1 h. Lines due to CD3OS(O)Cl and SO2 de-creased in intensity, and lines in two groups appeared; those due to (CD3O)2SO also decreased slightly. Lines in group A that were assigned to syn-CH3OSO in the CH3 OS(O)Cl/p-H2 experiments shifted to 2275.9, 2251.9, 2083.3, 1159.7,
1085.5, 1070.3, 1056.0, 976.9, 920.1, 889.0, and 688.9 cm−1, as marked A in Fig. 2(a). Those in group B that were as-signed to CH2OH in the CH3OS(O)Cl/p-H2shifted to 3653.6, 2165.9, 1280.5, 1212.9, 1017.1, and 840.7 cm−1.
The ν2band of CH3observed at 624.0 cm−1in Fig.1(b) also shifted to 451.8 cm−1for CD3, similar to values 453 and 463 cm−1observed in solid Ar and Ne, respectively.47,48
IV. DISCUSSION
Gaseous CH3OS(O)Cl at 300 K has an absorption cross section ∼8 × 10⁻¹⁹ cm2 molecule−1 near 248 nm.17 The possible products after photolysis of CH3OS(O)Cl at 239 ± 20 nm are expected to be CH3OSO+ Cl, CH3+ ClSO2, and CH3O + ClSO. According to Alligood et al., only the S−Cl fission channel to produce Cl atom and CH3OSO radical was observed upon photolysis of CH3OS(O)Cl at 248 nm.49 Some vibrationally excited CH
3OSO radicals un-dergo subsequent dissociation to CH3 + SO2. The dissoci-ation threshold to form CH3OSO + Cl is calculated to be 239 kJ mol−1, corresponding to a wavelength of 501 nm.49
With a filter to pass either 239± 20 nm or 254 ± 10 nm, we employed emission from a Hg lamp with the expectation that the light dissociates CH3OS(O)Cl and that the major products are CH3OSO and Cl.
The photolysis of impurities (CH3O)2SO and SO2 must also be considered. The photolysis of (CH3O)2SO at 248 nm was investigated by Alligood et al. who reported the main photodissociation products to be CH3and CH3OS(O)O.49 Al-though SO2has an absorption cross section∼2 × 10⁻¹⁹cm2 molecule−1 at 254 nm (Ref. 50) and ∼3 × 10⁻¹⁹ cm2 molecule−1 at 226 nm,51 its dissociation threshold of 543
kJ mol−1 to form SO + O corresponds to a wavelength of ∼220 nm.52
A. Assignments of lines in group A in the
CH3OS(O)Cl/p-H2experiments tosyn-CH3OSO
Considering that CH3OSO is the expected product of photolysis and that the vibrational wavenumbers of five ob-served lines in group A near 2999.5, 2950.4, 1152.1, 1147.8, and 989.7 cm−1 are similar to the values of 2991± 6, 2956 ± 3, 1154 ± 3, 1151 ± 3, and 994 ± 6 cm−1 reported for gaseous syn-CH3OSO,17we contend that lines in group A are likely due to syn-CH3OSO.
As listed in Table I, quantum-chemical calculations us-ing the B3P86/aug-cc-pVTZ method predict that the IR lines of syn-CH3OSO with intensity greater than 10 km mol−1 have anharmonic vibrational wavenumbers near 2989 (ν2), 2996 (ν3), 1473 (ν4), 1448 (ν5), 1157 (ν7), 1149 (ν8), 1144 (ν9), 995 (ν10), and 698 (ν11) cm−1; some of the values are slightly modified from the previous report.17 Our observed lines in group A at 3028.4, 2999.5, 2950.4, 1465.2, 1452.0, 1417.8, 1165.2, 1152.1, 1147.8, 989.7, and 714.5 cm−1 are within 2.3% of the predicted values. The relative IR inten-sities observed in these experiments are also consistent with the theoretical predictions except those associated with the
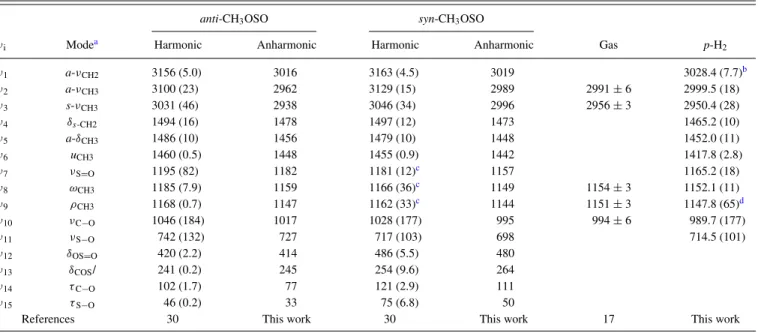
TABLE I. Comparison of harmonic and anharmonic vibrational wavenumbers (in cm−1) and IR intensities (in km mol−1, listed in parentheses) of anti-CH3OSO and syn-CH3OSO derived from experiments and calculations using the B3P86/aug-cc-pVTZ method.
anti-CH3OSO syn-CH3OSO
νi Modea Harmonic Anharmonic Harmonic Anharmonic Gas p-H2
ν1 a-νCH2 3156 (5.0) 3016 3163 (4.5) 3019 3028.4 (7.7)b ν2 a-νCH3 3100 (23) 2962 3129 (15) 2989 2991± 6 2999.5 (18) ν3 s-νCH3 3031 (46) 2938 3046 (34) 2996 2956± 3 2950.4 (28) ν4 δs-CH2 1494 (16) 1478 1497 (12) 1473 1465.2 (10) ν5 a-δCH3 1486 (10) 1456 1479 (10) 1448 1452.0 (11) ν6 uCH3 1460 (0.5) 1448 1455 (0.9) 1442 1417.8 (2.8) ν7 νS=O 1195 (82) 1182 1181 (12)c 1157 1165.2 (18) ν8 ωCH3 1185 (7.9) 1159 1166 (36)c 1149 1154± 3 1152.1 (11) ν9 ρCH3 1168 (0.7) 1147 1162 (33)c 1144 1151± 3 1147.8 (65)d ν10 νC−O 1046 (184) 1017 1028 (177) 995 994± 6 989.7 (177) ν11 νS−O 742 (132) 727 717 (103) 698 714.5 (101) ν12 δOS=O 420 (2.2) 414 486 (5.5) 480 ν13 δCOS/ 241 (0.2) 245 254 (9.6) 264 ν14 τC−O 102 (1.7) 77 121 (2.9) 111 ν15 τS−O 46 (0.2) 33 75 (6.8) 50
References 30 This work 30 This work 17 This work
aν: stretch, δ: bend or deformation, δ
S: scissor, u: umbrella, ω: wag, ρ: rock, τ : torsion, a: antisymmetric, and s: symmetric.
bIntegrated IR intensities relative to ν
10of syn-CH3OSO are listed in parentheses. cFor syn-CH
3OSO, ν7is mainly ωCH3,ν8is νS=O/ρCH3, and ν9is νS=O/ωCH3. dOverlapped with a line at 1147.4 cm−1.
IR intensities of lines associated with the ν7−ν9 modes are likely due to a poor description of the mode mixing for these modes. For anti-CH3OSO, the mode mixing is small and most intensity is with the ν7mode, whereas for syn-CH3OSO, the three modes are mixed, with ν7 approximately described as mainly CH3wagging, ν8as S=O stretching mixed with CH3 rocking, and ν9 as S=O stretching mixed with CH3 wag-ging. All 11 modes predicted to have fundamental vibrational wavenumbers above 500 cm−1, our detection limit, are ob-served in this work with relative intensities similar to predic-tions provides further support for the assignments of these lines in group A to syn-CH3OSO. The assignments of two weak lines observed at 3028.4 and 1417.8 cm−1 should be considered as tentative because the two weak lines predicted at 3019 (ν1) and 1442 (ν6) cm−1for syn-CH3OSO has IR in-tensity less than 5 km mol−1.
Syn-CH3OSO and anti-CH3OSO have similar vibrational wavenumbers, as listed in Table I. In our experiments, only one conformer appears to be observed because the observed lines show no splitting except the doublet at 1147.8 and 1147.4 cm−1. If both conformers were present, the small dif-ferences in vibrational wavenumbers should result in several doublet lines for particular vibrational modes. Although we are unable to exclude positively the possibility of observed lines in group A being assigned to anti-CH3OSO, we think that such an assignment is unlikely for the following reasons. First, theoretical computations predict that syn-CH3OSO is more stable than anti-CH3OSO by ∼8 kJ mol−1 (Refs.6,10, and11); the syn-CH3OSO should be dominant even at 300 K if we assume a Boltzmann distribution. The pre-cursor CH3OS(O)Cl also has a syn-form. Second, the average deviation of observed wavenumbers from the predicted anhar-monic vibrational wavenumbers for syn-CH3OSO (0.8%) is
slightly smaller than that from predictions for anti-CH3OSO (1.1%). For the two most intense lines, the observed lines at 989.7 and 714.5 cm−1are nearer those at 995 and 698 cm−1 predicted for syn-CH3OSO than those at 1017 and 727 pre-dicted for anti-CH3OSO. Third, according to theoretical cal-culations, among ν7 (S=O stretching), ν8 (CH3 wagging), and ν9 (CH3 rocking) modes of anti-CH3OSO, only ν7 has substantial IR intensity, whereas for syn-CH3OSO all three modes are mixed and have comparable intensities. Our obser-vations agree better with the latter.
The observed lines in group A do not match those re-ported for CH3SO2in solid p-H2 at 1416.0, 1272.5, 1071.1, 917.5, and 633.8 cm−1,27 nor do they match those of ClSO
2 in solid Ar or those predicted for ClOSO.44Although two
in-tense lines of CH3OS(O)O, the product reported after photol-ysis of (CH3O)2SO at 248 nm,49are predicted to have anhar-monic vibrational wavenumbers (986 and 680 cm−1) similar to those observed in group A (989.7 and 714.5 cm−1), two ad-ditional intense lines predicted at 1261 and 1078 cm−1 were unobserved in our experiments.
B. Assignments of lines in group A in the
CD3OS(O)Cl/p-H2experiments to CD3OSO
The deuterium-substitution experiment provides addi-tional support for the assignment of lines in group A to syn-CH3OSO. In TableIIwe compare the vibrational wavenum-bers of lines in group A observed in the fully deuterated experiments with the harmonic and anharmonic vibrational wavenumbers of syn-CH3OSO and anti-CH3OSO computed quantum-chemically. To minimize the error of calculations, we also list the predicted values for syn-CH3OSO in bracket in Table II. The predicted values are derived on multiplying
124510-6 Lee, Kong, and Lee J. Chem. Phys. 136, 124510 (2012)
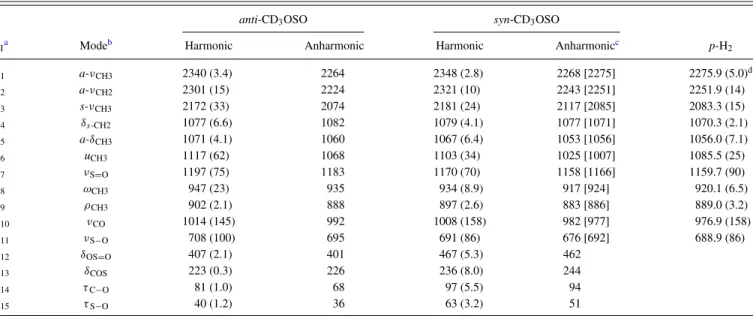
TABLE II. Comparison of harmonic (anharmonic) vibrational wavenumbers (in cm−1) and IR intensities (in km mol−1, listed in parentheses) of anti-CD3OSO
and syn-CD3OSO derived from experiments and calculations using the B3P86/aug-cc-pVTZ method.
anti-CD3OSO syn-CD3OSO
νIa Modeb Harmonic Anharmonic Harmonic Anharmonicc p-H2
ν1 a-νCH3 2340 (3.4) 2264 2348 (2.8) 2268 [2275] 2275.9 (5.0)d ν2 a-νCH2 2301 (15) 2224 2321 (10) 2243 [2251] 2251.9 (14) ν3 s-νCH3 2172 (33) 2074 2181 (24) 2117 [2085] 2083.3 (15) ν4 δs-CH2 1077 (6.6) 1082 1079 (4.1) 1077 [1071] 1070.3 (2.1) ν5 a-δCH3 1071 (4.1) 1060 1067 (6.4) 1053 [1056] 1056.0 (7.1) ν6 uCH3 1117 (62) 1068 1103 (34) 1025 [1007] 1085.5 (25) ν7 νS=O 1197 (75) 1183 1170 (70) 1158 [1166] 1159.7 (90) ν8 ωCH3 947 (23) 935 934 (8.9) 917 [924] 920.1 (6.5) ν9 ρCH3 902 (2.1) 888 897 (2.6) 883 [886] 889.0 (3.2) ν10 νCO 1014 (145) 992 1008 (158) 982 [977] 976.9 (158) ν11 νS−O 708 (100) 695 691 (86) 676 [692] 688.9 (86) ν12 δOS=O 407 (2.1) 401 467 (5.3) 462 ν13 δCOS 223 (0.3) 226 236 (8.0) 244 ν14 τC−O 81 (1.0) 68 97 (5.5) 94 ν15 τS−O 40 (1.2) 36 63 (3.2) 51
aWe follow the order of vibrational modes assigned for anti-CH 3OSO. bν: stretch, δ: bend or deformation, δ
S: scissor, u: umbrella, ω: wag, ρ: rock, τ : torsion, a: antisymmetric, and s: symmetric.
cPredicted values listed in brackets are derived by multiplying observed wavenumbers of CH
3OSO with the calculated isotopic ratio, defined as the ratio of the anharmonic vibrational
wavenumber of CD3OSO to that of CH3OSO predicted quantum chemically. dIntegrated IR intensities relative to ν
10of syn-CD3OSO are listed in parentheses.
the observed wavenumber of CH3OSO with the isotopic ra-tio, defined as the ratio of calculated anharmonic vibrational wavenumber of the D-substituted species to that of natural CH3OSO. Most deviations between observed and predicted vibrational wavenumbers are within 4 cm−1except for ν7and
ν6, which have deviations of 6 and 78 cm−1, respectively. For the ν7 mode, the deviation might be due to different extents of mixing in CH3OSO and CD3OSO. The wavenumbers of
ν5and ν6are similar. We made the assignments of ν5and ν6 according to the relative intensity of ν5 and ν6; the latter is predicted to be much greater than the former. The wavenum-ber order of ν5 and ν6 is the reverse of that of predicted an-harmonic vibrational wavenumbers, but agrees with that of harmonic vibrational wavenumbers. For the ν6mode, the ob-served line at 1085.5 cm−1agrees with the predicted harmonic vibrational wavenumber of 1103 cm−1. It is unclear why the correction of anharmonicity for this mode reduces this value to 1025 cm−1; the reduction is much larger than typical cor-rections.
According to theoretical predictions, the ν7−ν9 modes of syn-CH3OSO are mixed, with comparable intensities, whereas those of anti-CH3OSO are less mixed, with the ν7 mode carrying the most intensity (Table I). In contrast, the
ν7 mode of syn-CD3OSO is predicted to carry the most in-tensity, whereas the ν8 mode of anti-CD3OSO has more in-tensity than syn-CD3OSO. Our observation of three lines at 1165.2, 1152.1, and 1147.8 cm−1with comparable intensities for CH3OSO and a prominent line at 1159.7 cm−1for ν7and weak lines at 920.1 and 889.0 cm−1 for ν8 and ν9modes of CD3OSO strengthens the support for the assignments of lines in group A to syn-CH3OSO/CD3OSO.
In summary, we assigned lines in group A at 3028.4 cm−1 to ν1 (CH2 antisymmetric stretching), 2999.5 cm−1
to ν2 (CH3 antisymmetric stretching), 2950.4 cm−1 to ν3 (CH3 symmetric stretching), 1465.2 cm−1 to ν4 (CH2 scis-soring), 1452.0 cm−1 to ν5(CH3deformation), 1417.8 cm−1 to ν6 (CH3 umbrella), 1165.2 cm−1 to ν7 (CH3 wagging), 1152.1 cm−1to ν8(S=O stretching mixed with CH3rocking), 1147.8 cm−1 to ν9 (S=O stretching mixed with CH3 wag-ging), 989.7 cm−1 to ν10 (C−O stretching), and 714.5 cm−1 to ν11(S−O stretching) modes of syn-CH3OSO; the mode de-scriptions were made according to quantum-chemically pre-dicted displacement vectors.
C. Assignments of lines in group B in the
CD3OS(O)Cl/p-H2experiments to CD2OH
As described in Sec. III, in experiments with CH3OS(O)Cl/p-H2, lines in group B observed at 3651.9, 3038.5, 1457.6, 1332.1, 1179.2, and 1047.0 cm−1 agree well with those reported for CH2OH in an Ar matrix at 3650, 1459, 1334, 1183, and 1048 cm−1.40,41In experiments
with CD3OS(O)Cl/p-H2, these lines shift to 3653.6, 2165.9, 1280.5, 1212.9, 1017.1, and 840.7 cm−1. Although one would expect that CD2OD would be the carrier, but the observed wavenumbers do not agree with the vibrational wavenumbers reported for CD2OD in solid Ar at 2694, 1223, 1041, and 765 cm−1.41 Using the B3P86/aug-cc-pVDZ method, we computed anharmonic vibrational wavenumbers of CD2OD to be 2715, 2400, 2203, 1013, 1029, 1234, and 756 cm−1for
ν1−ν7, consistent with the literature experimental values as listed in TableIII.
As shown in Table III, the observed wavenumbers and relative IR intensities agree satisfactorily with the an-harmonic vibrational wavenumbers and IR intensities pre-dicted for CD2OH with the B3P86/aug-cc-pVDZ method. To
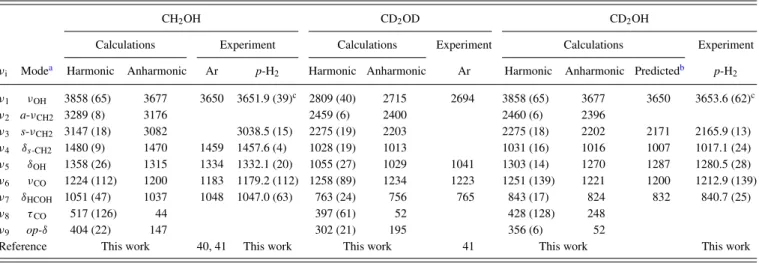
TABLE III. Comparison of harmonic (anharmonic) vibrational wavenumbers (in cm−1) and IR intensities (in km mol−1, listed in parentheses) of CH2OH,
CD2OD, and CD2OH derived from experiments and calculations using the B3P86/aug-cc-pVTZ method.
CH2OH CD2OD CD2OH
Calculations Experiment Calculations Experiment Calculations Experiment
νi Modea Harmonic Anharmonic Ar p-H2 Harmonic Anharmonic Ar Harmonic Anharmonic Predictedb p-H2
ν1 νOH 3858 (65) 3677 3650 3651.9 (39)c 2809 (40) 2715 2694 3858 (65) 3677 3650 3653.6 (62)c ν2 a-νCH2 3289 (8) 3176 2459 (6) 2400 2460 (6) 2396 ν3 s-νCH2 3147 (18) 3082 3038.5 (15) 2275 (19) 2203 2275 (18) 2202 2171 2165.9 (13) ν4 δs-CH2 1480 (9) 1470 1459 1457.6 (4) 1028 (19) 1013 1031 (16) 1016 1007 1017.1 (24) ν5 δOH 1358 (26) 1315 1334 1332.1 (20) 1055 (27) 1029 1041 1303 (14) 1270 1287 1280.5 (28) ν6 νCO 1224 (112) 1200 1183 1179.2 (112) 1258 (89) 1234 1223 1251 (139) 1221 1200 1212.9 (139) ν7 δHCOH 1051 (47) 1037 1048 1047.0 (63) 763 (24) 756 765 843 (17) 824 832 840.7 (25) ν8 τCO 517 (126) 44 397 (61) 52 428 (128) 248 ν9 op-δ 404 (22) 147 302 (21) 195 356 (6) 52
Reference This work 40, 41 This work This work 41 This work This work aν: stretch, δ: bend or deformation, δ
S: scissor, τ : torsion, a: antisymmetric, s: symmetric, op: out-of-plane.
bPredicted values are derived by multiplying observed wavenumbers of CH
2OH with the calculated isotopic ratio, defined as the ratio of the anharmonic vibrational wavenumber of
CD2OH to that of CH2OH predicted quantum chemically. cIntegrated IR intensities relative to ν
6of are listed in parentheses.
minimize the error of calculations, we also list the predicted values for CD2OH in TableIII. The predicted values are de-rived on multiplying the observed wavenumber of CH2OH with the ratio of calculated anharmonic vibrational wavenum-ber of CD2OH to that of natural CH2OH. Most deviations be-tween observed and predicted vibrational wavenumbers are within 1%. In contrast, predicted vibrational wavenumbers for
ν5 and ν7 modes of CD2OD at 1029 and 756 cm−1 deviate significantly from observed lines at 1280.5 and 840.7 cm−1. We hence assigned observed lines in group B in experiments with CD3OS(O)Cl/p-H2to CD2OH instead of CD2OD.
Although lines due to CH2OH and CD2OH appeared to be comparable to those of CH3OSO and CD3OSO, the estimated mixing ratios of [CH3OSO]:[CH2OH] and [CD3OSO]:[CD2OH] are 12−21 and 4−7, respectively, when the observed integrated intensities and predicted IR intensities were used. Similarly, the estimated mix-ing ratios of [CH3OS(O)Cl]0:[CH2OH] (or [CH3OH]0) and [CD3OS(O)Cl]0:[CD2OH] (or [CD3OH]0) are∼45 and ∼38, respectively. This also indicates that secondary photolysis or reaction of CH3OSO and CD3OSO, but not CH2OH or CD2OH, plays an important role in our experiments.
D. Mechanism of formation and diminished cage effect inp-H2
Lines of syn-CH3OSO appear upon irradiation of the CH3OS(O)Cl/p-H2 matrix near 239 ± 20 nm. This behav-ior is consistent with a mechanism according to which, upon photolysis of CH3OS(O)Cl to form Cl+ CH3OSO, some Cl atoms can escape from the original cage because of the dimin-ished cage effect of p-H2so that CH3OSO becomes isolated without a secondary reaction with the Cl atom. The presence of isolated Cl in p-H2is evident from the line at 943.8 cm−1.42 The diminished matrix cage effect of p-H2makes feasible the production of CH3OSO radicals from photolysis in situ of matrix-isolated CH3OS(O)Cl. Although the photolysis of
im-purity (CH3O)2SO at 248 nm yields CH3 + CH3OS(O)O,49 we observed no IR absorption line of CH3OS(O)O in the CH3OS(O)Cl/p-H2 experiments; this might be due to either CH3OS(O)O further decomposes or the yield is too small to detect.
The intensity of lines of syn-CH3OSO decreased with further irradiation at the same wavelength because of disso-ciation of syn-CH3OSO to produce CH3 and SO2, shown in Fig.1(c)as a weak line at 624 cm−1for CH3and some lines near 1345 cm−1 for SO2. The SO and SO2 fragments might react further with Cl atom to produce ClSO2 and ClSO, re-spectively, as observed in our experiment in small quantities. Another possibility for the production of ClSO2is that atomic Cl reacts with the SO2 impurity. The SO2 fragments might also react with CH3to produce CH3SO2.
Lines of CH2OH also appeared upon irradiation of the CH3OSOCl/p-H2 matrix; their intensity increased with fur-ther irradiation. How CH2OH was produced in a small pro-portion is unclear. The reaction of Cl with the CH3OH impu-rity might produce CH2OH. If this reaction is responsible for formation of CH2OH in experiments of CH3OS(O)Cl/p-H2, CD2OH rather than CD2OD is expected to be produced in experiments of CD3OS(O)Cl/p-H2because CD3OH was em-ployed in the synthesis of CD3OS(O)Cl. In contrast, if pho-tolysis of CH3OSO would produce CH2OH+ SO, one would expect to observe CD2OD from photolysis of CD3OSO, in-consistent with our observation.
V. CONCLUSION
Photo irradiation near 239 nm of a CH3OS(O)Cl/p-H2 matrix at 3.2 K produced new features at 3028.4 (ν1), 2999.5 (ν2), 2950.4 (ν3), 1465.2 (ν4), 1452.0 (ν5), 1417.8 (ν6), 1165.2 (ν7), 1152.1 (ν8), 1147.8 (ν9), 989.7 (ν10), and 714.5 (ν11) that are assigned to syn-CH3OSO. When a matrix of CD3OS(O)Cl/p-H2 was used, lines at 2275.9 (ν1), 2251.9 (ν2), 2083.3 (ν3), 1070.3 (ν4), 1056.0 (ν5), 1085.5 (ν6),
124510-8 Lee, Kong, and Lee J. Chem. Phys. 136, 124510 (2012)
1159.7 (ν7), 920.1 (ν8), 889.0 (ν9), 976.9 (ν10), and 688.9 cm−1(ν11) were observed and are assigned to syn-CD3OSO; the mode numbers correspond to those used for syn-CH3OSO. These assignments are based on their photochemical behavior and a comparison of observed and calculated anharmonic vi-brational wavenumbers, relative IR intensities, and D-isotopic shifts.
Four bands had been observed for gaseous CH3OSO.17 Our results are consistent with the five vibrational modes derived from simulation of rotational contours: 2991, 2956, 1154, 1151, and 994 cm−1. We extended the observation to all 11 vibrational modes within our detection range and char-acterized the important O−S stretching mode at 714.5 cm−1. The vibrational wavenumbers of CD3OSO are new.
Weak features observed at 3651.8, 3038.5, 1457.6, 1332.1, 1179.2, and 1047.0 cm−1 in CH3OS(O)Cl/p-H2 experiments are assigned to CH2OH. When a matrix of CD3OS(O)Cl/p-H2was used, lines at 3653.6, 2165.9, 1280.5, 1212.9, 1017.1, and 840.7 cm−1were observed and assigned to CD2OH. CD2OH might be produced from the reaction of Cl with the impurity CD3OH that was employed in the syn-thesis of CD3OS(O)Cl.
The observation of CH3OSO radical as the major product serves as an example to illustrate that solid p-H2has a dimin-ished cage effect, so that isolated CH3OSO radicals and Cl atoms are produced upon UV photolysis of CH3OS(O)Cl.
ACKNOWLEDGMENTS
We would like to dedicate this paper to Professor Helge Willner on the occasion of his 65th birthday. National Science Council of Taiwan (Grant No. NSC100-2745-M009-001-ASP) and the Ministry of Education, Taiwan (“Aim for the Top University Plan” of National Chiao Tung University) sup-ported this work. The National Center for High-Performance Computing provided computer time. We thank Laurie But-ler for sharing their method of synthesis of CH3OS(O)Cl and their preprint with us.
1T. S. Bates, B. K. Lamb, A. Guenther, J. Dignon, and R. E. Stoiber,
J. Atmos. Chem.14, 315 (1992).
2R. J. Charlson, J. E. Lovelock, M. O. Andreae, and S. G. Warren,Nature
326, 655 (1987).
3I. Barnes, K. H. Becker, and N. Mihalopoulos,J. Atmos. Chem.18, 267
(1994).
4S. B. Barone, A. A. Turnipseed, and A. R. Ravishankara,Faraday Discuss.
100, 39 (1995).
5I. Barnes, J. Hjorth, and N. Mihalopoulos,Chem. Rev.106, 940 (2006). 6A. J. Frank and F. Turecek,J. Phys. Chem. A103, 5348 (1999). 7S. R. Davis,J. Phys. Chem.97, 7535 (1993).
8L. Zhu and J. W. Bozzelli,J. Mol. Struct.: THEOCHEM728, 147 (2005). 9L. Zhu and J. W. Bozzelli,J. Phys. Chem. A110, 6923 (2006).
10B. J. Ratliff, X. Tang, L. J. Butler, D. E. Szpunar, and K.-C. Lau,J. Chem.
Phys.131, 044304 (2009).
11B. W. Alligood, B. L. FitzPatrick, E. J. Glassman, L. J. Butler, and
K.-C. Lau,J. Chem. Phys.131, 044305 (2009).
12X. Li, L. Meng, Y. Zeng, and S. Zheng,Chin. J. Chem.28, 896 (2010). 13S. E. Wheeler and H. F. Schaefer III,J. Phys. Chem. A113, 6779 (2009). 14L.-K. Chu and Y.-P. Lee,J. Chem. Phys.133, 184303 (2010).
15B. C. Gilbert, C. M. Kirk, R. O. C. Norman, and H. A. H. Laue,J. Chem.
Soc., Perkin Trans. II(4), 497 (1977).
16C. Chatgilialoglu, B. C. Gilbert, C. M. Kirk, and R. O. C. Norman,J. Chem.
Soc., Perkin Trans. II(8), 1084 (1979).
17J.-D. Chen and Y.-P. Lee,J. Chem. Phys.134, 094304 (2011). 18Y.-P. Lee, J. Chin. Chem. Soc. 39, 503 (1992).
19Y.-P. Lee, J. Chin. Chem. Soc. 52, 641 (2005).
20M. Bahou, C.-W. Huang, Y.-L. Huang, J. Glatthaar, and Y.-P. Lee, J. Chin.
Chem. Soc. 57, 771 (2010).
21T. Momose, M. Miki, M. Uchida, T. Shimizu, I. Yoshizawa, and T. Shida,
J. Chem. Phys.103, 1400 (1995).
22N. Sogoshi, T. Wakabayashi, T. Momose, and T. Shida,J. Phys. Chem. A
101, 522 (1997).
23M. Fushitani, N. Sogoshi, T. Wakabayashi, T. Momose, and T. Shida,J.
Chem. Phys.109, 6346 (1998).
24M. Bahou and Y.-P. Lee,J. Chem. Phys.133, 164316 (2010).
25C.-W. Huang, Y.-C. Lee, and Y.-P. Lee,J. Chem. Phys.132, 164303 (2010). 26J. C. Amicangelo and Y.-P. Lee,J. Phys. Chem. Lett.1, 2956 (2010). 27Y.-F. Lee and Y.-P. Lee,J. Chem. Phys.134, 124314 (2011). 28B. Golec and Y.-P. Lee,J. Chem. Phys.135, 174302 (2011).
29J. C. Amicangelo, B. Golec, M. Bahou, and Y.-P. Lee,Phys. Chem. Chem.
Phys.14, 1014, (2012).
30L.-K. Chu and Y.-P. Lee,J. Chem. Phys.124, 244301 (2006).
31Y.-P. Lee, Y.-J. Wu, R. M. Lees, L.-H. Xu, and J. T. Hougen,Science311,
365 (2006).
32P. L. Raston and D. T. Anderson,Phys. Chem. Chem. Phys.8, 3124 (2006). 33G. Berti,J. Am. Chem. Soc.76, 1213 (1954).
34M. J. Frisch, G. W. Trucks, H. B. Schlegel et al.,GAUSSIAN09, Revision
A.02, Gaussian, Inc., Wallingford, CT, 2009.
35T. H. Dunning, Jr.,J. Chem. Phys.90, 1007 (1989).
36D. E. Woon and T. H. Dunning, Jr.,J. Chem. Phys.98, 1358 (1993). 37A. Borba, A. Gómez-Zavaglia, P. N. N. L. Simões, and R. Fausto,J. Phys.
Chem. A109, 3578 (2005).
38D. T. Anderson, R. J. Hinde, S. Tam, and M. E. Fajardo,J. Chem. Phys.
116, 594 (2002).
39T. Shimanouchi, “Tables of molecular vibrational frequencies consolidated
volume II,”J. Phys. Chem. Ref. Data6, 993 (1972).
40M. E. Jacox and D. E. Milligan,J. Mol. Spectrosc.47, 148 (1973). 41M. E. Jacox,Chem. Phys.59, 213 (1981).
42P. L. Raston and D. T. Anderson,J. Chem. Phys.126, 021106 (2007). 43A. G. Hopkins and C. W. Brown,J. Chem. Phys.62, 2511 (1975). 44M. Bahou, S.-F. Chen, and Y.-P. Lee,J. Phys. Chem. A104, 3613 (2000). 45L.-K. Chu, Y.-P. Lee, and E. Y. Jiang,J. Chem. Phys.120, 3179 (2004). 46T. Shimanouchi, “Tables of molecular vibrational frequencies consolidated
volume I,” National Bureau of Standards, 1 (1972).
47M. E. Jacox,J. Mol. Spectrosc.66, 272 (1977). 48A. Snelson,J. Phys. Chem.74, 537 (1970).
49B. W. Alligood, C. C. Womack, D. B. Straus, F. R. Blasé, and L. J. Butler,
J. Chem. Phys.134, 194304 (2011).
50J. Rufus, G. Stark, P. L. Smith, J. C. Pickering, and A. P. Thorne,J.
Geo-phys. Res.108, 5011, doi:10.1029/2002JE001931 (2003).
51S. O. Danielache, C. Eskebjerg, M. S. Johnson, Y. Ueno, and N. Yoshida,
J. Geophys. Res.113, D17314, doi:10.1029/2007JD009695 (2008).
52C. S. Effenhauser, P. Felder, and J. R. Huber, Chem. Phys.142, 311