1876-6102 © 2015 The Authors. Published by Elsevier Ltd. This is an open access article under the CC BY-NC-ND license (http://creativecommons.org/licenses/by-nc-nd/4.0/).
Peer-review under responsibility of Applied Energy Innovation Institute doi: 10.1016/j.egypro.2015.07.153
Energy Procedia 75 ( 2015 ) 1819 – 1824
ScienceDirect
The 7
thInternational Conference on Applied Energy – ICAE2015
Improvements of Airflow Distribution in a
Container Data Center
I-Nuo Wang, Yeng-Yung Tsui, Chi-Chuan Wang
Department of Mechanical Engineering, National Chiao Tung University, 1001 Ta Hsueh Road, Hsinchu, Taiwan 30010, ROC Abstract
The present study aims at improvements of the airflow and temperature distribution in a container data center. Simulation is carried out based on a raised floor design. It is found that the height of raised floor casts significant impact on the flow distribution. Generally, the flow rate of the perforated tile near the entrance region of CRAC unit is lower than that of the rear part of the perforated tile. The mal-distribution becomes even more severe when the height of the raised floor is reduced. The mal-distribution can be significantly improved using a smaller opening perforated tile but it also gives rise to higher pumping power and impairs the effective flow rate from CRAC. Hence, a variable opening design with a larger opening near the CRAC outlet, followed subsequently with smaller opening perforated tiles, the mal-distribution can be eliminated without additional pumping power. For improvement of the airflow/temperature distribution into the rack, we propose a drawer-type rack which can increase the effective hot aisle space and reducing the cold aisle space. Through this design, hot air recirculation and cold air bypass will be significantly reduced. As a result, the rack maximum inlet temperature of drawer-type rack can be reduced as much as 13.3 qC when compared with the traditional one.
© 2015 The Authors. Published by Elsevier Ltd.
Selection and/or peer-review under responsibility of ICAE
Keywords: data center, container data center, raised floor, under-floor flow, numerical simulation, computational fluid dynamics.
1. Introduction
ġġġ The internet represents the worldwide interconnection of individual networks operated by government, industry, academia, and private parties and it had served millions of users and a multitude of purposes in all parts of the world since its expansion from 1994. As depicted in Fig. 1(a), more than 40 percent of population in the world had used the internet [1]. With the advent of internet, the demand of data center also rises continuously, and becomes even more pronounced pertaining to the enormous huge needs for mobile devices. Therefore, building a safety, steady, and energy saving data center becomes an important issue recently. In practice, gigantic heat is generated through IT equipment and must be handled with care to avoid any hazards.
© 2015 The Authors. Published by Elsevier Ltd. This is an open access article under the CC BY-NC-ND license (http://creativecommons.org/licenses/by-nc-nd/4.0/).
1.1. Literatures review
ġġġġġA typical air handling of the data center is shown in Fig. 1(b) where hot aisle and cold aisle is separated to prevent mixing of hot and cold air. By using the alternating arrangement of cold aisle and hot aisle, Sullivan [2] indicated that it is the best practice for thermal management in typical data center as far as energy efficiency is concerned. In addition, the exploitation of hot/cold aisle separation can also avoid overheating of the computer rack due to sufficient reduction of airflow mixing. Srinarayana [3] found that using a ceiling return strategy for the return of hot exhaust air to the CRAC units gives a better thermal performance of the data center, for both raised- and non-raised-floor strategy, as compared to the room return. Patankar et al. [4] had studied the airflow distribution of perforated tiles. They had investigated some crucial geometrical effects on the air flow distribution. Several studies [5, 6, 7] had compared the efficiency between hot aisle containment with cold aisle containment. Yet it is generally recognized that the hot aisle containment will be more efficient than those of cold aisle containment.
Fig. 1. (a) Internet users in the world [1]; (b) Hot/Cold aisle illustration diagram [2]
1.2. Purpose
ġġ As aforementioned in previous literatures, the air flow distribution plays a pivot role for preventing overheating the sever rack. The airflow distribution is especially severe in confined space such as container where limited space often amplified the mal-distribution problem which may lead to catastrophe outcome. In this regard, the present study will examine feasibility of variable perforated tile design to ease the mal-distribution problem. In addition, a novel drawer rack design is proposed and it will be shown that the hot-air recirculation and cold air bypass at the rack level can be significantly improved.
2. Numerical simulations
ġġġ In this study, a commercial software package, 6SigmaRoom, is used to verify the proposed novel concept.
2.1. Container data center without rack
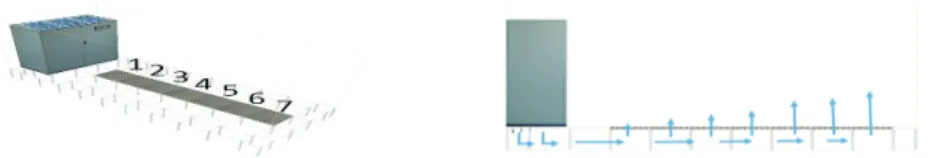
ġġġġġA standard 20-foot container having 6.1 m in length, 2.44 m in width, and 2.59 m in height with a raised floor height of 0.4 m is used as the model space for simulation, and its schematic is shown in Fig. 2(a). The CRAC can delivers 3 m3/s of cold air, and there are seven perforated tiles with 60% opening.
Fig. 2. (a) Schematic of the container data center; (b) Schematic of cold air flow alongside the under floor
ġġġ In the first part of the simulation, we had studied the airflow distribution of the perforated tiles. At first glance, it is usually considered that the first tile may deliver more air flow than the rest of tiles for it is nearest to CRAC. This is normally the case for a typical U-type plate heat exchanger where the flowrate at the entrance exceeds those subsequent channel plates. However, as shown in the schematic of Fig. 2(b). The flow distribution is actually opposite where the nearest tile shows the least air flowrate. The associated pressure distribution and flow rate is shown in Fig. 3. Notice that the pressure above the tiles is one atmosphere. The pressure difference across the plenum (tile) is shown in Fig. 3(a) from which it clearly shows that the pressure difference increases with the rise of tile number, suggesting a rise of air flow rate consecutively and this can be made clear from the simple Bernoulli’s equation. The associated flow rate in each tile is shown in Fig. 3(b) which clearly shows an appreciable mal-distribution. However, it appears that the first several few tiles suffer considerably of loss of flow rate than the rest of tiles. The results are in line with the calculations of Patankar et al. Ŝ4]. Using the above physics condition, we get a Base case result which is include the pressure distribution (Fig. 3 (a)), and the flow rate of perforated tiles (Fig. 3(b)). The standard deviation of airflow rate is to further understand the uniform level. From the Fig. 3(b), the corresponding standard deviation of the flow rate of the base case is 0.095.
Fig. 3. (a) Pressure distribution of the base case; (b) flow rate of base caseġġġġġ
Fig. 4. (a) Effect of the height of raised floor; (b) Flow rate for 60% open area and 25% open area
2.2.1. The height of the raised floor
Note that the foregoing results are applicable for a raised floor height of 0.4 m. When the raised floor is reduced to 0.3 m, the airflow distribution alongside the perforated tiles becomes more non-uniform than that of the base case. Conversely, when the raised floor is increased to 0.5 m, the mal-distribution of airflow rate of perforated tiles is appreciably eased. The relevant standard deviation subject to different
height of raised floor are 0.095, 0.177 and 0.041 (Fig. 4 (a)), respectively. The calculations indicate that the smaller space of the underfloor, the more pressure difference changes. In brief, the airflow of perforated tiles would be more mal-distributed when the height of raise floor is reduced.
2.2.2. Adjustment of the open area of the perforated tiles
With high opening of the perforated tiles like 60%, the air flow is easy to penetrate the perforated tiles. This normally gives rise to a worse flow distribution due to appreciable pressure difference alongside the tiles. In this regard, with a low open area tiles like 25%, the airflow becomes more uniform as depicted in Fig. 4 (b). The standard deviations of the flowrate for an open area 60% and 25% are 0.095 and 0.011, respectively. Nevertheless, even though the flow distribution is significantly improved by a smaller opening. The design is, in fact, not physically applicable. This is because it will cause significant pressure drop and requires huge pumping power. In actual implementation of the low opening perforated tiles will significant reduce the effective total flowrate from CRAC and bring about insufficient under-cooling. In view of such shortcoming of low opening perforated tiles, it would be beneficial to use variable opening. Conceptually, by placing larger opening tile at the entrance and smaller opening at the rear part may improve the overall performance. The modified designs are then check with the total pumping power across the perforated tiles, evaluated as 6 V P' . Where V and 'P are the volumetric flow rate and
pressure drop across the perforated tile. The flow distribution and the required pumping power is given in Table 1 and 2. As seen in Table 2, the required pumping power for a 25% opening is 104 Watts! Through the modified designs of case 1 and case 2, the standard deviation of the case 2 is reduced from 0.095 of the base case to 0.013, yet the pumping power is roughly the same as the base case (31.7 W vs. 26.2 W), suggesting a much better airflow distribution. The results imply that a better flow distribution can be achieved without pumping power penalty, and this can be made available via variable opening designs. Table 1. Flow rate of different open area of each perforated tile
Tile number 1 2 3 4 5 6 7 Base Case 60% Standard deviation : 0.095 Open area 60% 60% 60% 60% 60% 60% 60% Flow rate (m3/s) 0.26 0.35 0.40 0.44 0.49 0.54 0.54 Case 1
Standard deviation : 0.069 Open area Flow rate (m3/s) 60% 0.45 55% 50% 0.52 0.49 45% 40% 0.46 0.42 35% 30% 0.36 0.30 Case 2
Standard deviation : 0.013
Open area 70% 50% 50% 45% 45% 45% 45%
Flow rate (m3/s) 0.43 0.42 0.43 0.41 0.43 0.45 0.45 Table 2. Pumping power comparison
Base case (60%) Open area 25% Case 1 Case 2
Pumping power (W) 26.2 104.1 36.0 31.7
2.2. Novel Drawer design
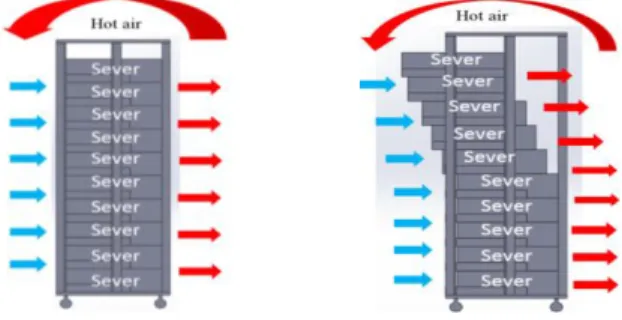
To fully utilize the space of the room, we put 14 racks into the room as shown in Fig. 5(a) for further simulation. The total heat load is 54 kW, and the flowrate of CRAC unit is 3.2 m3/s. With the confined space of a typical container data center, the hot air across the rack is comparatively difficult to flow back
to the CRAC, and some of the hot air may re-circulate back to cold-aisle to result in overheating of the computer rack. This eventually leads to a rise of inlet temperature and insufficient cooling accordingly. To solve this problem, a novel drawer-type rack which can easily vary the effective depth of the racks and it also provides some obstacles of re-circulation are schematically shown in Fig. 5(b) and Fig. 6. Notice an additional benefit of the present drawer design can also reduce the bypass cold flow from the perforated tile, yet it is movable and flexible pertaining to practical operation. The simulation is performed by moving the upper servers inside the rack cabinet 0.05 m ~ 0.25 m toward the cold aisle as shown in Fig. 5(c). By this design, the effective accommodation space in the hot aisle is increased while the effective space in cold aisle is reduced. Calculations of the thermal performance between traditional design and the drawer design are given in Table 3. Apparently, the proposed drawer type is capable to reduce a mean temperature of 2 qC and an appreciable drop of maximum temperature at the inlet from 47 qC to 33.7 qC.
Fig. 5. (a)Traditional rack arrangement; (b) Drawer-type rack arrangement; (c) Schematic of the drawer design.
Fig. 6. Drawer-type rack illustration (Blue arrows are cold air, red arrows are hot air). Table 3. Temperature for data center with traditional racks and drawer-type racks
Traditional Racks Drawer-type Racks
Moving distance 0 m 0.05m 0.1 m 0.15 m 0.2 m 0.25 m
Mean temperature (°C) 19.2 19.0 18.3 17.5 17.0 17.6
3. Conclusion
ġġġġġIn this paper, improvements of the airflow and temperature distribution of a container data center are examined. Simulation is carried out based on a raised floor design, and a commercially available software is used as the simulation tool. In the first part of the simulation, it is found that the height of raised floor plays imperative influences on the flow distribution. Generally, the flow rate of the perforated tile near the entrance region of CRAC unit is lower than that of the rear part of the perforated tile. The distribution becomes even more severe when the height of the raised floor is reduced. The mal-distribution can be significantly improved by introducing smaller opening perforated tile. However, this will bring about considerably additional pumping power and impair the effective flow rate from CRAC. To remedy this problem, a variable perforated tile design is proposed. By placing the larger opening near the CRAC outlet, followed subsequently with smaller opening perforated tiles. The mal-distribution can be eliminated without additional pumping power. In the second part of simulation, we propose a drawer-type rack which can increase the spaces of hot aisle by reducing the cold aisle spaces. Through this design, hot air recirculation and cold air bypass will be significantly reduced. As a result, the rack maximum inlet temperature of drawer-type rack can be reduced as much as 13.3 qC when compared with the traditional one.
Acknowledgements
The authors would like to thanks for the support from the Ministry of Science and Technology of Taiwan, under contract 103-3113-E-009-002.
References
[1] Internet live stats/ Number of internet users, 2014.
Available at: http://www.internetlivestats.com/internet-users/.
[2] Sullivan RF, Alternating cold and hot aisles provides more reliable cooling for server farms. Uptime Institute, 2000, TUI 708.
[3] Srinarayana N, Fakhim B, Behnia M, and Armfield SW, Thermal performance of an air-cooled data center with raised-floor and non-raised-floor configurations, Heat Transfer Engineering, 2014, 35(4), 384-397.
[4] Patankar SV, Airflow and cooling in a data center, Journal of Heat Transfer, 2010, 132(7), 073001. [5] Niemann J, Hot aisle vs. cold aisle containment, APC White Paper, 2008.
[6] Niemann J, Brown K, and Avelar V, Impact of hot and cold aisle containment on data center temperature and Efficiency, Schneider Electric Data Center Science Center, White Paper, 2011, 135, 1-14.
[7] Muralidharan B, Shrivastava SK, Ibrahim M, Alkharabsheh SA, and Sammakia BG, Impact of cold aisle containment on thermal performance of data center, In ASME 2013 International Technical Conference and Exhibition on Packaging and Integration of Electronic and Photonic Microsystems (pp. V002T09A016-V002T09A016). American Society of Mechanical Engineers, 2013.