A Gray Level Weighting Method to Reduce Optical Aberration Effect
in Holographic Data Storage System
Mang Ou-Yang
1and Yu-Ta Chen
2Department of Electrical Engineering, National Chiao-Tung University, Hsinchu 30010, Taiwan Department of Optics and Photonics, National Central University, Jhongli 32001, Taiwan
An alignment method for holographic data storage system (HDSS) is proposed in this paper. Due to several types of noises encountered in the HDSS, the signal-to-noise ratio (SNR) is degraded. Errors can be corrected using a channel code for some sorts of noise, while it may require a high quality optical system to reduce the error probability for the other types of noise. A checkerboard pattern is pro-posed using intensity weighting to find the fiducial points, which could work in a lower SNR system and thus reduce the error likelihood effectively. Reed-solomon (RS) code and oversampling are both made available in the HDSS. As a consequence, the aberration effects are eliminated using the fiducial points, leading to a low SNR system clear of errors after performing decoding. The lowest SNR system is out of error-free recovery condition, so that all the alignment methods proposed in this paper could not reduce the aberration effects to restore the images into the original data.
Index Terms—Alignment method, fiducial point, gravity center, holographic data storage.
I. INTRODUCTION
A
S a powerful storage technology featuring a high speed and large storage captivity [1]–[3], holographic data storage (HDS) refers to a page-oriented storage system that is better than the optical present storage systems such as Digital Video Disc (DVD) and Blu-ray DVD. As the Cloud Computing comes, all the user data will be made accessible in the servers. Therefore, HDS is a potential storage system that can serve as a backup system of high speed readout and large storage captivity.HDS is operated in a recorded mode such that two beams in-terfere in the medium, one, referred to as the object beam, and another the reference beam. The object beam passes though the spatial light modulator (SLM) at the same time as the recorded data are brought out. The object and reference beams are then collected and interfered in the storage medium and stored the recorded data in the storage medium. By the time the data pages are recovered, the reference beam is incident into the storage medium, with then the diffraction pattern caught by the image sensor. The original data is gained after performing the image processing and decoding of such diffraction pattern. It is an ideal case that the recorded image is identical to the diffractive pat-tern. However, the diffraction limit and noises cause the dis-torted diffraction patterns which are difficult to reconstruct into the original data, in case without performing image processing and coding.
The noises, such as inter-pixel/page interference (IPI) [4]–[8], misalignment [9]–[11], aberration [11], non-unifor-mity [12], scattering [13], and speckle [2] in the HDS, are classified into two types, where one is the system noise and the others are the random noise [14]. The effects caused by such noise can be in part removed utilizing a channel code, while Manuscript received September 13, 2010; accepted November 19, 2010. Date of current version March 02, 2011. Corresponding author: Y.-T. Chen (e-mail: s972406007@dop.ncu.edu.tw).
Color versions of one or more of the figures in this paper are available online at http://ieeexplore.ieee.org.
Digital Object Identifier 10.1109/TMAG.2010.2096462
some other types of noise such as misalignment and aberration still demonstrate effects on the HDS system (HDSS). The so-lutions to the misalignment problem include the oversampling or the postprocessing technique.
The oversampling technique refers to an algorithm that uti-lizes more than one pixel on the image sensor to catch a min-imum of one pixel from the SLM. Superior to a pixel-matched system in terms of the alignment tolerance, the oversampling system also provides a comparable signal-to-noise ratio (SNR). Mark Ayres et al. proposed an optimum oversampling ratio of 4/3 [15], which causes a tradeoff between the storage capacity and system SNR. Proposed by Burr and Weiss [12], the relation-ship, saved in a lookup table, between the neighboring pixels is utilized as a way to compensate the misalignment or aberration effect. Proposed by Burr, the simple alignment patterns such as checkerboard pattern or sparse lines can also be found in [16]. In the case of more aberration effects in the HDSS, an elevated oversampling ratio is able to avoid the noise effects and thus reach a high SNR, leading to a waste of storage capacity.
In this paper, a gray level weighting method (GLWM) is pro-posed in combination with the checkerboard patterns that lo-cates the gravity center (GC) as the fiducial point in a precise manner in the HDSS that is composed of low quality compo-nents and affected by noises. For a misalignment system with distortion or magnification error, the method is capable of lo-cating the fiducial points of windows in the pages. However, a satisfactory BER can be gained by the method even for the HDSS made up of low quality optical components and loose tolerance of alignment. The method is validated by way of sev-eral cases in various system conditions and compared with other alignment methods.
II. METHOD
As a key element, carrying information of system aberration, of GLWM and supplying a fiducial image for alignment when passing through the HDSS, the checkerboard pattern precedes the data sequence and is subsequently stored in the medium. When the system alignment is required, the pattern was caught before the stored data. The image was processed so as to locate 0018-9464/$26.00 © 2011 IEEE
the fiducial points of windows according to the image intensity distribution. The steps required in image processing are stated as follows.
1) The checkerboard image is convoluted with a weight ma-trix and generates a new image A.
2) Determine the threshold 1 in step 1 to turn the image A into a binary image.
3) Identify boundaries between white and black windows. 4) Enter the intensity and coordinates of boundaries into (4)
to locate the fiducial points of white/black windows. 5) Exchange the locations of white and black windows and
skip to step 1, if it is the first time to swap windows, other-wise skip to the next step.
6) Collect the fiducial points of black and white windows. The fiducial points were then applied to the distorted image received. The intensity was averaged at the regions of interest which encompass the fiducial points, and was transformed into binary data according to the threshold. At length, the binary data were recovered to original data after decoding processes.
Assuming that the checkerboard image of dimensions was received from the image sensor, the intensity depth, in the range of 0 to , of the received image was specified as N bits long and is up to the sensor ability, as well. An matrix which is shown is defined as
. .. ..
. . .. ...
(1)
where were arbitrary constants.
The entries in the matrix could be expressed in various forms, such as Gaussian, Laplacian, log distribution or average. The received image was convoluted with the matrix to generate the image A of dimensions , given as (2). The efficacy of convolution operation could be demonstrated as the enhance-ment of the contrast of textures in the checkerboard image
(2) where m and n denote dimensions of matrix, H and W those of the received image, respectively.
The intensity of the image A is expressed as
.. .
(3)
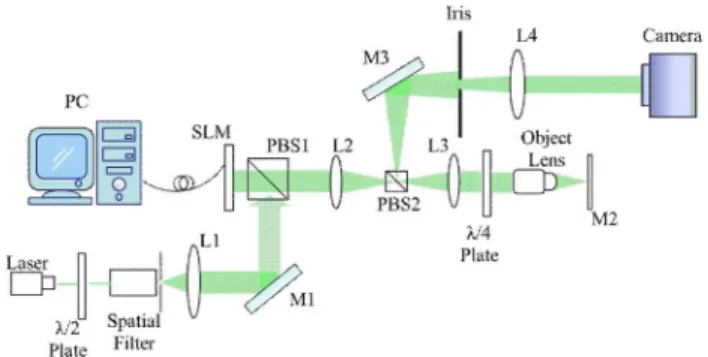
Fig. 1. The system configuration of the coaxial HDSS.
where denote the intensity of original re-ceived image.
As a means to turn the image A into a binary image, a threshold was determined to make out the boundaries between black and white windows in the binary image precisely at the same time. Unaddressed in this paper, a number of methods were made available to distinguish the boundary or edge from the image. The coordinates of the boundaries were found out one by one, with coordinates of the white window entered into (4) so as to determine the fiducial point
(4) In (4), p and q both represent the number of the boundary coordinates, Gc(x) and Gc(y) the coordinates of fiducial point.
With all the fiducial points of the white windows found out, the locations of white and black windows were swapped, and the preceding processes were repeated until all the fiducial points of white and black windows were located. Applied to the sub-sequent pages, fuducial points were employed to determine the intensity average for the regions of interest to have the distorted pages corrected.
III. EXPERIMENTS
Our test-bed is a reflection type of a coaxial system with the configuration shown in Fig. 1.
A 1024 768 SLM (HOLOEYE LC-R 2500, liquid crystal on silicon type) with 19 um pitch and a 1280 1024 CMOS camera (BLASER A504k) with 12 um pitch are supported in the HDSS. A block of 4 4 pixels is seen as a unit and RS code (31, 25, 3) is presented in the coded images. Data of
bits or so are coded into pages, each with 1024 bits. Because of the stored image that cannot be made sufficiently image quality occasionally, storage medium is took off from the HDSS. It is rather that the system noise is boosted by moving SLM and system misalignment, and the algorithm proposed is validated at this time.
There are three experiment cases, the first of which is a high quality system with a Fourier lens L4, has 375 mm focus length, that was designed for minimal aberration; the second is a normal system, where the Fourier lens is replaced with a usual lens with the focal length of 500 mm; the last is the worse system, where
Fig. 2. Received image in the second case.
L4 is made identical to that in case two but the SLM is shifted along the optic axis by a displacement of 0.05 mm between 0.1 mm to mm. The system magnification is distinct among three cases for the reason of L4. The system demonstrates a magnification of roughly 2.7 in case one and 3.7 in the other cases. Certainly, the rest of system parameters such as exposure time, LASER power, and frame rate, remain unchanged. There exist three alignment methods to locate the fiducial points in the three experiments. The first is the GLWM to discover the GC of windows, the second is GLWM to find the center of windows, and the last is the postprocessing made by cross line pattern to discover the fiducial points.
The alignment method of postprocessing made by cross line pattern is able to well control the lines across the centers of the first window and last windows both horizontally and vertically. The intervals in the horizontal and vertical directions between each line cannot be made identical due to the off-axis aberration effects. For the reason that the coded image is passed the edge of objective lens on purpose, the images suffer more distortion when the images emanate from SLM to CMOS camera with one of the received images shown in Fig. 2. It can be seen that the shadow caused by the aperture of object lens is shown in the upper-right corner of Fig. 2.
IV. RESULTS ANDDISCUSSIONS
Found from in the first and second cases, the fiducial points located from the alignment methods are shown in Fig. 3. Some fiducial points determined with various methods share the same locations or stay close to each other, which to surprise lead to a remarkable variation in results.
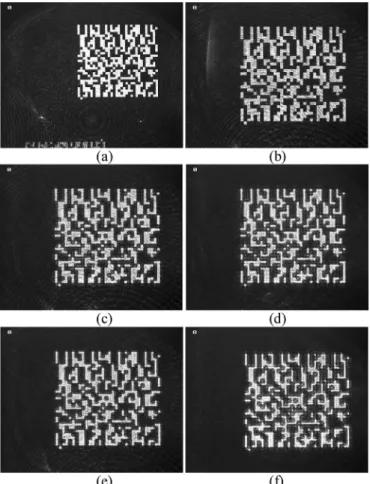
One of the received images from each case is shown in Fig. 4. The image in the case that employs a Fourier lens case is brighter than those using usual lens due to the fixed exposure time and magnification. The fiducial points located from the two different lenses cases and by various methods are thus applied to cor-responding cases. A region of 5 5 pixels is seen as a block around the each fiducial point at the received images over which the intensity distribution is averaged. The SNR and BER of all cases are determined and tabulated in Tables I to V. In the case of a usual lens with mm translation, an optimum threshold
Fig. 3. Red points represent the centers in GLWM, green points the GCs in GLWM, blue points the GCs in lining alignment of postprocessing.
Fig. 4. Received images in (a) the first case (b) the second case (c) the third case with00:05 mm shifting (d) the third case with 00:1 mm shifting (e) the third case with+0:05 mm shifting (f) the third case with +0:1 mm shifting.
is not found to obtain a minimum error number, for the reason that the BER is out of the error-free recovery [17], leading to a lack of data shown in the tables. The BER was determined by Gaussian distribution fitting [18], if there was none of error occurrence.
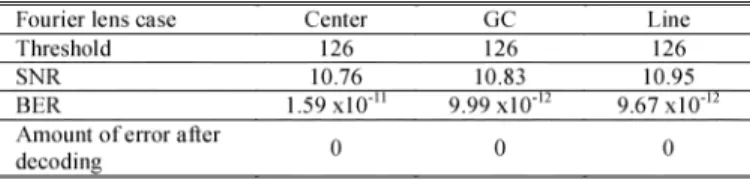
In the Fourier lens case, the threshold remains identical in various alignment methods due to a high quality system and less
TABLE I
THRESHOLD, BER, SNRANDERROR IN THEFIRSTCASE
TABLE II
THRESHOLD, BER, SNRANDERROR IN THESECONDCASE
TABLE III
THRESHOLD, BER, SNRANDERROR IN THETHIRDCASE
WITH00:05 MILLIMETERSHIFTING
TABLE IV
THRESHOLD, BER, SNRANDERROR IN THETHIRDCASE
WITH00:1 MILLIMETERSHIFTING
TABLE V
THRESHOLD, BER, SNRANDERROR IN THETHIRDCASE
WITH+0:05 MILLIMETERSHIFTING
distortion. All the methods provide a SNR over 10 and a compa-rable BER, implying that any alignment method could perform well in a high SNR system. Influenced by decreased intensity due to the fixed exposure time and magnification, the SNR of the usual lens case is half of that in the Fourier lens case. Even with a reduced SNR, the zero error occurrence is demonstrated due to the correct alignment, so the alignment method of postpro-cessing leads to a great number of errors after decoding. In the event that the intensity and contrast of second case is made up to first case, both the SNR and BER could approach to those in the first case, too. The BER of the second case with the line method is much similar to that in the third case, i.e., the worse system.
Fig. 5. A plot of BER versus displacement.
Displacement influences the system significantly and the IPI ef-fect is thus enhanced in the third case. In Fig. 4(c), (d) and (f), the regions of some black windows exhibit strong peaks from the nearby white windows. The histogram of 0 and 1 is over-lapped by the threshold in a vague manner, so that the RS code does not correct the error as required. It is noticed that the error number of mm shifting case by GLWMs is lower than other shifting cases. Moving the SLM away from focus plane, the Fourier plane of recoded position is also shifted simultane-ously so that the spot size is balanced by defocus [19]. In the end, a summary figure of the BER in the shifting case is made and shown in Fig. 5.
The BER of all usual lens cases combined with LC method is nearly out of error-free recovery, while the others could reduce the noise effect by correct alignment except for the two shifting cases due to the limitation on the error-free recovery.
V. CONCLUSION
In this paper, GLWM demonstrates an alignment method to reduce the system cost and keep the error away. Two types, i.e., center and GC, of GLWM share the same advantage in the var-ious situations; “center” refers to fitting a uniformity intensity system and GC fitting a non-uniformity intensity system or a lower SNR system. GLWM features the precise finding of the fiducial points in a much distorted image. If the system is in an error-free recovery situation, the fiducial points can reduce some noise effects to some extent so as to provide a better BER. As a major concern in GLWM, the threshold selected determines the locations of fiducial points at limited regions. In an ongoing and future work, the threshold of GLWM will become unrequired, implying that there is no need to identify the boundary, some disadvantages of GLWM are avoided and thus the fiducial point is located in a more accurate manner.
ACKNOWLEDGMENT
This work was supported by Technology Development Program for Academia (TDPA) 98-EC-17-A-07-S1-011 and the National Science Council of Taiwan under the projects NSC 98-2221-E-009-184- and NSC 98-2622-E-009-186-CC1. We thank Tien-Yu Yeh for his assistance, leading to this work accomplished successfully.
REFERENCES
[1] H. Horimai and X. D. Tan, “Holographic information storage system: Today and future,” IEEE Trans. Magn., vol. 43, pp. 943–947, Feb. 2007.
[2] J. F. Heanue, M. C. Bashaw, and L. Hesselink, “Channel codes for digital holographic data storage,” J. Opt. Soc. Amer. A, vol. 12, pp. 2432–2439, Nov. 1995.
[3] S. S. Orlov, W. Phillips, E. Bjornson, Y. Takashima, P. Sundaram, L. Hesselink, R. Okas, D. Kwan, and R. Snyder, “High-transfer-rate high-capacity holographic disk data-storage system,” Appl. Opt., vol. 43, pp. 4902–4914, Sept. 2004.
[4] C. Gu and F. Dai, “Cross-talk noise reduction in volume holographic storage with an extended recording reference,” Opt. Lett., vol. 20, pp. 2336–2338, Nov. 1995.
[5] J. F. Heanue, K. Gurkan, and L. Hesselink, “Signal detection for page-access optical memories with intersymbol interference,” Appl. Opt., vol. 35, pp. 2431–2438, May 1996.
[6] M. A. Neifeld and M. McDonald, “Technique for controlling cross-talk noise in volume holography,” Opt. Lett., vol. 21, pp. 1298–1300, Aug. 1996.
[7] F. Dai and C. Gu, “Effect of Gaussian references on cross-talk noise reduction in volume holographic memory,” Opt. Lett., vol. 22, pp. 1802–1804, Dec. 1997.
[8] D. Park and J. Lee, “Holographic data storage channel model with in-tensity factor,” IEEE Trans. Magn., vol. 45, pp. 2268–2271, May 2009. [9] W. C. Chou and M. A. Neifeld, “Interleaving and error correction in volume holographic memory systems,” Appl. Opt., vol. 37, pp. 6951–6968, Oct. 1998.
[10] A. Neifeld, K. M. Chugg, and B. M. King, “Parallel data detection in page-oriented optical memory,” Opt. Lett., vol. 21, pp. 1481–1483, Sep. 1996.
[11] G. W. Burr and T. Weiss, “Compensation for pixel misregistration in volume holographic data storage,” Opt. Lett., vol. 26, pp. 542–544, Apr. 2001.
[12] X. An and D. Psaltis, “Experimental characterization of an angle-muti-plexed holographic memory,” Opt. Lett., vol. 20, pp. 1913–1915, Sep. 1995.
[13] G. W. Burr, H. Coufal, R. K. Grygier, J. A. Hoffnagle, and C. M. Jef-ferson, “Noise reduction of page-oriented data storage by inverse fil-tering during recording,” Opt. Lett., vol. 23, pp. 289–291, Feb. 1998. [14] M. A. Neifeld and W. C. Chou, “Information theoretic limits to the
capacity of volume holographic optical memory,” Appl. Opt., vol. 36, pp. 514–517, Jan. 1997.
[15] M. Ayres, A. Hoskins, and K. Curtis, “Image oversampling for page-oriented optical data storage,” Appl. Opt., vol. 45, pp. 2459–2464, Apr. 2006.
[16] G. W. Burr, “Holographic data storage with arbitrarily misaligned data pages,” Opt. Lett., vol. 27, pp. 542–544, Apr. 2002.
[17] L. Dhar, K. Curtis, M. Tackitt, M. Schilling, S. Campbell, W. Wilson, A. Hill, C. Boyd, N. Levinos, and A. Harris, “Holographic storage of multiple high-capacity digital data pages in thick photopolymer sys-tems,” Opt. Lett., vol. 23, pp. 1710–1712, Nov. 1998.
[18] C. Gu, G. Sornat, and J. Hong, “Bit-error rate and statistics of complex amplitude noise in holographic data storage,” Opt. Lett., vol. 21, pp. 1070–1072, July 1996.
[19] V. N. Mahajan, “Geometrical point-spread function,” in Optical
Imaging and Aberrations. Washington: SPIE, 1998, ch. 4, pp. 210–214.