國
立
交
通
大
學
資訊科學與工程研究所
碩
士
論
文
無線多重生理狀態監控系統-
應用於居家睡眠監控
The Development of Wireless Polysomnography System for
Sleep Monitoring At Home
研 究 生:鍾家欣
指導教授:林進燈 教授
無線多重生理狀態監控系統-應用於居家睡眠監控
The Development of Wireless Polysomnography System for Sleep
Monitoring At Home
研 究 生:鍾家欣 Student:Chia- Hsin Chung
指導教授:林進燈 博士
Advisor:Dr. Chin-Teng Lin
國 立 交 通 大 學
資 訊 科 學 與 工 程 研 究 所
碩 士 論 文
A Thesis
Submitted to Institute of Computer Science and Engineering College of Computer Science
National Chiao Tung University in partial Fulfillment of the Requirements
for the Degree of Master
In
Computer Science
July 2009
Hsinchu, Taiwan, Republic of China
無線多重生理狀態監控系統-應用於居家睡眠監控
學生:鍾家欣
指導教授:林進燈 博士
國立交通大學資訊科學與工程研究所
摘要
目 前 要 確 立 睡 眠 呼 吸 中 止 症 的 檢 查 方 法 要 靠 「 睡 眠 多 項 生 理 監 測 儀 (polysomnography-PSG)」,但睡眠呼吸中止症的檢查,必須在睡眠檢查中心進行 整夜檢查。然而,數量有限的睡眠中心和床位往往導致診斷和治療的漫長等待; 再加上睡眠在陌生的環境,及次數不多的測量,可能影響受測者的睡眠情況,造 成無法完整診斷病症。所以,在家檢查睡眠情況會提供一個比在實驗室中設置更 切合實際及效率的評估方式。 本論文提出一個以電池供應電源、微小化及便攜式的無線多重生理參數介 面,並以JAVA 開發監控及紀錄的軟體,將受測者睡眠時的生理參數存入接收的 電腦中,專家可依儲存的資料,判讀及診斷使用者的睡眠情況。於真實的環境中, 居家睡眠監控系統必須是個便利的大小、堅固耐用、重量輕且低功率消耗來達到 可穿戴便利與持久性的需求。為了證明我們提出系統的可行性,我們於台北榮民 總醫院的睡眠中心在健康的受測者上同時錄製標準的 PSG 系統- Alice 5® Diagnostic Sleep System 與本論文提出的系統。而兩套系統在時域及睡眠階段上 的比較分析,均達到很好的相似程度,故我們提出的系統可以在居家睡眠檢查的 長期追蹤研究上實際運用。The Development of Wireless Polysomnography System for Sleep
Monitoring At Home
Student: Chia-Hsin Chung
Advisor: Dr. Chin-Teng Lin
Institute of Computer Science and Engineering
Department of Computer Science
National Chiao Tung University
Abstract
The polysomnography (PSG) is considered as the gold standard for the diagnosis of Obstructive Sleep Apnea (OSA). The examination of OSA requires an overnight sleep experiment in a laboratory. However, due to the limitation for number of labs and beds, patients often have to wait for a long time before being diagnosed and eventually treated. In addition, the unfamiliar environment and restricted action when operating PSG may disturb the sleep of patients, and then cause an incomplete or corrupted test. Therefore, a PSG conducted at the patient’s home would be more reliable and more convenient.
In this study, we implemented wireless polysomnography system for sleep monitoring at home, which involves with a battery-powered, miniature, wireless, portable, and multipurpose recorder. A java-based PSG recording program in the personal computer was designed to save several bio-signals and transfer them into EDF format. And then, these PSG records can be used to determine patient’s sleep stages and diagnose OSA by specialists. This system is portable, lightweight, and low power-consumption. To demonstrate the feasibility of our proposed PSG system, the
comparison between the standard PSG-Alice 5® Diagnostic Sleep System and our system was examined. Here, several healthy volunteer patients simultaneously performed PSG experiment with standard PSG-Alice 5® Diagnostic Sleep System and our system under the supervision of specialists at the Sleep Laboratory of Taipei Veteran General Hospital. The results for comparison of time-domain waveform and sleep stage between the above two systems showed that our system was reliable and can be applied in practice. Our system can serve for a long-term tracing and research of personal sleep monitoring at home.
Keywords: Polysomnography (PSG), JAVA, wireless, sleep motoring at home
Chinese Acknowledgements s
誌 謝
本論文的完成,首先要感謝指導教授林進燈博士這兩年來的悉心指 導,讓我學習到許多寶貴的知識,在學業及研究方法上也受益良多。另外 也要感謝口試委員們的建議與指教,使得本論文更為完整。 首先感謝我的父母親對我的教育與栽培,並給予我精神及物質上的一 切支援,使我能安心地致力於學業。此外也感謝對我不斷的關心與鼓勵。 其次,感謝實驗室的林伯昰博士及柯立偉博士在研究上的指導。同學 哲睿、有德、介恩、昕展,在過去兩年研究生活中同甘共苦、相互扶持,及 學姐依伶與學長志峰、紹偉、學弟妹們聖翔、璽文、敬婷、佳鈴、佩瑄、 育航、智賢及琬茹,在研究過程中所給我的鼓勵與協助,以及台北榮總的 蘇東平主任,嘉敏及俊賢在睡眠實驗過程中提供的幫忙,尤其是林伯昰博 士,在硬體設計的理論及程式技巧上給予我相當多的幫助與建議,讓我獲 益良多,最後感謝朋友志賢、倩妃、剛旭、莉玲的鼓勵及幫忙。也同樣感 謝實驗室助理 Jessica 及 Nao 在許多事務上的幫助。 謹以本論文獻給我的家人及所有關心我的師長與朋友們。Contents
摘要 ………ii
Abstract... iii
Chinese Acknowledgements s 誌 謝...v
Contents ...vi
List of Tables... viii
List of Figure ...ix
Chapter 1 Introduction...1
1.1 Sleep monitoring...1
1.2 Previous Work...2
1.3 Motivation...8
1.4 Organization of Thesis ...10
Chapter 2 Material and Method... 11
2.1 System overview...11
2.2 Biosignals...11
2.3 Methods of Data Analysis...18
2.3.1 Sleep Stage...18
2.3.2 Scoring sleep by epochs...20
2.3.3 Scoring apneas ...22
2.3.4 Scoring Hypopnea...22
2.4 European Data format ...22
Chapter 3 Hardware Frameworks of Portable Biosignal Acquisition System...26
3.1 System Overview...26
3.2 Portable biosignal Acquisition Unit ...27
3.2.1 Multi-Channels Front-End Circuits ...29
3.2.2 Analog to Digital Converter and Digital Controller ...32
3.2.3 Power Management ...33
3.2.4 Wireless Transmission ...34
4.1 Firmware in MSP430...37
4.2 Software in Personal Computer ...43
4.2.1 JAVA Environment...43
4.2.2 Software interface ...44
Chapter 5 Experiment Results...50
5.1 System verification ...50
5.1.1 Verification of Simulation Signals ...50
5.1.2 Verification of bio-signals -Calibration...52
5.2 Comparison between our proposed system and reference system...54
5.2.1 Experiment environment...54
5.2.2 Alice®-family ...57
5.2.3 On-line bio-signal monitoring/recording ...59
5.2.4 Experiment output...60
Chapter 6 Conclusions...72
List of Tables
Table 1: Sleep-apnea evaluation studies (6-hour overnight recording minimum)...3
Table 2: Medical and physiological parameters [29]...12
Table 3: Common band of EEG [46] ...13
Table 4: Rules of sleep stage[11] ...20
Table 5: Detailed digital format of the EDF header record[28]...25
Table 6: Specification for various kinds of bio-sensors...29
Table 7: The specification of Portable biosignal acquisition unit...36
Table 8: Timer modes...39
Table 9: Transmit time errors (microseconds) ...42
Table 10: The parameter of EDF header...48
List of Figure
Fig. 1- 1: Normal people and OSA patient ...2
Fig. 1- 2: Alice 5® Diagnostic Sleep System and Pediatric Polysomnography patient [10]...4
Fig. 1- 3: Patient wearing the Embletta (Level III) [13] ...6
Fig. 1- 4: Watch PAT; Itamar Medical; Caesarea, Israel ...7
Fig. 2- 1: Diagram of Wireless polysomnography system overview...11
Fig. 2- 2: The recommended derivations of EEG (a) F4-M1; (b) C4-M1; (c) O2-M1 13 Fig. 2- 3: Brain activities in difference sleep stage...14
Fig. 2- 4: (a) The recommended derivations of EOG (b) Pattern of eye movement during sleep...14
Fig. 2- 5: The EMG electrodes position and recorded pattern of chin muscle tension. ...15
Fig. 2- 6: A single modified ECG Lead II, which use torso electrode placement, is Recommended...16
Fig. 2- 7: Airflow sensor is placed to record breathing during sleep...17
Fig. 2- 8: This patient is wired-up for an overnight sleep study (polysomnogram) [43]. ...17
Fig. 2- 9: Sleep stages pattern...18
Fig. 3- 1: Framework of portable biosignal acquisition system...27
Fig. 3- 2: Voltage and frequency ranges of some common biopotential signals ...27
Fig. 3- 3: Diagram of portable biosignal acquisition system ...28
Fig. 3- 4: The RG decides the gain of preamplifier, and the high pass filter of preamplifier decided by RG and C. ...30
Fig. 3- 5: High-pass filter and Low-pass filter circuits...31
Fig. 3- 6: Simulation results in each channel of amplifier and band-pass filter ...32
Fig. 3- 7: MSP430 Architecture...33
Fig. 3- 8: Power supply circuit in data acquisition system ...34
Fig. 3- 9: The hardware of Portable biosignal acquisition system...36
Fig. 4- 1: Diagram of software frameworks...37
Fig. 4- 2: Flow chart of firmware in MSP430 ...38
Fig. 4- 3: ADC12 Block Diagram...39
Fig. 4- 4: Diagram of the sampling and conversion with timer A trigger...41
Fig. 4- 5: Data format...41
Fig. 4- 6: Simulation result of moving average filter...43
Fig. 4- 7: Java environment ...44
Fig. 4- 9: Procedure of Discovery Listener...46
Fig. 4- 10: Record data in Text format...47
Fig. 4- 11: Recording procedure of Text file and EDF ...48
Fig. 4- 12: Simulation data in EDF format and browse by EDF browser [42]...49
Fig. 5- 1: Simulated signals obtained by our PSG system...51
Fig. 5- 2: Comparison of FFT between simulated signals obtained by our PSG system and reference signals generated by MATLAB for 1, 5, 15, and 20 Hz sin waves. ...52
Fig. 5- 3: Electrodes disposal for sleep staging investigation...53
Fig. 5- 4: Variation of bio-signals in Calibration test-recorded by our proposed system ...53
Fig. 5- 5: Sleep laboratory of Taipei Veteran General Hospital...54
Fig. 5- 6: Diagram of bio-signals processing for system verification...56
Fig. 5- 7: Electrodes disposal of two systems...56
Fig. 5- 8: Subject wire up two systems: left is Alice 5 Diagnostic Sleep System and right is our proposed system. ...57
Fig. 5- 9: Alice ® Sleepware™...58
Fig. 5- 10: PC-based recording/monitoring user interface...59
Fig. 5- 11: Stage W: note the eye movements with high chin tone, 30-s epoch ...60
Fig. 5- 12: Stage N1: SEMs are seen with gradual drop out of alpha,30-s epoch ...61
Fig. 5- 13: Stage N2:K complexes and sleep spindles seen, 30-s epoch ...61
Fig. 5- 14: Stage N3: Delta slow waves are seen, 30-s epoch ...62
Fig. 5- 15: Stage R: Note saw tooth waves with REMS...62
Fig. 5- 16: Correlation examples ...63
Fig. 5- 17: Comparison of 30-second raw data (EEG C4-M1), and their correlation in every 1 second...64
Fig. 5- 18: Comparison of 30-second raw data (EEG O2-M1), and their correlation in every 1 second...65
Fig. 5- 19: Comparison of 30-second raw data (EOG-Left), and their correlation in every 1 second...65
Fig. 5- 20: Comparison of 30-second raw data (EOG-Right), and their correlation in every 1 second...66
Fig. 5- 21: Comparison of raw data (ECG), and their correlation in every 1 second ..66
Fig. 5- 22: Comparison of raw data (EMG-Right) ...67
Fig. 5- 23: Comparison of raw data (Nasal airflow)...67
Fig. 5- 24: Hypnograms of the two sets of records (subject 1)...68
Chapter 1 Introduction
1.1
Sleep monitoring
Sleep is a natural state of bodily rest observed in humans and other animals. A sleep disorder is a medical disorder of the sleep patterns of a person or animal. Obstructive sleep apnea (OSA) is the most common category of sleep-disordered breathing. The term "sleep disordered breathing" is commonly used in the US to describe the full range of breathing problems during sleep in which not enough of air reaches the lungs (hypopnea and apnea). Sleep disordered breathing is associated with an increased risk of cardiovascular disease, stroke, high blood pressure, arrhythmias, diabetes, and accidents. [1-4]
Some sleep disorders are serious enough to interfere with normal physical, mental and emotional functioning. It is often ordered for patients with complaints of daytime fatigue or sleepiness that may be caused by interrupted sleep. According to the study in Hong Kong, middle-aged people suffering from sleep apnea syndrome, the rate of male is about 4% and female is about 2% , which in Taiwan is estimated about 45 million people and Japan currently has more than 200 million people suffer from sleep disorder. Once the disease is often not enough sleep, most of them will be daytime sleepiness, inability to concentrate attention, and even individuals can easily lead to accidents and traffic accidents [5], it has direct impact on the patient’s quality of life. In recent years sleep disorder in Europe, America, and Japan has become one of the focuses of public safety.
1.2
Previous Work
Sleep disorder is a major public health problem, affecting up to 5% of the world population [6], with levels reaching values as high as 4% for men, 2% for women, and 3% for children [7]. The science of sleep medicine has evolved tremendously as a result of the development of tools that enable us to detect and document the activities of various physiological and pathological events that occur in the central nervous system accompanied by changes, which develop in the cardio respiratory, circulatory and autonomic nervous systems during sleep. Polysomnography is used to diagnose, or rule out, many types of sleep disorders including narcolepsy, restless legs syndrome, REM behavior disorder, parasomnias, and sleep apnea.
Fig. 1-1: Normal people and OSA patient [44]
Obstructive sleep apnea syndrome (OSAS) evaluation from PSG data was scored by clinical experts by using the standard procedures and criteria [6]. Sleep Apnea is a condition where a person periodically stops breathing during sleep. This causes the person to wake up dozens of times during the night, but in most cases they are unaware of this disruption. The most common type of sleep apnea is Obstructive Sleep Apnea (OSA), which is caused by closure of the airway. The drawing to the right shows the airway of a healthy individual (left) and an OSA patient (right). The
healthy patient is breathing normally with the airway open, but the OSA patient's airway is closed, with the arrows showing the blockage [Fig. 1-1].
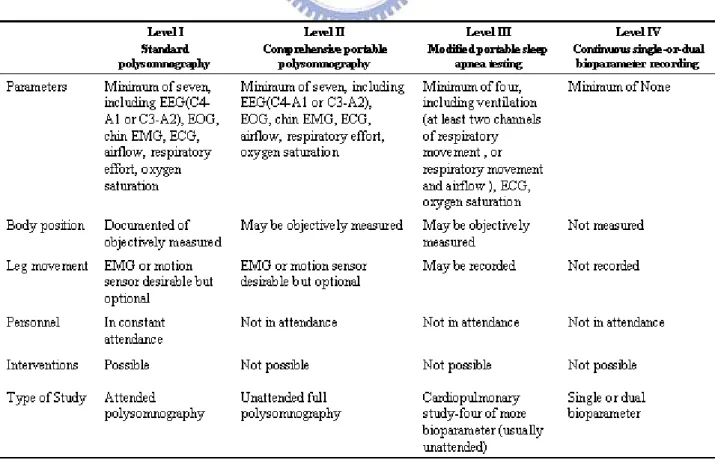
The American Association of Sleep Medicine [AASM] published initial practice parameters regarding the use of Portable Monitor (PM) devices in the assessment of OSA in 1994[8]. Many studies have been carried out for OSAS screening attempting to reduce PSG cost and complexity. Different techniques have been proposed, oximetry-based screening being one of the most widely suggested for both the adult and pediatric population. Although these methods have high sensitivity, they tend to have very low specificity [9]. The society classified sleep apnea evaluation studies based on the number of channels or signals that the monitor employed, categorized from level I to level IV. A minimum of 6 hours of recording time was recommended when using any of the configurations. The levels of portable recording equipment and delineated specifications are shown asTable 1.
Level I monitoring consists of full overnight polysomnography, with a minimum of two channels each for EEG, chin EMG, EOG, as well as respiratory airflow (with thermistor or pressure-flow transducer), respiratory effort (thoracic and abdominal breathing movements), oximetry, and ECG or heart rate monitoring. These studies are fully attended by a technologist and are typically conducted in a sleep center. The level I system is shown as Fig. 1-2
.
Fig. 1-2: Alice 5® Diagnostic Sleep System and Pediatric Polysomnography patient [10]
Laboratory-based polysomnography forms the framework upon which the field of sleep disorders medicine has been built over the last 40-50 years. For the standard test the patient comes to a sleep lab in the early evening, and over the next 1-2 hours is introduced to the setting and "wired up" so that multiple channels of data can be recorded when he/she falls asleep. The sleep lab may be in a hospital, a free-standing medical office, or in a hotel. A sleep technician should always be in attendance and is responsible for attaching the electrodes to the patient and monitoring the patient during the study. After the test is completed a 'scorer' analyzes the data by reviewing the study in 30 second 'epochs' [11].
disorder, cardiorespiratory variable were added to polysomnography as a standard feature. The high prevalence of sleep-related breathing disorders has highlighted limitations in patient accessibility to diagnostic and therapeutic services. In addition, and the need for studies has increased, less costly but comparable efficacious alternatives to laboratory-based polysomnography are being sought in response to current economic imperatives. Standard sleep laboratory research protocols often require two consecutive PSG nights because of inter-night variability in sleep attributed to first-night adaptation to a novel sleep environment and recording procedures. Finally, home studies may provide a more realistic appraisal of nighttime pathology than can be obtained in the laboratory setting. Patients can now be evaluated outside of the laboratory by using portable devices that can record a single channel such as oximetry, two or more channels that measure only respiratory variables, or multiple channels that allow for sleep staging as well as measurement of respiratory variables.
Portable studies (level II to IV) are summarized as follows: level II consists of an equivalent number of channels as level I, with the singular difference being that the study is not attended by a technician. Like level I studies allow for the identification and quantification of sleep stages. Using the Sleep Heart Health Study (SHHS) methodology and technology, Iber and colleagues [12] recruited 76 participants from the general community to volunteer for recordings both in the laboratory and at home. Subjects were randomized with respect to recording order and were monitored with the same level II device used for the SHHS cohort (Compumedics; Abbotsford Australia). From this study, Using SHHS methodology, median RDI was similar in the unattended home and attended laboratory setting with differences of small
a rate of disease misclassification that is similar to repeated studies in the same setting.
The level III utilizes at least four channels, including two channels for respiration and one channel for cardiac monitoring. The level III system is shown as Fig. 1-3. Dingli and colleagues [13] assessed the diagnostic accuracy of a type 3 monitoring. The study design consisted of simultaneous recording with the PM and traditional in-laboratory polysomnography, followed by an at-home assessment with the same PM. While the in-laboratory RDI and home RDI recorded from the type 3 monitor demonstrated no difference, the AHI generated from the in-laboratory polysomnography was significantly different.
Fig. 1-3: Patient wearing the Embletta (Level III) [13]
Level VI is made up of only one or two channels, typically including oxygen saturation or airflow. Pittman and colleagues tested a novel type4 monitoring device (Watch PAT; Itamar Medical; Caesarea, Israel, Fig.1-4) against traditional in-laboratory polysomnography [14]. The Watch PAT is wrist-worn device that collects peripheral arterial tonometry and oxygen saturation data, coupled with actigraphy.
Fig. 1-4: Watch PAT; Itamar Medical; Caesarea, Israel[45]
The paper [12] objective of this meta-analysis study was to compare the accuracy of home sleep studies with laboratory polysomnography in the diagnosis of obstructive sleep apnea (OSA). Home sleep studies provide similar diagnostic information to laboratory polysomnography in the evaluation of sleep-disordered breathing but may underestimate sleep apnea severity. The lower cost of home sleep studies makes it a viable screening tool for patients with suspected OSA; however, these lower costs are partially offset by the higher rate of inadequate examinations.
The primary end point examined was the ability of PM devices to confirm or rule out disease. The AASM guidelines [15] did allow for the use of PM devices under certain conditions. These include the lack of available polysomnography for patients with severe clinical symptoms consistent with OSA, the inability of the patient to be studied in the laboratory, or to evaluate response to therapy in a patient who has already undergone traditional in-laboratory polysomnography. A number of limited-channel, in home devices for the diagnosis of OSA have been described [16-22]; however, as a group they have not been recommended in the published practice parameters for in-home unattended studies [15, 23]. The primary reason
apnea diagnostic systems into levels of complexity is used to simplify comparisons [23], it has the effect of obscuring the validity of individual devices with acceptable validation studies.
However, there are several limitations of PM devices that must be considered as well. These include the inherent lack of an attendant during the study, which may potentially affect data quality. In addition, the most widely used applications of PM technology do not have EEG channels and are unable to assess sleep architecture of staging. This inability does not allow for the computation of the apnea-hypopnea index (AHI) because total sleep time cannot be calculated.
1.3
Motivation
While clinicians have increasingly turned their attention to this syndrome, and referrals to sleep clinics for diagnostic evaluations have increased dramatically, the infrastructure to support them has not [24]. The report stated that simpler and less expensive diagnostic tests as well as simpler prescreening tests prior to full-channel PSG are needed [25].
Time is of the essence: as many as 82% of men and 93% of women with moderate-to-severe sleep apnea have not received a diagnosis, as estimated by data from the Wisconsin Sleep Cohort study [26] . Patients may have sleep apnea for up to 7 years before coming to medical attention and wait up to an additional 8 months before seeing a sleep specialist [27].
Recently recognized adverse consequences of sleep apnea, along with ongoing therapeutic advances, have heightened the urgency for expeditious diagnosis and treatment. The high prevalence of sleep-related breathing disorders has highlighted limitations in patient accessibility to diagnostic and therapeutic services. In addition,
as the need for studies has increased, less costly but comparable efficacious alternatives to laboratory-based polysomnography are being sought in response to current economic imperatives. Finally, home studies may provide a more realistic appraisal of nighttime pathology than can be obtained in the laboratory setting.
Because of these and other considerations, portable systems intended to assess sleep apnea have been developed for use in settings outside the sleep laboratory. Utilizing a conventional wireless ambulatory recorder, we have developed a portable multipurpose recorder which can store several biosignals simultaneously. In this study, the EEG (electroencephalogram), EOG (electrocardiogram), EMG (Electromyography), EKG (Electrocardiography), Airflow were recorded during the sleep using monitoring/recording software designed by Java. Data are written in a binary file following by the standard EDF (European Data Format), a standard file format designed for exchange and storage of medical time series[28].The exchange format can import to other software to analysis sleep disorder and score sleep stage by specialist.
1.4
Organization of Thesis
In Chapter 2, it will describe that what are biosignals, sleep stage scoring and algorithms implemented in this thesis, which including moving average and EDF format. In Chapter3, it will introduce how to implement a wireless portable PSG signal acquisition in hardware design. In Chapter 4, it will explain the detail of Software implement in PSG system include firmware in MSP430 and PC-based Monitoring/Recording software; then the whole system will be verified with test pattern and real biosignals, the procedures and results of verification will be described in Chapter 5. Finally it will have conclusion in Chapter 6.
Chapter 2 Material and Method
2.1
System overview
The purpose of this research is to development a portable wireless polysomnography System for Sleep Monitoring At Home. In order to do this, it needs a system to acquire and monitoring/recording biosignals in EDF format, the exchange format can import by other analysis software to scoring sleep stage; so it was divided into two parts to introduce in this chapter. One is how do we to get the data for signal processing in experimental environment and the other is what does this biosignal
means in scoring sleep stage. The diagram of overview system was shown as Fig. 2-1.
Fig. 2- 1: Diagram of Wireless polysomnography system overview
2.2
Biosignals
A polysomnogram will typically record a minimum of eleven channels requiring a minimum of 22 wire attachments to the patient. Two channels are for the EEG, one or two measure airflow, one is for chin movements, one or more for leg movements, two for eye movements (EOG), one for heart rate and rhythm, one for oxygen saturation and one each for the belts which measure chest wall movement and upper abdominal wall movement.
Wires for each channel of recorded data lead from the patient and converge into a central box, which in turn is connected to a computer system for recording, storing and displaying the data. During sleep the computer monitor can display multiple channels continuously. In addition, most labs have a small video camera in the room so the technician can observe the patient visually from an adjacent room.
The difference types of Electrical potentials are listed in Table 2[29]. We describe difference biosignal of electrode position and recorded signal.
Table 2: Medical and physiological parameters [29] Parameter Principal Measurement Range of
Parameter EEG 20uV-200uV EMG 10uV-5000uV EOG 50uV-3500uV EKG 0.5mV-4mV A. Electroencephalogram
Electroencephalography (EEG) is the measurement of electrical activity produced by the brain as recorded from electrodes placed on the scalp. When measuring from the scalps, recorded the EEG signal is about 20-200uV for a typical adult human. And a common system reference electrode is connected to the other input of each different amplifier. These amplifiers amplify the voltage between the active electrode and the reference (typically 1,000–100,000 times, or 60–100 dB of voltage gain). The EEG is typically described in terms of rhythmic activity and transients. The rhythmic activity is divided into bands by frequency. The common band of EEG is shown as Table 3 [46].
Table 3: Common band of EEG [46] Type Frequency (Hz) Delta Up to 3Hz Theta 4 – 7Hz Alpha 8 – 13Hz Beta 13 - 30Hz
In PSG system, the electroencephalogram (EEG) will generally use three "exploring" electrodes and two "reference" electrodes, unless a seizure disorder is suspected, in which case more electrodes will be applied to document the appearance of seizure activity. The exploring electrodes are usually attached to the scalp near the frontal, central (top) and occipital (back) portions of the brain via a paste that will conduct electrical signals originating from the neurons of the cortex. These electrodes will provide readout of the brain activity that can be "scored" into different stages of sleep (N1, N2, N3 which combined are referred to as NREM sleep and Stage R which is rapid eye movement sleep or REM, and Wakefulness). EEG electrode position is determined by international 10-20 system [30]. The recommended derivations are shown as Fig 2-2 [11] and brain activity in difference sleep stage is shown as Fig2-3[31].
Fig. 2- 2: The recommended derivations of EEG (a) F4-M1; (b) C4-M1; (c) O2-M1 [11]
Fig. 2- 3: Brain activities in difference sleep stage [31].
B. Electrooculogram
The electrooculogram (EOG) uses two electrodes; one that is placed 1 cm above the outer canthus of the right eye and one that is placed 1 cm below the outer canthus of the left eye. These electrodes pick up the activity of the eyes in virtue of the electropotential difference between the cornea and the retina (the cornea is positively charged relative to the retina). This determines when REM sleep occurs, of which rapid eye movements are characteristic, and also essentially aids in determining when sleep occurs. The recommended derivations are shown as Fig 2-4[47].
(a) (b)
Fig. 2- 4: (a) the recommended derivations of EOG (b) Pattern of eye movement during sleep[47].
C. Electromyogram
The Electromyogram (EMG) typically uses four electrodes to measure muscle tension in the body as well as to monitor for an excessive amount of leg movements during sleep (which may be indicative of Periodic Limb Movement Disorder, PLMD). Two leads are placed on the chin with one above the jaw line and one below. This, like the EOG, helps determine when sleep occurs as well as REM sleep. Sleep generally includes relaxation and so a marked decrease in muscle tension occurs. A further decrease in skeletal muscle tension occurs in REM sleep. A person becomes partially paralyzed to make acting out of dreams impossible, although people that do not have this paralysis can suffer from REM Behavior Disorder. Finally, two more leads are placed on the anterior tibialis of each leg to measure leg movements. The EMG electrodes are placed on the chin to record muscle tension is shown as Fig. 2-5 [47].
Fig. 2-5: The EMG electrodes position and recorded pattern of chin muscle tension [47].
D. Electrocardiogram
Though a typical electrokardiogram (ECG or EKG) would use ten electrodes, only two or three are used for a polysomnogram. They can either be placed under the collar bone on each side of the chest, or one under the collar bone and the other six
electrical activity of the heart as it contracts and expands, recording such features as the "P" wave, "QRS" complex, and "T" wave. These can be analyzed for any abnormalities that might be indicative of underlying heart pathology. The EKG electrodes are placed on the chin to record heartbeat is shown as Fig. 2-6 [47].
Fig. 2- 6: A single modified ECG Lead II, which use torso electrode placement, is recommended [47].
E. Nasal Airflow
Nasal and oral airflow can be measured using pressure transducers, and/or a thermocouple, fitted in or near the nostrils; the pressure transducer is considered the more sensitive. This allows the clinician/researcher to measure rate of respiration and identify interruptions in breathing. Respiratory effort is also measured in concert with nasal/oral airflow by the use of belts. These belts expand and contract upon breathing effort. The current guidelines recommend the use of a thermal sensor, which is placed in ht e patient’s nostril to detect the apnea; the nasal pressure transducer is used for identifying hypopnea. Ideally, both the sensor and transducer should be used. The nasal airflow sensor position and recorded data is shown as Fig. 2-7 [47].
Fig. 2- 7: Airflow sensor is placed to record breathing during sleep [47]. F. Others
Pulse oximetry helps determine changes in blood oxygen levels that often occur with sleep apnea and other respiratory problems. The pulse oximetry fits over a finger tip or an ear lobe. Snoring may be recorded with a sound probe over the neck, though more commonly the sleep technician will just note snoring as "mild", "moderate" or "loud" or give a numerical estimate on a scale of 1 to 10. A patient prepared for a polysomnogram patientis and hooked up to several monitors shown as Fig. 2-8 .You can see the electrodes next to his eyes for recording eye movement and electrodes on his chin for monitoring muscle tone. The cannula at his nose and over his mouth records airflow. He has two electrodes on his chest for recording heart rate (ECG). One stretchy belt, one on his chest, record breathing effort and Oximetry.
2.3
Methods of Data Analysis
2.3.1 Sleep Stage
According to the “AASM manual for sleep Scoring” [11], considered as the world-wide standard in the medical community, sleep staging relies on three fundamental biopotential: the brain wave activity measured by an EEG, eye movement recorded via an EOG and the muscular tone measured by an EMG. The sleep structure is represented in a dedicated graph, called hypnogram, which represents the course of sleep stages of the patient over night (see Fig. 2-9), and provides the clinician with relevant information for the diagnosis of sleep disorders.
Fig. 2- 9: Sleep stages pattern[41]
In mammals and birds, sleep is divided into two broad types: Rapid Eye Movement (REM) and Non-Rapid Eye Movement (NREM or non-REM) sleep. Each type has a distinct set of associated physiological, neurological, and psychological features. The American Academy of Sleep Medicine (AASM) further divides NREM into three stages: N1, N2, and N3, the last of which is also called delta, or slow-wave, sleep (SWS).[32]
N2 → N3 → N2 → REM. There is a greater amount of deep sleep (stage N3) early in the night, while the proportion of REM sleep increases later in the night and just before natural awakening.
The stages of sleep were first described in 1937 by Alfred Lee Loomis and coworkers, who separated the different EEG features of sleep into five levels (A to E), which represented the spectrum of wakefulness to deep sleep.[33] In 1953, REM sleep was discovered as distinct, and thus William Dement and Nathaniel Kleitman reclassified sleep into four NREM stages and REM.[34] The staging criteria were standardized in 1968 by Allan Rechtschaffen and Anthony Kales in the "R&K sleep scoring manual."[35] In the R&K standard, NREM sleep was divided into four stages, with slow-wave sleep comprising stages 3 and 4. In stage 3, delta waves made up less than 50% of the total wave patterns, while they made up more than 50% in stage 4. Furthermore, REM sleep was sometimes referred to as stage 5.
In 2004, the AASM commissioned the AASM Visual Scoring Task Force to review the R&K scoring system, which culminated in several changes, the most significant being the combination of stages 3 and 4 into Stage N3. This was published in 2007 as The AASM Manual for the Scoring of Sleep and Associated Events.[11] Arousals and respiratory, cardiac, and movement events were also added [36][37].
2.3.2 Scoring sleep by epochs
Score sleep stages in 30s sequential epochs commencing from the beginning of the study, and assign a stage to each epoch. If 2 of more stages coexist during a single epoch, assign to the stage comprising the largest portion of the epoch. Sl. The rules of sleep stages are listed as Table 4[11].
Table 4: Rules of sleep stage [11]
Stage EEG Eye blink EOG EMG
W(wakefulness) A. 8-13Hz over the occipital region
0.5-2Hz 0.5-2Hz Normal or high tone N1(NREM1) A. α wave ;low amplitude ;
Mixed frequency activity > 50 % or 4-7Hz ; Vertex sharp waves(50-150 µV) - Slow eye movements (0.25-0.5 Hz ) -
N2(NREM2) A. sleep spindles(20-100 µV;12-14Hz ) or K complexes (>100µV ; >200ms)(Fz Cz)
B. Low amplitude and no SEM
- - -
N3(NREM3 & 4 in R&K,respectively)
A. 0.5-2Hz wave > 20 % in a epoch ,and Peak-Peak >75µV (frontal region)
- absent -
R(REM) A. 2-6Hz ,low Amplitude without K complex and sleep spindles
B. Saw tooth waves
- Predominantly horizontal, and occur in repetitive bursts. Lowest level of the entire recording
a. Stage W: is defined by the presence of an alpha rhythm: there are trains of sinusoidal 8-13 Hz activity over the occipital regions and are best seen with eyes closed and attenuated with eye opening. Eye blinks appear as conjugate eye movements consisting of 0.5-2Hz present in wakefulness with eyes open or closed.
b. Stage N1: is defined by presence of slow eye movements (SEM) Conjugate, reasonably regular and sinusoidal eye movements with an initial deflection usually lasting >500ms. The EEG is low amplitude, mixed frequency activity, predominantly of 4-7 Hz. Presence of vertex sharp waves(V waves):are sharply contoured waves with duration <0.5s seen mostly over the central region and are distinguishable from the background activity. Sleep onset is defined as the beginning of the first epoch scored as any other than stage W (In most subjects, this will usually be the first epoch of stage N1).
c. Stage N2: is defined by the appearance of K complexes, which are well-delineated negative sharp waves immediately followed by a positive component standing out from the background EEG, with total duration ≥ 0.5s, usually maximal in amplitude when recorded using frontal derivations. For an arousal to be associated with a K complex, it should commence no more than 1 s after the termination of the K complex. Sleep Spindle are present in N2; there are trains of distinct waves with frequency pattern of 11-16 Hz (most commonly 12-14 Hz) with a duration ≥ 0.5s, usually maximal in amplitude in the central derivations.
e. Stage REM: Rapid eye movement sleep, or REM sleep, accounts for 20–25% of total sleep time in normal human adults. The criteria for REM sleep include rapid eye movements as well as a rapid low-voltage EEG. Most memorable dreaming occurs in this stage. At least in mammals, a descending muscular atonia is seen. Such paralysis may be necessary to protect organisms from self-damage through physically acting out scenes from the often-vivid dreams that occur during this stage.
2.3.3 Scoring apneas
The amplitude criteria for scoring an apnea are at least a 90% drop of more in the thermal sensor excursion, lasting for at least 10 s. It should be labeled as obstructive if the efforts (respiratory and abdominal continue) are seen; it should be called central if none of these excursions are seen, and mixed, if this effort is resumed toward the end of the period of apnea.
2.3.4 Scoring Hypopnea
The duration of hypopnea should be at least 10 s. The drop in the amplitude of the nasal transducer is > 30%, with a 4% drop in saturation of > 50 %, with a 3% drop in the saturation.
2.4
European Data format
The European Data Format (EDF) [28] is a simple and flexible format for exchange and storage of multichannel biological and physical signals. It was developed by a few European 'medical' engineers who first met at the 1987 international Sleep Congress in Copenhagen. The EDF logo is derived from the
congress logo which was the green pea from the fairy tale "The princess and the pea" by the Danish writer Hans Christian Andersen. With the support of Professor Annelise Rosenfalck, the engineers initiated the European (EC funded COMAC-BME) project on Sleep-Wake analysis (1989-1992). They wanted to apply their sleep analysis algorithms to each others data and compare the analysis results. So, on a morning in Leiden in April 1990, they agreed upon a very simple common data format. This format became known as the European Data Format. In August 1990, all participating labs had contributed an EDF sleep recording to the project.
EDF was published in 1992 in Electroencephalography and Clinical Neurophysiology 82, pages 391-393. Since then, EDF became the de-facto standard for EEG and PSG recordings in commercial equipment and multicenter research projects. One data file contains one uninterrupted digitized polygraphic recording. A data file consists of a header record followed by data records. The variable-length header record identifies the patient and specifies the technical characteristics of the recorded signals. The data records contain consecutive fixed-duration epochs of the polygraphic recording.
The first 256 bytes of the header record specify the version number of this format, local patient and recording identification, time information about the recording, the number of data records and finally the number of signals (ns) in each data record. Then for each signal another 256 bytes follow in the header record, each specifying the type of signal (e.g. EEG, body temperature, etc.), amplitude calibration and the number of samples in each data record (from which the sampling frequency can be derived since the duration of a data record is also known). In this way, the format
allows for different gains and sampling frequencies for each signal. The header record contains 256 + (ns * 256) bytes. Table 7 shows its detailed format.
The information in the ASCII strings must be left-justified and filled out with spaces. Midnight time is 00:00:00. The duration of each data record is recommended to be a whole number of seconds and its size (number of bytes) is recommended not to exceed 61440. Only if a 1s data record exceeds this size limit, the duration is recommended to be smaller than 1s (e.g. 0.01).
The digital minimum and maximum of each signal should specify the extreme values that can occur in the data records. These often are the extreme output values of the A/D converter. The physical (usually also physiological) minimum and maximum of this signal should correspond to these digital extremes and be expressed in the also specified physical dimension of the signal. These 4 extreme values specify offset and amplification of the signal.
Following the header record, each of the subsequent data records contains 'duration' seconds of 'ns' signals, with each signal being represented by the specified (in the header) number of samples. In order to reduce data size and adapt to commonly used software for acquisition, processing and graphical display of polygraphic signals, each sample value is represented as a 2-byte integer in 2's complement format.
Gains, electrode montages and filters should remain fixed during the recording. Of course, these may all be digitally modified during replay of the digitized recording.
Below (Table 5) is the detailed digital format of the header record (upper block, ASCII’s only) and of each subsequent data record (lower block integers only). Note that each one of the ns signals is characterized separately in the header.
Table 5: Detailed digital format of the EDF header record[28]
Field name Size Field rules Identification code 8 bytes Byte 1: "0" (ASCII) Local subject identification 80 bytes Bytes 2-8 : " (ASCII) Local recording identification 80 bytes User text input (ASCII) Start date of recording 8 bytes dd.mm.yy (ASCII) Start time of recording 8 bytes hh.mm.ss (ASCII) Number of bytes in header record 8 bytes (ASCII) Version of data format. 44 bytes (ASCII) Number of data records "-1" if
unknown
8 bytes (ASCII) Duration of a data record, in seconds 8 bytes e.g.: "1" (ASCII) Number of channels (N) in data
record 4 bytes e.g.: "257" or "128" (ASCII) Labels of the channels N x 16 bytes e.g.: "Fp1", "Fpz", "Fp2",
etc (ASCII)
Transducer type N x 80 bytes e.g.: "active electrode", "respiration belt" (ASCII)
Physical dimension of channels N x 8 bytes e.g.: "uV", "Ohm" (ASCII)
Physical minimum in units of physical dimension
N x 8 bytes e.g.: "-32768" (ASCII) Physical maximum in units of
physical dimension
N x 8 bytes e.g.: "32767" (ASCII) Digital minimum N x 8 bytes e.g.: "-32768" (ASCII) Digital maximum N x 8 bytes e.g.: "32767" (ASCII) Prefiltering N x 80 bytes e.g.: "HP:0,16; LP:500" Sampling rate N x 8 bytes e.g. "2048" (ASCII)
Chapter 3 Hardware Frameworks of
Portable Biosignal Acquisition
System
3.1
System Overview
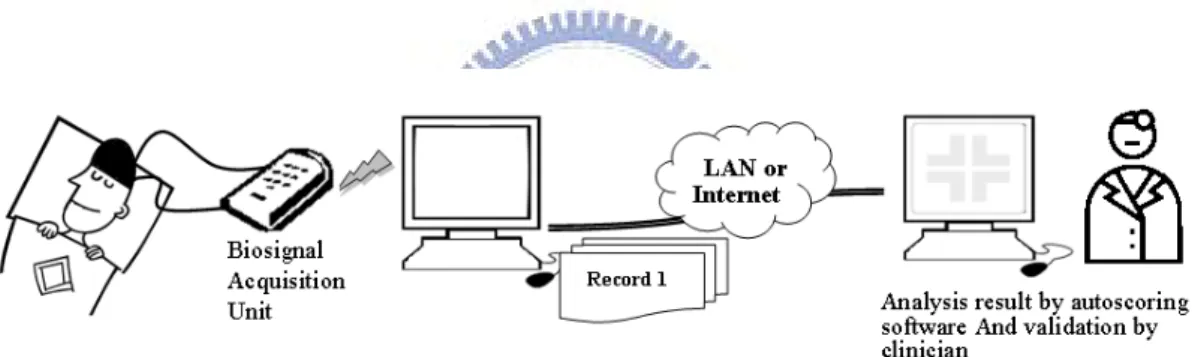
In our experimental environment, user wore a portable acquisition system developed to continually get multiple bio-signals of human during overnight sleep. This portable acquisition system is a battery-powered and wearable module. It is much easier to set-up, and provides enhanced comfort for users. First, multiple bio-signals was measured by our portable acquisition module continually. After amplifying tiny multiple bio-signals, noise except the frequency band of multiple bio-signals would be removed by filters in our portable acquisition module. And then, filtered multiple bio-signals would be digitized by analog-to-digital converter, and be transited to PC via Bluetooth. The PC-based software was development by JAVA to receive digitalized raw data from our portable acquisition module, to decode raw data, to display raw data in real-time and to save raw data in standard format .The saved records can transmit to hospital via network, and can be analyzed by autoscoring software and validated by clinician. Analysis of autoscoring software and validation of clinician provide simple way for polysomnography test, and allow patients’ sleep monitoring at their home. Using our portable PSG system is an easier, more comfortable and close way to its normal sleep habits. The part of hardware in this chapter and the part of software were described in Chapter 4. As followings, the whole system framework was shown in Fig. 3-1.
Fig. 3- 1: Framework of portable biosignal acquisition system
3.2
Portable biosignal Acquisition Unit
The portable biosignal acquisition unit combines the power, amplifier, band pass filter, ADC, wireless controller, and data encoding into one. It is a light weight, wireless monitor for recording physiological signals. It owns 7-channel bio-signal measurement, includes EEG x2, EOG x2, EMG, ECG, and airflow.
Fig. 3- 2: Voltage and frequency ranges of some common biopotential signals [38]
Fig. 3-2 showed the voltage and frequency ranges of some common biopotential signals; DC potentials include intracellular voltages as well as voltages measured
contains four parts: (1) front-end filter circuit, (2) analog to digital converter, and digital controller, (3) power management circuit and (4) wireless transmission. The diagram of the portable biosignal acquisition unit is shown as for various kinds of bio-sensors [Fig. 3-3].
Fig. 3- 3: Diagram of portable biosignal acquisition unit
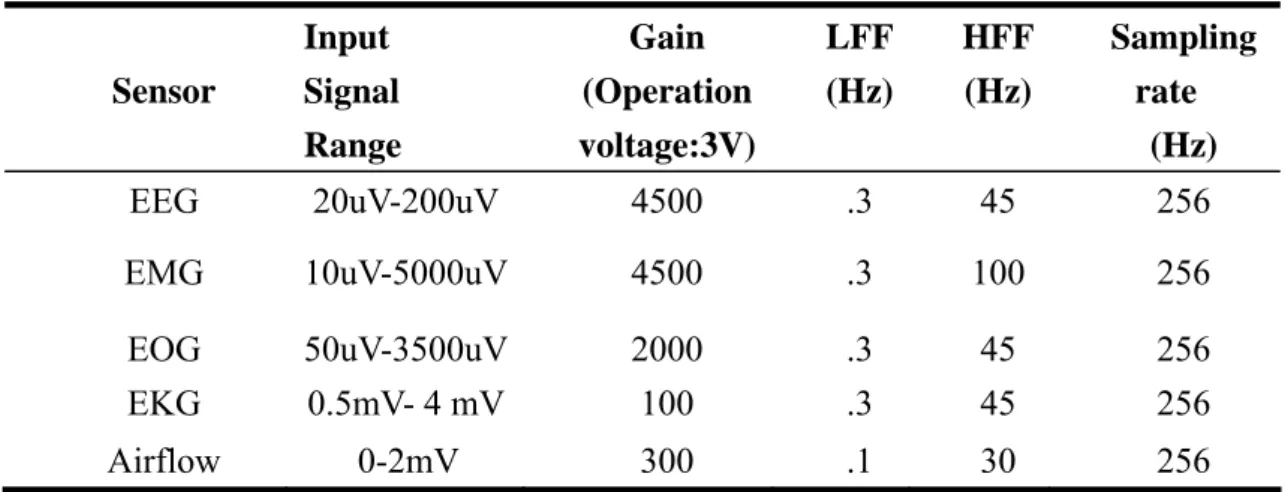
The physiological potentials were divided to electric physiological potential and nonelectric physiological potential: the electric physiological potentials are well-known as EEG, EOG, EMG, and EKG. They were amplified by bio-amplifier consisted of high-pass and low-pass filters and amplifier. And the non-electric physiological potentials are well-known as air flow, blood pressure, and temperature. They were amplified by bio-amplifier consisted of high-pass filters and amplifier. In our system, we integrated nasal pressure which is a product of Sleep mate. As well as EEG, EOG, EMG and EKG, it was amplified and organized by Micro-processor MSP430. When the signal passed through the high-pass filter, the all unnecessary low-frequency noise would be reduced or eliminated, and when they passed through the low-pass filter, all unnecessary high-frequency noise would be reduced or eliminated. According to AASM recommendations and difference physiological potentials characteristics, the specification for each channel was shown in Table 6.
Table 6: Specification for various kinds of bio-sensors Input Signal Gain (Operation Sensor Range voltage:3V) LFF (Hz) HFF (Hz) Sampling rate (Hz) EEG 20uV-200uV 4500 .3 45 256 EMG 10uV-5000uV 4500 .3 100 256 EOG 50uV-3500uV 2000 .3 45 256 EKG 0.5mV- 4 mV 100 .3 45 256 Airflow 0-2mV 300 .1 30 256
3.2.1
Multi-Channels Front-End Circuits
The front-end circuit consisted of preamplifier, and band-pass filter. To be useful biologically, all biopotential amplifiers must have high input impedance, high CMRR and low dc offset, so that they can provide minimal loading of the signal being measured. The total gain and frequency band of every channel is listed in Table 6.
a. Preamplifier:
Instrumental Amplifier (IA) is a differential amplifier and which has a high common-mode rejection ratio (CMRR) and high input impendence. A high CMRR is important in applications that the signal of interest is represented by a small voltage fluctuation superimposed on a (possibly large) voltage offset, or when relevant information is contained in the voltage difference between two signals. LT1789-1 owns an ultra low input current and a high common-mode rejection ratio (CMRR) about 96dB.Thus, LP1789-1 is chosen as the Instrumental amplifier to can provide the function of gain and high pass filter by
Fig. 3-4.
Gain = 1 + (200k/R
G)
f
0= 1 / (2 *
R
G*C)
Fig. 3- 4: The RG decides the gain of preamplifier, and the high pass filter of
preamplifier decided by RG and C.
b. Band-Pass Filter
In this thesis, it designs to use operational amplifiers to achieve the function of band-pass filter; the feature of op AMP is suitable for amplifying low-frequency signal. The AD8609 is quad micro-power rail-to-rail input and output amplifiers and low dc offset was chosen to be band pass filter. Fig.3-5 shows High-pass filter and Low-pass filter circuits. The 3dB cutoff frequency of high pass was decided by passive components R3, R4, C1 and C2.
3 4 1 2 1 2 H f R R C C π =
Fig. 3- 5: High-pass filter and Low-pass filter circuits
The passive components R7, R8, C3, and C4 decide the 3dB cutoff frequency
6 7 3 4 1 2 L f R R C C π
= .A circuit of band-pass filters and amplifier is designed as shown in Fig. 3- 5 and gain will be determined by passive components R1, R2, R5 and R7. The simulation results of each channel are shown as Fig.3-6.
Fig. 3- 6: Simulation results in each channel of amplifier and band-pass filter
3.2.2
Analog to Digital Converter and Digital Controller
For the data acquisition system, it needs a controller to organize the working of ADC and encode the digital data to wireless transmission which received from ADC.The MSP430 is particularly well suited for wireless RF or battery powered applications. The MSP430 incorporates a 16-bit RISC CPU, peripherals, and a flexible clock system that interconnect using a von-Neumann common memory address bus (MAB) and memory data bus (MDB) shown as Fig. 3-7. The clock system is designed specifically for battery-powered applications. Dedicated embedded emulation logic resides on the device itself and is accessed via JTAG using no additional system resources.We configure with built-in 16-bit Timer_A, a fast 12-bit
A/D converter, one universal serial synchronous/asynchronous communication interfaces (USART) and 4M Hz external oscillator to development our design[39].
Fig. 3- 7: MSP430 Architecture
Timer_A triggers Analog to Digital Converter, and buffers the output data of ADC until buffer full. And then all buffer data will be transmitted via USART. We will describe those modules and software configuration respectively in chapter 4.
3.2.3
Power Management
In our proposed system, the operating voltage VCC was at 3V, and the virtual ground of analog circuit was at 1.5V. LP3985 and AD8628 were used to regulate and buffer battery voltage to 3V and 1.5V. In order to provide stable 1.5V and 3V voltage, Here, The LP3985 is a micro power CMOS voltage regulator that can provide up to 150 mA of output current from a 2.5V to 6V input. And a voltage divider circuit was
the AD8628 has ultralow offset, drift, and bias current. The importance of this circuit does not come from any change in voltage, but from the input and output impedances of the op-amp. 3V output is used to provide power front end circuit, microcontroller and wireless module. 1.5V output is used to provide front end circuit as a reference voltage. The total power supply circuit is shown as Fig. 3-8.
Fig. 3- 8: Power supply circuit in data acquisition system
3.2.4
Wireless Transmission
Bluetooth® wireless technology is becoming a popular standard in the communication area, and it is one of the fastest growing fields in the wireless technologies. It is convenient, easy to use and has the bandwidth to meet most of today’s demands for mobile and personal communications. For a portable device, wireless communication is an important issue to resolve great inconvenience of using with wire transmission. Bluetooth is a wireless protocol utilizing short-range communication technology to facilitate data transmission over short distances from fixed and/or mobile devices. Bluetooth is defined as a layer protocol architecture
consisting of core protocols, cable replacement protocols, telephony control protocols, and adopted protocols”. Mandatory protocols for all Bluetooth stacks are: LMP, L2CAP and SDP. Additionally, these protocols are almost universally supported: HCI and RFCOMM. Bluetooth technology handles the wireless part of the communication Channel; it transmits and receives data wirelessly between these devices. It delivers the received data and receives the data to be transmitted to and from a host system through a host controller interface (HCI). The most popular host controller interface today is either a UART or a USB link; Bluetooth is a standard and communications protocol primarily designed for low power consumption, with a short range (power-class-dependent: 1 meter, 10 meters, 100 meters) based on low-cost transceiver microchips in each device. We choose BM0203 to be Bluetooth module; BM0203 is an integrated Bluetooth module to ease the design gap and uses CSR BuleCore4-External [40] as the major Bluetooth chip. CSR BlueCore4-External is a single chip radio and baseband IC for Bluetooth 2.4GHz systems including enhanced data rates (EDR) to 3Mbps. All hardware and device firmware of BM0203 is fully compliant with the Bluetooth v2.0+EDR specification.
3.3
Hardware System Implementation
Fig. 3- 9: The hardware of Portable biosignal acquisition unit
Fig. 3-9 is the hardware of Portable biosignal acquisition system, there are twelve leads in our portable EEG system, includes six ExG inputs, two airflow inputs, three references, and one virtual ground of the front-end analog circuit. The electrode disposal is shown as Fig. 2-2 to Fig. 2-7. The specification of Portable biosignal acquisition unit was listed in Table 7.
Table 7: The specification of Portable biosignal acquisition unit Type Portable biosignal acquisition unit Operating Temperature -40° to +85°C
Size 65 x 50 x 8 mm3
Weight 33 g(with battery)
66 g (with battery and box)
Channel Number 8
power Rechargeable Lithium 3.7V 450mAh Gain Depend on difference channel [Table 6] Bandwidth Depend on difference channel [Table 6] Input signal range Depend on difference channel [Table 6]
ADC Resolution 12bits
Power capacity 16~20hours Sampling rate 2048Hz up to 200kHz
Chapter 4 Software Frameworks of Portable
Biosignal Acquisition System
In our proposed PSG system, a microprocessor (TI MSP430) was used to perform bio-signal data acquisition in the bio-signal acquisition module and transmit digitized bio-signals wirelessly to PC via Bluetooth. The software frameworks of the whole system were listed in Fig. 4-1. It includes two major parts: the firmware in MSP 430 and software in PC.
Fig. 4- 1: Diagram of software frameworks
4.1
Firmware in MSP430
In order to avoid WDT reset the system, we close the Watchdog timer at the beginning and then set the system clock, ADC and UART interface, and the parameters of the baud rate is 115200. Timer A, ADC and UART of msp430 are the three main modules what we use. The relation between three modules is “Timer A” triggers “ADC” and the outputs of “ADC” are buffered until buffer full. And then all
shown as Fig. 4-2.
Fig. 4- 2
: Flow chart of firmware in MSP430
a. Timer A
Timer A is a 16-bit timer/counter with three capture/compare registers. It has four modes of operation as described in Table 7: stop, up, continuous, and up/down. The operating mode is selected with the MCx bits [39]. The TACCR0 CCIFG interrupt flag is set when the timer counts to the TACCR0 value. We use “up mode” to trigger enable Analog Digital Converter. The trigger rate is 256Hz.
Table 8: Timer modes
b. Analog to Digital Converter
In this system, by passing the signal through wireless, it needs an analog to digital converter to convert the continuous signal to discrete number. To suit with the filtered and amplified signal from front-end circuit, built in ADC of MSP430 was chosen to be an analog to digital converter.
Fig. 4-3 shows ADC12 Block Diagram. The ADC12 module supports fast, 12-bit analog-to-digital conversions. The module implements a 12-bit SAR core, sample select control, reference generator and a 16 word conversion-and-control buffer. The conversion-and-control buffer allows up to 16 independent ADC samples to be converted and stored without any CPU intervention [39]. The ADC12 inputs are multiplexed with the port P6 (A0-A7) pins, which are digital CMOS gates. An analog-to-digital conversion is initiated with a rising edge of the sample input signal SHI. The signal SHI will be set by interrupt routine of timer A at 256Hz. The ADC12 module is configured by three control registers, ADC12CTL0, ADC12CTL1 and ADC12MCLTx. Those registers are set to enable core, select conversion clock, set conversion mode, sample and input channels define. In our system, we used the “multiple channels, single conversion each” mode. In this mode, a sequence of channels is sampled and converted once. Each conversion requires 13 ADC12CLK cycles; include conversion and result restored into ADC12MEMx conversion memory registers. Fig 4-4 shows a diagram for sampling time and conversion time of ADC with trigger by timer A. Here, the total sampling and conversion time less then 15625 clocks. Therefore, the conversion time of ADC is fast enough to fit the requirement of the sampling rate of the whole system. The ADC result of each channel will be 12 bits long in the form of an unsigned integer whose value is:
Ax - Vr-4095*
Fig. 4- 4: Diagram of the sampling and conversion with timer A trigger
When conversion results are written to a selected ADC12MEMx, the corresponding flag in the ADC12IFGx register is set. An interrupt request is generated if the corresponding ADC12IEx bit and the GIE bit are set. After ADC12IFGx register set, the interrupt service routine of ADC started. In the interrupt service routine, we buffered ADC12MEMx. Next, a moving average filter was used to remove 60-Hz power line interference, and then filtered signal data was encoded before wireless transmission [Fig. 4-5].
Fig. 4- 5: Data format c. UART
The universal synchronous/asynchronous receive/transmit (USART) peripheral interface supports two serial modes with one hardware module. We use asynchronous UART mode. In UART mode, the USART transmits and receives
character is based on the selected baud rate of the USART. The transmit function and receive function use the same baud rate frequency. When UTXEx is set, the UART transmitter is enabled. Transmission is initiated by writing data to UxTXBUF. The data is then moved to the transmit shift register on the next BITCLK after the TX shift register is empty (UTXIFG0 =1). We set UBR00=0x22, UBR10=0x00 and UMCTL0=0xDD to fit the requirement of the baud rate: 115200 bps. But it also has some gaps that the effective baud rate is 115274 bps and the transmit errors are shown in Table 8. The results show the maximum per-bit error is about 0.1249 us (1.44%) at 4M Hz clock and the error is acceptable. Each 1
256
second, there will be 18 bytes transmitted via UART, for sending 18 byte that needs about 6000 system clock [Fig. 4-4], and it has enough time to transmit all data.
Table 9: Transmit time errors (microseconds)
event desired effective error error% start bit->D0 8.68 8.75 -0.0694 -0.80 D0->D1 17.36 17.25 +0.111 +1.28 D1->D2 26.04 26.00 +0.0416 +0.48 D2->D3 34.72 34.75 -0.0277 -0.32 D3->D4 43.40 43.50 -0.0972 -1.12 D4->D5 52.08 52.00 +0.0833 +0.96 D5->D6 60.76 60.75 +0.0138 +0.16 D6->D7 69.44 69.50 -0.0555 -0.64 D7->stopbit 78.12 78.25 -0.125 -1.44 end of stop bit 86.81 86.75 +0.0555 +0.64
d. Moving average
The moving average is the most common filter in DSP; the moving average filter operates by averaging a number of points from the input signal to produce each point in the output signal. In equation form, this is written:
1 0 1 [ ] M [ ] j y i x i j M − =
=
∑
+ ; we use this method to reduce 60-Hz power line interference. Fig 4-6 shows signal sampled at 256Hz and filtered with 4-points moving average filter. The simulation result shows the 60Hz noise becomes lower in time domain and frequency domain.Fig. 4- 6: Simulation result of moving average filter
4.2
Software in Personal Computer
4.2.1
JAVA Environment
The PSG software in PC was developed using JAVA technologies, One characteristic of Java is portability, which means that computer programs written in the Java language can run similarly on any supported hardware/ operating-system platform. One should be able to write a program once, compile it once, and run it anywhere. This is achieved by compiling the Java language code, not to machine code but to Java bytecode – instructions analogous to machine code but intended to be
hardware. End-users commonly use a Java Runtime Environment (JRE) installed on their own machine for standalone Java applications, or in a Web browser for Java applets [Fig.4-7].
Fig. 4- 7: Java environment
4.2.2
Software interface
We developed a Graphics User Interface (GUI) using Java Development Kit (JDK) 6 to monitor and record bio-signals, the GUI of the PSG system is shows in Fig. 4-8. Here, a function menu is in upper left corner, a system information board is in middle left side, a real-time display of bio-signal waveform is in right side and a form for user information is in bottom of the window. Software of our proposed PSG system is handled by five modules:
Fig. 4- 8: Software interface A. User input module
According to the EDF file format described in Table 5, in header of EDF, it has two fields need to input: Local subject identification and Local recording identification. We use KeyListener to handle and check user input. The date and time fields are provided by system. The time field is handled by a thread, stop when user push the button “start recording” and continue when user push the button “stop recording”.
B. Device discovery module
PC with Bluetooth USB dongle was used as the local device and our probable bi-signal acquisition module was used as the remote device. When user pushed the button of “Begin receiving biosignal”, the local device discovery procedure will start
events. This interface provides four methods, two for discovering devices and two for discovering services.The specification of Java TM APIs for Bluetooth was described in
JSR 82.
Fig. 4- 9: Procedure of Discovery Listener C. Input stream module
After discovering the remote device, we used Bluetooth protocol RFCOMM (Radio Frequency Communication) to exchange data between local and remote devices. The RFCOMM is made on top of the L2CAP protocol, providing emulated RS-232 serial ports. We got the Uniform Resource Locator (URL) of remote Bluetooth and opened the connection between Local Device and Remote Device, and exchange data based on RFCOMM protocol. The Java.io package was used to receive data from our portable PSG device. This package has an InputStream and OutputStream. Java InputStream is defined for reading the stream, byte stream and array of byte stream. The data format [Fig. 4-5] of software in PC coincides with firmware in MSP430.The first column of header is “0xFF” and second column is “0x62”, the rest is the data of each channel. "FF" is identifier for channel data, “62” is
representative of sample rate and the number of channels. After receiving, data of each channel was rebuilt by equation 4-1:
Channelx = Channelx low byte + Channelx high byte *256 (4-1) D. Display module
In bio-signal recording, the scientist and clinician need to know not only the bio-signal waveforms but also their amplitudes. Therefore, we restore the signal and mark the amplitude of bio-signals [Fig. 4-8], the bio-signal waveform is circular drawn using Graphics 2D on a Java JPanel, the panel shows in right side of the windows. The sampling rate of screen display was down sampled to 128 Hz, and each page shows five-second bio-signals.
E. Data record module
When user pushes the button of “start recording”, the data is recorded in two format by using java.io package. Form 1 was recorded in text form, as shown in Fig. 4-10. EEG C4-M1 CH2 O2-M1 CH3 EOGL CH4 EOGR CH5 EMG CH6 EKG CH7 Airflow Timestamp Fig. 4- 10: Record data in Text format
Form 2 is EDF file format [Table 5], which there are four fields of the header of EDF, and these 4 extreme values specify offset and amplification of the signal, the parameter of amplitude and offset is ( phy_max - phy_min ) / (dig_max - dig_min) , as listed in Table 9. In data record, each sample value is represented as a 2-byte integer in 2's complement and little endian format. Depended on the feature of EDF file format; we buffered incoming data until a second data was collected. Next, we
Flowchart of program is shown as Fig. 4-11, and EDF browse successfully read out the saved EDF file, as shown in Fig 4-12.
Table 10: The parameter of EDF header Physical minimum Physical maximum Digital minimum Digital maximum EEG -333 333 -2048 2047 EOG -702 701 -2048 2047 EMG -330 329 -2048 2047 EKG -13393 13392 -2048 2047 Airflow -4854 4854 -2048 2047
![Fig. 1-2: Alice 5 ® Diagnostic Sleep System and Pediatric Polysomnography patient [10]](https://thumb-ap.123doks.com/thumbv2/9libinfo/8594615.189905/17.892.154.731.388.666/fig-alice-diagnostic-sleep-pediatric-polysomnography-patient.webp)
![Fig. 1-3: Patient wearing the Embletta (Level III) [13]](https://thumb-ap.123doks.com/thumbv2/9libinfo/8594615.189905/19.892.259.634.544.809/fig-patient-wearing-embletta-level-iii.webp)
![Table 2: Medical and physiological parameters [29]](https://thumb-ap.123doks.com/thumbv2/9libinfo/8594615.189905/25.892.179.672.455.722/table-medical-and-physiological-parameters.webp)
![Table 3: Common band of EEG [46] Type Frequency (Hz) Delta Up to 3Hz Theta 4 – 7Hz Alpha 8 – 13Hz Beta 13 - 30Hz](https://thumb-ap.123doks.com/thumbv2/9libinfo/8594615.189905/26.892.202.677.144.292/table-common-type-frequency-delta-theta-alpha-beta.webp)
![Fig. 2-5: The EMG electrodes position and recorded pattern of chin muscle tension [47]](https://thumb-ap.123doks.com/thumbv2/9libinfo/8594615.189905/28.892.146.752.509.854/fig-emg-electrodes-position-recorded-pattern-muscle-tension.webp)
![Table 5: Detailed digital format of the EDF header record[28]](https://thumb-ap.123doks.com/thumbv2/9libinfo/8594615.189905/38.892.136.788.318.972/table-detailed-digital-format-edf-header-record.webp)
![Fig. 3- 2: Voltage and frequency ranges of some common biopotential signals [38]](https://thumb-ap.123doks.com/thumbv2/9libinfo/8594615.189905/40.892.143.748.523.917/fig-voltage-frequency-ranges-common-biopotential-signals.webp)