國立交通大學
工業工程與管理學系
碩士論文
競爭市場回收清除處理費率和補貼費率的
制定政策
Determining Advanced Recycling Fees and Subsidy
Fees in Competitive Closed-loop Supply Chains
研 究 生:李宜庭
指導教授:洪一薰 博士
競爭市場回收清除處理費率和補貼費率的制定政策
Determining Advanced Recycling Fees and Subsidy Fees in
Competitive Closed-loop Supply Chains
研究生:李宜庭 Student: Yi-Ting Lee
指導教授:洪一薰 博士 Advisor: Dr. I-Hsuan Hong
國立交通大學
工業工程與管理學系
碩士論文
A Thesis
Submitted To Department of Industrial Engineering and Management College of Management
National Chiao Tung University In Partial Fulfillment of the Requirements
For the Degree of Master in
Industrial Engineering June 2010
Hsin-Chu, Taiwan, Republic of China
中 華 民 國 九 十 九 年 六 月
i
競爭市場回收清除處理費率和補貼費率的制定政策
研究生:李宜庭 指導教授:洪一薰 博士國立交通大學工業工程與管理學系碩士班
摘要
近年來,環境保護的概念逐漸形成新的社會認知及規範,是否能妥善地處理經濟快 速發展所造成的電子廢棄物更是廣受注意,因此各國相關的環保法令便因應而生。本研 究利用 Stackelberg 模型求得回收體系參與者的最佳決策。依決策時間點而言,政府(基 管會)為先行者,其先發佈回收清楚處理費率與補貼費率的訊息,跟隨者(責任業者及資 源回收處理業者)接收訊息後,便分別制定最佳製造量及獎勵金水準。其中,為能更貼 近市場現況,我們假設消費市場及回收市場分別存在多家責任業者及資源回收處理業 者,且彼此之間存在著競爭行為。 許多國家現行的回收制度是採用收支平衡的概念進行回收基金的運用與管理,然 而,政府為非營利的組織,其應以總體社會福利為考量。本研究根據現行收支平衡的概 念以及總體社會福利最大化的目標,於相同稅收水準的假設下求得結果。接著,本研究 利用數值案例進行參數敏感度分析,探討模式可能存在的趨勢。 市場競爭者數量亦會影響到整體社會福利,本研究進一步探討回收基金管理委員會 於回收經營權發放的決策問題,以回收市場中資源回收處理業者的數量對總體社會福利 的影響為探討的主要概念,並佐以數值案例說明模式推演過程。 關鍵字:Stackelberg;回收;競爭模型;費率;回收經營權ii
Determining Advanced Recycling Fees and Subsidy Fees in
Competitive Closed-loop Supply Chains
Student: Yi-Ting Lee Advisor: Dr. I-Hsuan Hong
Department of Industrial Engineering and Management
National Chiao Tung University
Abstract
The disposal of obsolete electronics products has gained considerable attention due to environmental conservation and legislative requirements. Advanced recycling fees (ARFs) and government subsidy fees may play important roles in recycling. We present a Stackelberg-type model consistings of a leader (the Environmental Protection Administration, EPA) and two followers (MIS firms and recycling firms). MIS firms are the manufacturers, importers, and sellers. The MIS firms and recycling firms both consist of competitive entities. The EPA determines the ARFs paid by the MIS firms and subsidy fees subsidizing recycling firms to maximize the social welfare in closed-loop supply chains, where independent entities maximize their respective profit functions. Then we present a current practice model to determine the fees on the basis of fund balance between revenues and costs. We demonstrate that our results outperform the current practice by a numerical case. We also study how the EPA decides the optimal number of recycling licenses in the recycling market and illustrate the impact of the number of recycling licenses on the value of social welfare, total recycling quantity, reward money, and subsidy fees for the proposed model and the current practice model.
Key words: Advanced recycling fee; Subsidy fee; Stackelberg; Recycle; Closed-loop supply
iii
誌謝
在交大這兩年的碩士生活當中,最重要的應該算是完成了這篇碩士論文。在 寫作的過程當中,幫助我最大,最要感激及敬佩的就是指導教授洪一薰老師。從 大學時期的專題指導到碩士論文的完成,洪一薰老師總是非常有耐心的教導我, 在每次的討論也都給予我很多的意見幫助我完成論文。在論文寫作的方面,洪一 薰老師總是不厭其煩地叮嚀指導,使得我的寫作技巧進步許多。此外,洪一薰老 師也時時刻刻提醒我們該如何做好一個研究,甚至是告訴我們以後面對職場應有 的態度。另外,我也要感謝口試委員許錫美老師、陳文智老師、以及蘇哲平老師 給我非常寶貴的意見,幫助我了解論文不足的部分,使得論文能更趨向完整。 在這兩年當中,幫助我、要感謝的人實在太多了。同一個實驗室一起奮鬥的 夥伴們,大學長鄧志鋒、學姊王景芳、小學長葉潤生及柯志賢、帥氣的林峻銘、 美麗的佩宜以及 cos。也要感謝一起奮鬥的好朋友易維君、毓娟、雅雯在這兩年 來的陪伴與分享,還有陪伴我度過許多開心以及不開心、幫助我的阿胖。最後, 要感謝我的家人,特別是爸爸媽媽的支持、栽培、以及照顧,讓我在求學的路上 一路順遂。 即將要離開新竹,離開這個充滿六年回憶的交大。對新竹、交大、管二、工 工系都有一份深厚的情感。那些一起奮鬥睡在教室的營隊生活,假日相約各處玩 樂的生活,期末考、寫論文一起奮鬥的生活…好多好多。驪歌響起,心中著實充 滿許許多多的捨不得。很開心能認識這裡的人事物,雖然即將離開,但我相信對 這份土地及朋友們的感情一定會更加深厚。這六年滿滿的回憶,將是我人生當中 一個很棒的禮物! 李宜庭 誌于 風城交大 中華民國九十九年六月iv
Table of Contents
摘要... i Abstract ... ii 誌謝... iii Table of Contents ... iv List of Figures ... v List of Tables ... vi Chapter 1 Introduction ... 1Chapter 2 Literature Review ... 5
2.1 The Current Situation of Recycling Policy ... 5
2.2 The Instruments of Environmental Policy ... 7
2.3 The Competitive Market ... 10
Chapter 3 The Model ... 13
3.1 Supply Chain Flows ... 14
3.2 The Social Welfare Model ... 15
3.2.1 The Model of MIS Firms ... 16
3.2.2 The Model of Recycling Firms ... 19
3.2.3 The Model of the EPA ... 22
3.3 The Fund Balance Model ... 28
3.3.1 The Model of MIS ... 28
3.3.2 The Model of Recycling Firms ... 29
3.3.3 The Model of the EPA ... 30
Chapter 4 Case Study and Numerical Analysis ... 34
4.1 The Case Study and the Numerical Results ... 34
4.2 Sensitivity Analysis ... 37
4.3 Analysis of the Recycling Market... 41
Chapter 5 Recycling Licenses ... 46
5.1 The Model of Homogeneous Recycling Firms ... 46
5.1.1 The Social Welfare Model ... 47
5.1.2 The Fund Balance Model ... 49
5.1.3 The Optimal Number of Recycling Licenses ... 51
5.2 Case Study ... 52
Chapter 6 Conclusion and Future Research ... 55
References ... 58
v
List of Figures
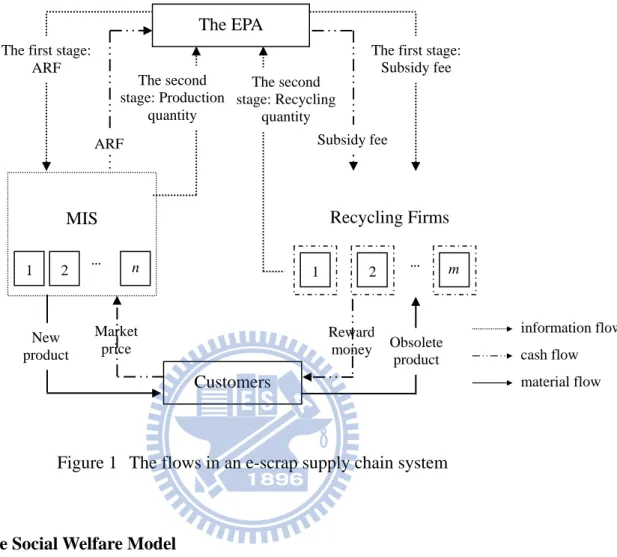
Figure 1 The flows in an e-scrap supply chain system ... 15
Figure 2 The consumer surplus in the consuming market and in the recycling market ... 23
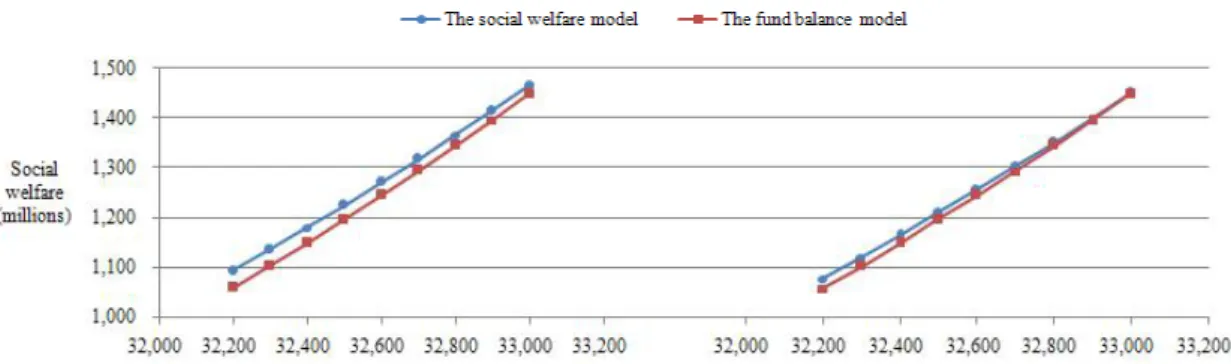
Figure 3 Impact of a and b on the value of social welfare ... 38
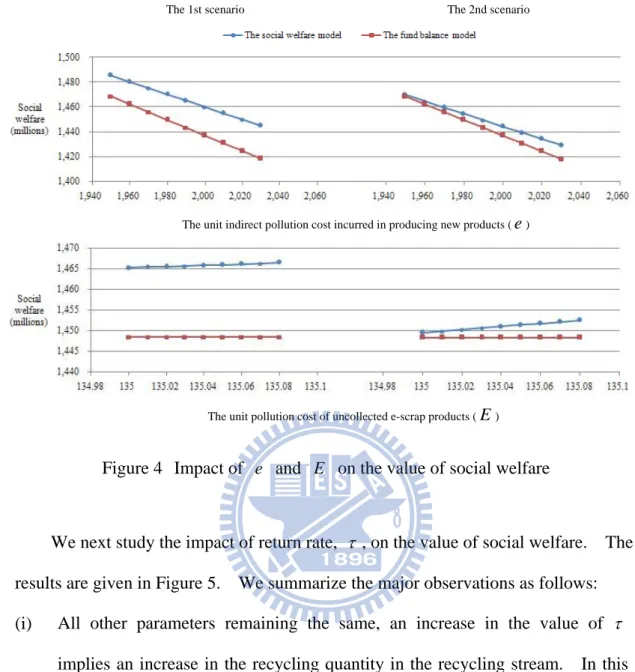
Figure 4 Impact of e and E on the value of social welfare ... 40
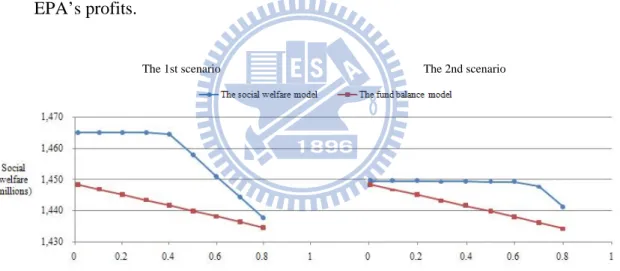
Figure 5 Impact of on the value of social welfare ... 41
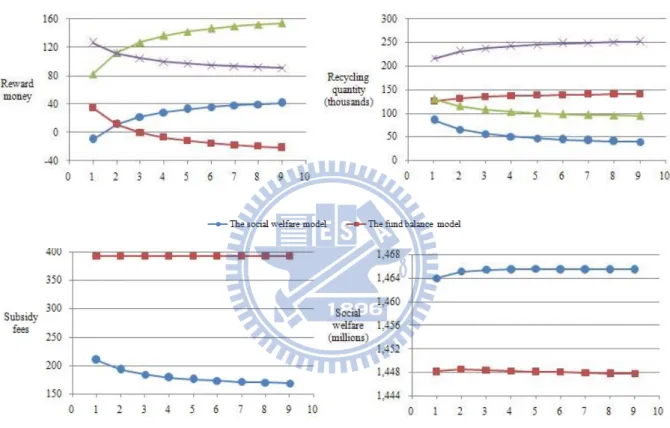
Figure 6 Impact of c2/c1 on reward money, recycling quantity, subsidy fees, and the value of social welfare ... 43
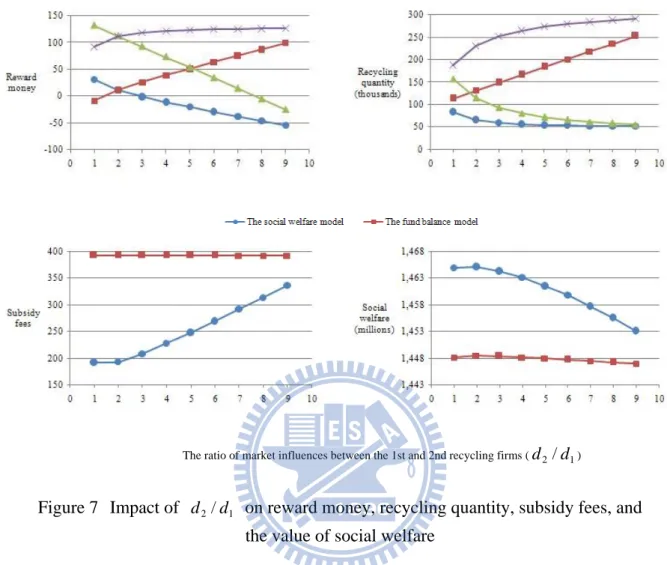
Figure 7 Impact of d2/d1 on reward money, recycling quantity, subsidy fees, and the value of social welfare ... 45
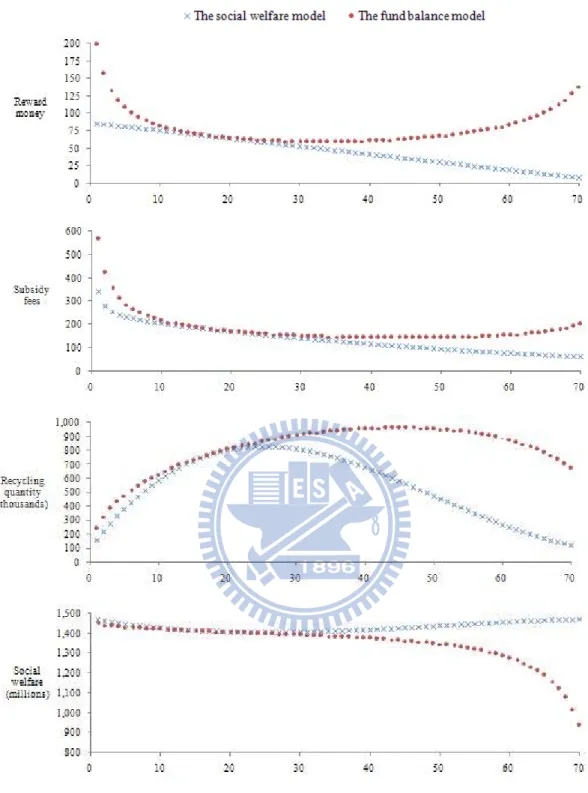
Figure 8 Impact of m on subsidy fees, reward money, total recycling quantity, and the value of social welfare ... 54
vi
List of Tables
1
Chapter 1 Introduction
The vast consumption of consumer electronics raises the burden on the environment due to the huge amount of obsolete products after usage. The influence of pollution from obsolete electronics products, known as scrap electronics (e-scrap), on the environment is self-evident since they contain metals and other materials that can be hazardous to the environment if they are not properly managed after usage. According to the U.S. Environmental Protection Agency (EPA) study, 40% of the lead in the U.S. landfills is from discarded e-scrap products (DFC, 2009). E-scrap has increased rapidly worldwide. For instance, in developed countries, the average lifetime of a computer is 6-year in 1997 but 2-year in 2005; this change leads to a ballpark number of annual e-scrap generation ranging from 20 to 50 million units (Greenpeace, 2009). In Taiwan, there are about two million e-scrap products recycled according to the Taiwan EPA’s statistical data in 2009 (RFMB, 2009a).
In order to relieve the damage to the environment, several regulations are announced. For instance, Waste Electrical and Electronic Equipment (WEEE), Restriction of Hazardous Substances Directive (RoHS), and Eco-Design Requirements for Energy Using Products (EuP) are announced by the European Union. The WEEE indicates that manufacturers bear the responsibility for collecting, recycling, and disposing e-scrap products properly. The RoHS forbids using some specific hazardous substances as raw materials to produce new products. The EuP provides the rules for eco-design to improve the environmental performance of energy-related products (Yen, 2006).
2
In general, forward supply chains may involve the manufacturing/importing/selling processes of new products, and reverse supply chains may include the reuse/recovery/recycle operations of end-of-life products. In the past decade, much attention has focused on designing proper forward and reverse (closed-loop) supply chains. For example, Fleischmann et al. (2000) derive a classification scheme for different types of recovery networks by comparing the general characteristics of product recovery networks with traditional logistics structures. Guide and Harrison (2003) indicate that new business models need to be developed by cooperating between industry and academia. Wang and Yang (2007) propose a new mixed integer linear programming model to maximize the overall utilization and revenue for designing an e-scrap reverse logistics network. Hong et al. (2006) propose a mixed integer linear programming model to design an infrastructure to process used televisions, monitors, and computer central processing units in the state of Georgia in the U.S to maximize the system net profit, and then robust solution are found with a min–max robust optimization methodology.
Recycling is a part of the operations in reverse supply chains. It not only decreases the consumption amount of natural resources, but also reduces the impact of obsolete products on the environment. Many researchers have proposed recycling models that maximize total profits and recycling rates by using mathematical programming methodologies (e.g. Inderfurth et al., 2001; Stuart et al.,1999; Uzsoy and Venkatachalam, 1998; Hoshino et al., 1995; Ron and Penev, 1995). Several countries make associated policies to manage the recycling system. For example, the Taiwan EPA imposes taxes, called tax revenues, on the manufacturers, importers and sellers (MIS firms) who are players in forward supply chains. The MIS firms have to pay the e-scrap products processing fee, named as advanced recycling fee
3
(ARF) to support the implement of recycling. On the other hand, consumers may bring the e-scrap products to recycling firms and then receive some reward money paid by the recycling firms. To compensate recycling firms for the costs along with recycling and processing the e-scrap products, the EPA uses the tax revenues to subsidize the recycling firms on the basis of fund balance. The ARF in Taiwan is designed in a similar way to the ARF enacted in California, U.S. The state of California assigns an ARF of $8-$25 on all e-scrap products containing hazardous materials depending on the viewable screen size (CalRecycle, 2009). The California EPA uses the tax revenues to establish the Department of toxic substances control (DTSC) besides compensating the recycling firms for the recycling costs incurred. The DTSC is responsible for inspecting the products for hazardous materials (Gable and Shireman, 2001). Canada and Japan have implemented similar programs (Hicks et al., 2005; HP, 2005; Lee et al., 2000; Shih, 2001; Wen, 2005a). However, the EPA is a non-profit organization. It should consider the total social welfare when making policies. It is reasonable to view the EPA as a role of the government, so our model aims to maximize the total social welfare associated with all participants. In general, the social welfare may be defined as the sum of producer surplus, consumer surplus, tax/subsidy revenue, and the environmental externality cost (Bansal and Gangopadhyay, 2003; Hong et al., 2007).
Our modeling framework assumes that the government establishes the associated fees to maximize social welfare and not the fund balance objective in a competitive system. We further assume that the government considers the fees public information and that the associated players select the optimal response to the government-determined rates. Hence, this thesis presents a Stackelberg-type model where the government is a leader to determine the ARFs and subsidy fees, and parties
4
such as MIS firms and recycling firms are the followers, who are competitive participants respectively. The number of recycling firms may affect the value of social welfare, so it is important for the EPA to determine the number of recycling licenses. Therefore, we study how the EPA determines the optimal number of recycling licenses. In this research, we address the following questions:
(i) Is the concept of fund balance the ideal method for determining the level of ARFs and subsidy fees in a competitive system?
(ii) What are the socially optimal ARFs and subsidy fees?
(iii) How might the associated players behave in a competitive system?
(iv) How might the government behave when it determines the number of recycling licenses?
The rest of this thesis is organized as follows. In Chapter 2, we review the current environmental policies and the associated instruments. In Chapter 3, we present the social welfare model and fund balance model. Then we solve the optimization problems of these two models for the equilibrium ARFs and subsidy fees established by the EPA and the decisions made by the MIS firms and recycling firms respectively. In Chapter 4, we utilize a case study to examine the difference in the performance measures between the proposed social welfare model and the current practice model. In Chapter 5, we study the impact of the number of recycling licenses on the value of social welfare, total recycling quantity, reward money, and subsidy fees in the recycling market for the social welfare model and the fund balance model. We conclude this thesis in Chapter 6.
5
Chapter 2 Literature Review
Proper management and recycling of e-scarp products become a challenging issue nowadays. Many countries pay much attention to make associated policies. We review some recycling policies enacted or implemented and the associated instruments in Section 2.1 and 2.2. In this thesis, our model for determining ARF and subsidy fees is to assume that there is a competitive market in closed-loop supply chains. We review some literatures related to the competitive market in Section 2.3.
2.1 The Current Situation of Recycling Policy
In order to effectively regulate the resource recycling activities, there is official regulation on recycling in more and more countries. In 1970, the U.S. EPA was established to encourage reduce/reuse/recycle programs (USEPA, 2009a). The Taiwan EPA established the Recycling Fund Management Board (RFMB) in 1998 for governing the receipt and reimbursement of ARF and subsidy fees, discussing with the recycling firms, subsiding local governments in recycling, and promoting resource recycling activities (RFMB, 2009b).
The implement of extended producer responsibility (EPR) makes manufacturers responsible for the entire lifecycle of the products (Waste to Wealth, 2009). Several countries adopt the concept of EPR and shift the responsibility of recycling on manufacturers. For instance, the Resource Conservation and Recovery Act (RCRA), enacted in 1976, is the principal federal law in the U.S. The RCRA governs the disposal of solid waste and hazardous waste (USEPA, 2009b). Germany issued a
6
regulation called “The closed-loop Economy and Waste Management Act” in 1992. The regulation makes industry responsible for collecting and recycling its products (Fishbein, 1994). In 2002, the Japan Environmental Management Association for Industry (JEMAI) launched “Type III eco-labeling program” which provides quantitative environmental information on products. The program aims to motivate industry to develop, produce and sell eco-friendly products (JEMAI, 2009). In 2006, South Korea tried to carry out “The Act for Resource Recycling of electrical/Electronic Products and Automobiles” which presides over the entire span of product life cycle to promote recycling and restrict the use of hazardous substances from the designing stage of electrical/electronic products and automobiles (IDBMEA, 2009). There are some literatures in support of law enforcement. Foulon et al. (2002) indicate that certain regulation standards need to be imposed to reflect current social responsibility. Chen and Sheu (2009) conclude that governments should gradually raise regulation standards, then the manufacturers gradually improve their product environmental quality, and EPR gets promoted simultaneously.
Other policies involved recycled material flows include taxation and subsidization. Fullerton and Wu (1998) use a simple general equilibrium model to analyze the subsidies for recyclable designs. Conrad (1999) uses a comparative statics analysis to show the impact of a resource and waste taxation on the market volume and the number of firms. Kulshreshtha and Sarangi (2001) show that when consumers bring the reusable part of a product to recycling firms, they must pay a deposit that is subsequently refunded. Bansal and Gangopadhyay (2003) compare different government policies, which are uniform subsidy policy, uniform tax policy, discriminatory tax policy, and discriminatory subsidy policy, and show that a
7
discriminatory subsidy policy is the social welfare improving and also mitigates total pollution. Fullerton and Wolverton (1997) combine environmental subsidy with presumptive tax to propose two-part instrument. The environmental subsidy is provided only to the extent that consumption goods are recycled or that production uses a clean technology, while a presumptive tax is a tax which is imposed under the presumption that all consumption goods become waste or all production uses a dirty technology, which is cheap but, for a given pollution level, it is generally associated with large environmental and enforcement costs (Arguedas, 2005). Two-part instrument internalizes external costs by imposing taxes on the products. Simultaneously, two-part instrument encourages recycling firms to proceed with associated recycling actions through subsidization.
Combining the concept of EPR and two-part instrument, the Taiwan EPA imposes ARFs as recycling funds on MIS firms and then uses the funds to enhance recycling, e.g., subsidizing recycling firms (RFMB, 2009c). On the other hand, recycling firms may compensate the customers, who bring e-scrap products to recycling firms, with a certain amount of reward money to encourage recycling willingness. Similar programs implemented in several other countries can be found in (Hicks et al., 2005; Lee et al., 2000; Wen, 2005a).
2.2 The Instruments of Environmental Policy
Planning and modeling for forward and reverse supply chains have received a growing amount of attention in the past decade. Realff et al. (2004) develop a robust-mixed-integer linear programming model to study a large-scale carpet recycling problem. Nagurney and Toyasaki (2005) construct the multitiered
8
e-cycling network equilibrium model and establish the variational inequality
formulation to provide both qualitative properties of the equilibrium pattern as well as
numerical examples that are solved using the proposed algorithm. Sheu et al. (2005)
consider the used-product return ratio and corresponding subsidies from governmental
organizations for reverse logistics to formulate a linear multi-objective programming
model. The model optimizes the operations of both integrated logistics and
corresponding used-product reverse logistics. They further use a numerical example
to indicate that the chain-based aggregate net profits can be improved by 21.1% using
the proposed model, compared to the existing operational performance in the
particular case studied. Hong et al. (2006) design an infrastructure to process used
equipments such as televisions, monitors, and computers in the state of Georgia in the
U.S. Wang and Yang (2007) propose a new mixed integer linear programming
model to design an e-scrap reverse logistics network. Yang et al. (2009) develop a
model of a general closed-loop supply chain network to optimize the equilibrium state
of the network by using the theory of variational inequalities. The supply chain
network includes raw material suppliers, manufacturers, retailers, consumers and
recovery centers. Lee and Dong (2009) propose dynamic location and allocation
models to demonstrate the significance of the developed model as well as the
efficiency of the proposed solution method. These studies may help the EPA to
promote recycling and monitor the whole recycling system.
Several literatures have proposed various environmental instruments in order to reduce the burden of products on the environment. Pigou (1920) proposes the concept of economic externalities and Pigovian tax. A Pigovian tax is a tax imposed on a non-market activity which causes negative externalities. Jung et al. (1996) internalizes environmental pollution costs by imposing taxes on enterprises to study
9
the incentives for advanced pollution abatement technology at the industry level. In 2008, the Canadian province of British Columbia announced that it was going to impose a carbon tax, which is used for achieving the environment conservation by reducing the emissions of carbon dioxide, of $10 on per metric ton of carbon dioxide equivalent emissions (Canada, 2009). However, it is difficult to estimate and control the environmental externality cost. Cremer and Thisse (1999) indicate that a country may spend much money on estimating environmental externality cost. Hence, the concept of a Pigovian tax is difficult to be implemented in practice. On the other hand, the required data of imposing presumptive taxes on income are price and demand. Because the required data of imposing presumptive taxes are more available and correct than the required data of imposing Pigovian taxes, the concept of presumptive tax is adopted in some associated literatures. Bansal and Gangopadhyay (2003) study policy measures to improve environmental quality. Besides, Bansal and Gangopadhyay (2003) also focus on the manufacturers, who do not place much importance on environmental conservation, and then impose taxes on the products according to their production quantity.
Many economists consider that the concept of subsidization should be added into the environmental instruments because the economic incentives are not powerful influences on recycling while the government imposes taxes only on the MIS firms. For example, Fullerton and Wolverton (1997) build two simple general models to demonstrate that two-part instrument is easier to implement compared to the Pigovian tax. Bansal and Gangopadhyay (2003) find that a uniform subsidy policy improves the average environmental quality while a uniform tax policy worsens it, and a discriminatory subsidy policy reduces total pollution and enhances aggregate welfare while a discriminatory tax policy may increase total pollution and reduce aggregate
10
welfare. Wen (2005b) proposes that the recycling firms are willing to invest in recycling equipment with a discriminatory subsidy policy. Furthermore, there are some literatures which combine taxation with subsidization to propose different objective functions. Wen (2005a) integrates the model of Fullerton and Wolverton (1997) into the recycling system and explains that the social welfare can be achieved if the government imposes taxes on the MIS firms while subsidizing recycling firms for the costs caused by processing the obsolete products.
2.3 The Competitive Market
Researches on recycling policy are mainly based on a single company model where each participant, such as the MIS firms or recycling firm is a single entity (Fullerton and Wu, 1998; Choe and Fraser, 2001; Stavins, 2002). However, there are different numbers of firms competing in the real-world. In a competitive market, independent entities maximize their own profit functions respectively and are unwilling to reveal private information to others.
The assumptions of emerging literatures on reverse supply chains are mostly assumed to be competitive. Jung et al. (1996) evaluate the incentive effects of five environmental policy instruments, which are performance standards, emissions subsidies, emissions taxes, and issued and auctioned marketable permits, to promote the development and adoption of advanced pollution abatement technology in a heterogeneous and competitive industry. Kfiberger and Karlsson (1998) propose that the data, which is from specific, contracted electricity production plants, should be used for electricity consumption in lifecycle analysis. And the electricity is purchased from a competitive market. Majumder and Groenevelt (2001) present a
11
two-period model to examine the effect of competition in remanufacturing. Mitra and Webster (2008) also analyze a two-period model of a manufacturer and a remanufacturer and show that the introduction of partial subsidies increases both manufacturer’s and remanufacturer’s profits. Chen and Sheu (2009) design proper environmental-regulation pricing strategies for green supply chain firms in a competitive market.
A literature survey reveals little research on how ARF and subsidy fees are determined in a competitive market where there are several individual firms in each tear. Hong et al. (2007) view the MIS firms and recycling firms as two separate parties. In the real-world, there are several firms competing in the tiers of MIS firms and recycling firms. In this research, we study how the EPA establishes the best associated fees when there are many MIS firms and recycling firms.
For some industries, the enterprises have to be granted legal licenses by the government. The competitiveness between enterprises may be induced by the number of licenses (Jehiel and Moldovanu, 2000). Jehiel and Moldovanu (2000) analyze the interplay between the number of 3G licenses and the market structure in a model with several incumbents and several potential entrants. They show that plausible conditions under which all incumbents get a license, and more licenses need not result in greater competitiveness if the number of incumbents is greater than the number of new licenses. In e-scrap reverse supply chains, the EPA uses the ARFs paid by the MIS firms to compensate recycling firms for the operational and recycling costs incurred, and the recycling firms have to possess legal recycling licenses to obtain subsidies from the government for costly recycling operations. For example, the Taiwan recycling firms are required to be granted recycling licenses and then
12
subsidized by the EPA (RFMB, 2009d). In this thesis, we study how the EPA determines the optimal number of recycling licenses in a recycling market to maximize the social welfare
13
Chapter 3 The Model
We present a Stackelberg-type model to describe a competitive closed-loop (forward and reverse) supply chain system consisting of the government (EPA), manufacturers, importers, or sellers (MIS firms), and recycling firms (rec). The MIS represents the associated entities involved in forward supply chains, and the recycling firms include collection, consolidation, or processing sites in reverse supply chains. The EPA determines ARFs and subsidy fees to maximize social welfare, and the MIS firms and recycling firms seek their own objectives which respond to the EPA-determined rates. It is reasonable to assume that the EPA acts as leader, and the MIS firms and recycling firms are two followers. In this thesis, we refer to the model proposed in Section 3.2 as the social welfare model.
According to the current practice, the EPA determines ARFs and subsidy fees on the basis of fund balance between revenues and costs along with recycling operations. For comparative purposes, we construct a fund balance model, where the total revenue the EPA collects equals the EPA’s total expenditure, to use as a benchmark to compare with the social welfare model. The fund balance model is described in Section 3.3.
The major difference between these two models is the objective function where the social welfare model aims to maximize the social welfare and the fund balance model determines the ARFs and subsidy fees on the basis of fund balance between tax revenues and subsidy expenditures along with recycling operations.
14 3.1 Supply Chain Flows
There are three key elements describing our supply chain system: material, cash, and information flows. In this thesis, we assume that a supply chain consists of three groups: MIS firms, customers, and recycling firms. In general, the MIS firms may act as manufacturers, importers, or sellers selling electronics products to customers. After usage, customers may bring obsolete products to recycling firms which remanufacture or recycle the e-scrap products and convert them into recovery materials as well as some accompanying trash. We reasonably assume that the MIS firms exist in one market. For example, there are different MIS firms in Taiwan market for laptop computers; that is, the MIS firms exist in a competing market. On the other hand, we reasonably assume thatthe recycling firms exist in distinct market segments or distinct geographic locations (Hong et al., 2008). About the cash flow, when the MIS firms manufacture, import, or sell electronics products, they pay the ARFs according to electronics production quantity, in support of the implementation of e-scrap recycling. On the other hand, the EPA uses the ARFs to subsidize recycling firms according to recycling quantity for the operational and recycling costs incurred. Then recycling firms may compensate customers with a certain amount of reward money to encourage recycling behavior. There are two stages describing the information flow according to the timeline. The first stage is that the EPA announces the ARFs and subsidy fees to the public. The second stage is that the MIS firms and recycling firms determine their own optimal policies after observing the rates announced by the EPA. In particular, we assume that the MIS firms and recycling firms both consist of independent and competitive entities respectively. Each entity maximizes its own profit function and is unwilling to reveal its private information to others. The flows of these three elements are represented in Figure 1 where there are
15
n and m entities in the tier of the MIS firms and recycling firms, respectively.
Figure 1 The flows in an e-scrap supply chain system
3.2 The Social Welfare Model
The EPA is a unit of the government and it is reasonable to assume that the EPA should consider the social welfare when it makes policies. We present a Stackelberg-type model in a competitive reverse supply chain where each participant independently acts according to its own interests. The leader considers the followers’ potential decisions by anticipating followers’ behavior, and then makes its optimal policy. The followers may make their optimal policies according to the policy announced by the leader.
In addition, we note there are two markets in the proposed model: one is the
information flow cash flow material flow The EPA
Customers The first stage:
ARF
The first stage: Subsidy fee The second stage: Production quantity The second stage: Recycling quantity
ARF Subsidy fee
Reward money New
product Obsolete product
MIS 1 2 … n Recycling Firms 1 2 … m Market price
16
consuming market, where new products are sold to customers, and the other one is the recycling market, where obsolete products are brought to recycling firms for recycling. We assume that there are competitive participants in the consuming market and in the recycling market. Furthermore, each participant aims to maximize its profit. It is reasonable to assume that the number of participants and the profit function of each participant are common knowledge - a typical assumption in the game-theoretically type model (Gibbons, 1992). Our model can be classified as a two-stage dynamic game of complete information. A common method for solving this problem is the backward induction technique, which is the process of reasoning backwards in time, from the end of a problem, to determine a sequence of optimal actions (Von Neumann and Morgenstern, 1994). In this study, we apply the backward induction to solve the proposed model.
3.2.1 The Model of MIS Firms
We first construct the MIS model to determine the electronics production quantity given the ARFs announced by the EPA. We assume the market, where the electronics products are manufactured, imported, and sold, consists of n MIS firms
and each one aims to maximize its own profit. In addition, the MIS firms make their decisions simultaneously.
Let q denote the i th MIS firm’s production quantity,xi i 1, 2, 3,...,n. The
total demand in the market, Q , are the sum of MIS firms’ production quantity, that is, x 1 i n x x i Q q
. Assume that the total demand is characterized by a commonly-used linear demand function, Px a bQx, where Px is the market price, a is the17
intercept parameter, and b is the slope parameter, a b, 0. It means that when one unit of products is produced, the market price is decreasing in b units of market price. In other words, if b is a large number, the market price may decrease rapidly with increasing production quantity. A linear form of the inverse demand function helps us obtain qualitative insights without much analytical complexity.
The MIS firms’ production processes and skills are different, so the unit production cost of each MIS firm is reasonable assuming non-identical. Let Cvi be the ith MIS firm’s unit production cost. In addition, the MIS firms pay the ARF, denoted by t per unit of products, in support of the implementation of the recycling program. The profit function of the ith MIS firm, denoted by MISi, is
0 1
Max i ( i ) i.
xi
MIS x v x
q P C t q (3.1)
It is reasonable to assume that the number of MIS firms and each MIS firm’s profit function are common knowledge among all MIS firms. Equation (3.1) may be transformed into a one-variable function. Substituting the demand function,
x x P a bQ , in (3.1) results in 0 1 Max1 i ( i i ) i. xi n MIS x v x q i a b q C t q
(3.2)The profit function (3.2) is concave in qxi, whenever b 0, so (3.2) is maximized
when the first-order condition holds, i.e. when
* * 1 1 . 2 i i j n x v x j j i q a t C b q b
(3.3)Equation (3.3) specifies each MIS firm’s best response to the information announced by the EPA, i.e. the level of the ARFs, t. In game theory, the Nash equilibrium is a solution concept of a game involving two or more players, in which no player has incentive to deviate from his/her action given that the other players do not deviate.
18
In other words, in the Nash equilibrium solution, no one can be better off by a unilateral change in its solution (Gibbons, 1992). According to the concept of the Nash equilibrium, we combine these n best response equations to n -variable
simultaneous equations to solve for the equilibrium solution. First, we add up these
n equations, i.e. (3.3), together and solve for the total demand as follows:
* * 1 1 1 . 2 i n x v x i Q n a t C n bQ b
(3.4) Rewriting (3.4), we have
* 1 1 . ( 1) i n x v i Q n a t C n b
(3.5) Substituting * * 1 i n x x i Q q = =å
in (3.3), we have * * . i i v x x a t C bQ q b (3.6)Substituting (3.5) in (3.6), we obtain each MIS firm’s best response to t .
* 1 1 ( 1) i i j n x v v j j i q a t nC C n b
(3.7)Equation (3.7) specifies the ith MIS firm’s optimal production quantity after it observes the level of the ARF, t, announced by the EPA. In other words, the MIS firm’s production quantity, q , is a function of the ARF rate, *xi t, and (3.7) can be
rewritten as *( )
i
x
q t . In addition, substituting (3.5) in the demand function results in
the market price.
* 1 1 ( 1) i n x v i P a nt C n
(3.8)19 3.2.2 The Model of Recycling Firms
Now consider the model of recycling firms to determine the rate of reward money given the level of subsidy fee announced by the EPA. Recycling firms may compensate customers, who bring e-scarp products to recycling firms, with a certain amount of reward money to encourage recycling after usage. A reasonable customer is more willing to bring e-scarp products to the recycling firms with higher rewards, so we assume that the relationship between the recycling quantity and reward money is positive, linear in a competitive market where there are m recycling firms. From (Hong et al., 2008), we understand that recycling firms usually collect e-scrap products in distinct market segments or distinct geographic locations. Moreover, different market areas cannot be simplified as one single market, so we let cj and
j
d denote the jth recycling firm’s market intercept parameter and slope parameter respectively, j 1, 2,,m . Intuitively, high reward money may increase customers’ willingness to bring e-scrap products to recycling firms.
The reward money determined by other recycling firms may affect the jth recycling firm’s recycling quantity. In addition, the customers’ recycling behavior is influenced by not only the amount of reward money but also other factors such as the residential regions. For example, a customer may not bring e-scrap products to the recycling firm, whose location is far away from the customer’s location, even if its reward money is high. Therefore, we let j
l
k denote the decrease in the recycling quantity in the jth recycling firm caused by a unit of increase in the reward money paid by the l th recycling firm, klj 0 . Let Pwj and qcj denote the j th
20 The relationship is listed as follows:
1 . j j l m j c j j w l w l l j q c d P k P
(3.9)We refer to (3.9) as the recycling quantity function. Similar modeling ways to (3.9) can be found in (Gibbons, 1992; Toyasaki et al., 2008; Majumder and Groenevelt, 2001).
Recycling firms have respective skills and processes, so the unit processing cost of recycling firms is not identical. Let rj denote the jth recycling firm’s net cost
for recycling one unit of e-scrap products, rj 0. On the other hand, recycling
firms’ revenues are the subsidy fees subsidized by the EPA. Let s denote the subsidy fee per unit of e-scrap products. The profit function of the jth recycling firm is 01 Max j ( j) j. w j rec j w c P s r P q (3.10)
It is reasonable to assume that the number of recycling firms and each recycling firm’s profit function are common knowledge among all recycling firms. Like the MIS firms, recycling firms simultaneously make their own decisions. Substituting (3.9) in (3.10), the profit function is concave in
j
w
P , whenever dj 0. Equation (3.10)
is maximized when the first-order condition holds, i.e. when
* * 1 1 ( ) + . 2 j l m j w j j j l w j l l j P d s r c k P d
(3.11)Let the yth recycling firm represents one of the recycling firms, and it is not the jth recycling firm, y 1,, j1, j1,,m. From (3.11), the yth recycling firm’s best response to s is
21 m * * 1 1 ( ) + . 2 y l y w y y y l w y l l y P d s r c k P d
(3.12)Subtracting (3.12) from (3.11), we have
* * * 1 , 2 + 1 . 2 + y j l j y y w j j j m w y y j l j j y y y w l l l j y d k P d s r c P d k d s r c P k k
(3.13)From (3.13), we obtain the relationship between the jth and yth recycling firms’ decisions where the yth recycling firm can be viewed as one of any particular recycling firm other than the jth recycling firm. If we directly use (3.13) to solve for the reward money response to s, we cannot find a closed-form solution of reward money. In order to simplify this model, we assume that the parameter j
l
k is set according to the market situation. More specifically, j
l
k is set according to the size of the market area where the lth recycling firm exists in the recycling market. Therefore, the parameter j
l
k is a fixed value while l is fixed and j is one of the other recycling firms; that is, j
1, 2,,l 1,l 1,,m
. From this condition follows Assumption 1.Assumption 1 We let the value of j l
k be the same, wherelis fixed and j is not fixed, j
1, 2,,l 1,l 1,,m
. That is,1 2 ... m. l l l k k k (3.14) Substituting (3.14) in (3.13),
*
* 2 + . 2 + j y y j j w j j j y y y w j y y d k P d s r c d s r c P d k (3.15)Substituting (3.15) in (3.11) and denoting
1 2 + 2 2 + j l m l j j j j l l l l j k d k A d d k
in order to22
* 1 1 2 + j j j j j m l j j j l l l w j l l l l j d s r c k d s r c d s r c P A d k
(3.16)Equation (3.16) specifies the jth recycling firm’s optimal reward money after it observes the level of the subsidy fee, s, announced by the EPA. In other words, the recycling firm’s reward money, *
i
w
P , is a function of the subsidy fee rate, s, and
(3.16) can be rewritten as * ( ) i w P s . Rewriting (3.11), we have
* * 1 2 . l j m j l w j w j j j l l i k P d P d s r c
(3.17) Substituting (3.17) in (3.9), we have
* * . j j c j j w q d s r P (3.18)Substituting (3.16) in (3.18), we obtain the jth recycling firm’s resulting recycling quantity.
* 1 2 + j j j j j m j l j j j l l l c j j j l l l l j d s r c d k d s r c d s r c q d s r A d k
(3.19)3.2.3 The Model of the EPA
The main objective of the EPA is to maximize the social welfare, which is the sum of the producer surplus, consumer surplus, tax/subsidy revenue, and the environmental externality cost (Bansal and Gangopadhyay, 2003). The producer surplus here is the sum of the profits of the MIS firms,
1 i i n x v x i P C t q
, and the profits of recyclingfirms,
1 j j m w j c j s P r q 23
1 1 . i i j j n m x v x w j c i j P C t q s P r q
(3.20)The consumer surplus is the sum of the consumer surplus in the consuming market and in the recycling market. In a consuming market, the consumer surplus is the difference between the price that consumers are willing to pay and the actual market price. In other words, the consumer surplus is the triangular area above the market price level and below the demand curve. In a recycling market, if the announced rate of reward money is greater than the fee level that consumers are willing to be paid to bring their obsolete products to recycling firms. The difference between the reward money that consumers are willing to be paid and the actual reward money is the consumer surplus in recycling market. From Figure 2, we obtain the consumer surpluses. Let CS1 represents the consumer surplus in the
consuming market and CS be the consumer surplus in the recycling market, we 2
have 2 1 2 1 x, CS bQ (3.21)
1 2
2 2 1 . j j j m w c j w j CS P q d P
(3.22)Figure 2 The consumer surplus in the consuming market and in the recycling market Consuming market Recycling market
24
The EPA imposes ARFs on the MIS firms based on the production quantity. The total ARFs are called total tax revenue (TTR), and its value is
1 i n x i t q
. As mentioned earlier, the EPA uses the ARFs to compensate recycling firms for associated recycling costs. The total expenditure used to subsidize recycling firmsare called total subsidy expenditure (TSE), and its value is
1 j m c j s q
. The tax/subsidy revenue is the total tax revenue in the consuming market minus the total subsidy expenditure in the recycling market.1 1 i j n m x c i j t q s q
(3.23)The environmental externality cost is a detrimental impact on a party and not directly involved in an economic transaction (Koomey and Krause, 1997). There are two types of environmental externality cost in our model. One is the indirect pollution costs resulting from producing new products. Let e denote the unit indirect pollution cost incurred in producing new products, so the pollution cost resulting from producing new products is eQ . The other one is the pollution cost x
caused by uncollected e-scrap products. Let E denote the unit pollution cost of uncollected e-scrap products. Before evaluating the pollution costs of uncollected e-scrap products, we should estimate the total amount of e-scrap products of current generation. In practice, the amount of e-scrap products may not be available to decision-makers, or it is difficult to estimate. Instead, the amount of current generation of new electronic products is relatively traceable and probably can be obtained from the associated government agencies, such as the department of commerce. We characterize the return rate of e-scrap products by , 0 , the 1
25
rate of current generation of new products that are expected to return to the reverse channel after usage, so the total e-scrap products of current generation are Qx, and the pollution costs caused by uncollected obsolete products are
1 j m x c j E Q q
.The models with the similar concept of return rate appear in (Savaskan et al., 2004; Savaskan and Van Wassenhove, 2006). Adding up these two types of environmental externality cost together and the totalenvironmental externality cost can be described as 1 . j m x c x j E Q q eQ
(3.24)From (3.20), (3.21), (3.22), ((3.23), and (3.24), the EPA optimizes the total social welfare as shown in (3.25).
2 1 2 , 0 1 1 2 1 2 1 1 1 1 Max Q 1 i i j j j j j i j j n m gov x v x w j c x t s i j m n m m w c j w x c x c x j i j j P C t q s P r q bQ P q d P t q s q E q eQ
(3.25)With that rationality assumption, the EPA anticipates that the MIS firms and recycling firms choose their optimal response to the announced fees. This allows us to substitute (3.7), (3.8), (3.16), and (3.19) in (3.25). Again to simplify the notation in
this thesis, we denote
1 2 + j m l j l j j l l l l j k d d B d d k
and
1 2 + j m l j j j l l l j j j j l l l l j k d r c d r c C d r c d k
. Equation (3.25) is maximized when the first-order condition holds, i.e. when26 * 2 1 1 ( 1)( ) i , n v i t n nE ne na C n
(3.26) 1 * 2 1 -. m j j j j m j j B C d E r r E A A s B d A
(3.27)The profit function, , is concave both in t and s , whenever gov b , 0 di . 0
The second-order conditions result in
2 2 2 ( 1)2, gov n t b n (3.28)
2 2 2 . 1 gov j m B d A s j (3.29)That is, the values of (3.28) and (3.29) are both negative.
In addition, substituting (3.26) in (3.7) and (3.8), we obtain the ith MIS firm’s optimal production quantity and market price, i 1, 2, 3,...,n.
2
* 3 2 2 1 1 1 1 1 i i i j n n x v v v i j j i n n a n nE ne q C n C n C n n b
(3.30) * 1 1 i n x v i P E e C n
(3.31)Substituting (3.27) in (3.16) and (3.19), we obtain the jth recycling firm’s optimal reward money and resulting recycling quantity, j 1, 2,,m.
27
1 2 1 * 1 2 1 1 1 2 j m j j j j j j j j m j j m w j j j j m j j l m l j j l l l l j j j j j l l l B C d d E r r E A A d r c B d A P B C A d E r r E A A d d k B d d k A d r c d r c
(3.32)
1 * 2 1 1 2 1 1 1 2 j m j j j j j c j j j m j j j j j m j j j j j j j l m l j j l l j j j j l l l B C d d E r r E A A q d r d A B d A d r c B C d E r r E A A d d d k A B d d k A d r c d r c
1 m l lj
(3.33)The subgame perfect Nash equilibrium (SPNE) is equilibrium such that players' strategies constitute a Nash equilibrium in every subgame of the original game. The SPNE is normally deduced by the backward induction (Gibbons, 1992). To calculate the SPNE, the best response functions of the followers, i.e. the MIS firms and recycling firms, must first be calculated given the output of the leader, i.e. the EPA. According to Section 3.2.1 and Section 3.2.2, the best response functions of the MIS firms and recycling firms are represented by *
( ) i x q t and * ( ) i w P s , respectively. Then the EPA’s equilibrium outcomes that maximize the social welfare are solved given
* ( ) i x q t and * ( ) i w
P s , i.e. given the best responses of the MIS firms and recycling firms. According to Section 3.2.3, the equilibrium outcomes of the EPA are *
t and *
s . Therefore, the solution * * * *
28
(3.30), (3.32) is the SPNE of the social welfare model. Under the SPNE, no one has anything to gain by changing only his or her own strategy unilaterally. Hence, we obtain the two fees which achieve the maximum of the social welfare at the equilibrium status, while both the MIS firms and recycling firms gain the maximum of their profits under their best responses to any possible pair of the ARF and subsidy fee ( , )t s .
3.3 The Fund Balance Model
The current practice in the e-scrap recycling systems in Taiwan and the state of California in the U.S. determines the ARF and subsidy fee on the basis of fund balance between revenues and costs along with recycling operations (Lee et al., 2000; IWMB, 2003). In this section, we develop a fund balance model, where the total revenue the EPA collects equals the EPA’s total expenditure, as a benchmark to compare with the social welfare model in Section 3.4. The material, cash, and information flows of the fund balance model are the same as the supply chain flows in the social welfare model and represented in Figure 1. In addition, we let the EPA collect the identical total tax revenue in these two models and let all parameters in the fund balance model be the same as the parameters in the social welfare model in order to have a fair basis for comparison.
3.3.1 The Model of MIS
Let t' denote the ARF per unit paid by the MIS firms in the fund balance model. The decision variable in this section is also the production quantity. Let qxi '
29
denote the ith MIS firm’s optimal production quantity and
1 ' i ' n x x i Q q
is the total demand for new products, which is characterized by a commonly-used linear demand function, Px' a bQx', where Px' is the market price. Parameters, a and b,are the same as the parameters in the social welfare model. The ith MIS firm’s profit function framework is not changed, i 1, 2,...,n.
' 0
Max1 i ( ' i ') i '
xi
MIS x v x
q P C t q (3.34)
Using similar computational procedure in the social welfare model, we obtain the ith MIS firm’s optimal production quantity and market price as
1 1 ' ' , ( 1) i n x v i P a nt C n
(3.35) * 1 1 ' ' . ( 1) i i j n x v v j j i q a t nC C n b
(3.36)Adding up MIS firms’ production quantity together, we obtain the total demand for new products as follows:
* 1 1 ' ' . ( 1) i n x v i Q n a t C n b
(3.37)3.3.2 The Model of Recycling Firms
In the current recycling policy, the government’s subsidy funds are not all received by the recycling firms. Part of the subsidy funds may be received by the local waste management under the local government supervision and part may be received indirectly by communities to proceed with recycling. Because the functional characteristics of recycling organizations are similar, we conceptually view those recycling organizations as individually-owned recycling firms in the group of recycler. Let s' denote the subsidy fee per unit, Pwj ' and qcj ' denote the jth recycling
30
firms optimal reward money and resulting recycling quantity, and
1 ' j ' m c c j Q q
bethe total recycling quantity. The parameters cj, dj, rj, and j l
k are the same as the parameters in the social welfare model. The jth recycling firm’s profit function framework is not changed, j 1, 2,,m.
'1 0
Max1 j ( ' j ') j '
w j
rec j w c
P s r P q (3.38)
Using similar computational procedure in the social welfare model, we obtain the jth recycling firm’s optimal reward money and resulting recycling quantity.
* 1 ' 1 ' ' ' , 2 + j j j j j m l j j j l l l w j l l l l j d s r c k d s r c d s r c P A d k
(3.39)
* 1 ' ' ' . 2 + j j j j j m j l j j j l l l c j j j l l l l j d s r c d k d s r c d s r c q d s r A d k
(3.40)3.3.3 The Model of the EPA
The central idea of the fund balance is on the basis of balance between the total tax revenue and the total subsidy expenditure. That is,
* *
' x' ' c' .
t Q s Q (3.41)
In order to have a fair basis for comparison, we let the EPA collect the identical total tax revenue under the two different policies. Thus,
* * *
' x' x.
t Q t Q (3.42)
Substituting (3.5) and (3.37) in (3.42), we have
2 * *2 1 1 ' i ' i 0. n n v v i i nt na C t na C t nt