DNA methylation profiles and biomarkers of oral squamous cell carcinoma
Yu-Fen Li1, Yi-Hsiu Hsiao1, Yi-Hui Lai2, Yi-Chen Chen2, Ying-Ju Chen2, Jian-Liang
Chou2, Michael W.Y. Chan2, Yu-Hsing Lin2,3, Yung-An Tsou4, Ming-Hsui Tsai4, and
Chien-Kuo Tai2,*
1Institute of Biostatistics; China Medical University; Taichung, Taiwan;
2Department of Life Science and Institutes of Molecular Biology and Biomedical
Science; National Chung Cheng University; Min-Hsiung, Chia-Yi, Taiwan;
3Department of Otolaryngology; Buddhist Dalin Tzu Chi General Hospital; Chia-Yi,
Taiwan;
4Department of Otolaryngology; China Medical University Hospital; Taichung,
Taiwan
Keywords: DNA methylation array, oral squamous cell carcinoma, biomarkers,
pyrosequencing, FLT4, KDR, TFPI2
Abstract
Oral squamous cell carcinoma (OSCC) constitutes >90% of oral cancers, and is the fourth leading cause of death due to cancer among men in Taiwan. However, most patients do not receive a diagnosis of OSCC until the late stages, which have a lower survival rate. The use of molecular marker analysis to identify early-stage OSCC would permit optimal timing for treatments and consequently prolong the survival. The aim of this study was to identify biomarkers of OSCC using the Illumina GoldenGate Methylation Cancer Panel, which comprised a total of 1,505 CpG sites covering 807 genes. Samples of buccal mucosa resected from 40 OSCC patients and normal tissue samples obtained from 15 patients (normal mucosa from OSCC patients or from patients undergoing surgery unrelated to OSCC) were analyzed. Fms-related tyrosine kinase 4 (FLT4) methylation exhibited a perfect specificity for detecting OSCC, with an area under the receiver operating characteristic curve of 0.91 for both all-stage and early-stage OSCC. Methylation of seven genes (ASCL1, FGF3, FLT4,
GAS7, KDR, TERT, and TFPI2) constitutes the top-20 panels for detecting OSCC.
The top-20 panels for detecting early-stage OSCC contain 8 genes: ADCYAP1,
EPHA7, FLT4, GSTM2, KDR, MT1A, NPY, and TFPI2. FLT4 RNA expression and
methylation level were validated using reverse-transcription PCR and a pyrosequencing methylation assay. The change in FLT4 expression was 2.14-fold for normal relative to OSCC samples (P<0.0001). Among the eight pyrosequenced CpG sites of FLT4, the methylation level was much higher in the OSCC samples. In conclusion, methylation statuses of selected genes, and especially FLT4, KDR, and
TFPI2, might be of great potential as biomarkers for the early detection of buccal
Introduction
Oral cancer has been the fourth leading cause of death due to cancer among males in Taiwan since 2003.1 The age-standardized mortality rate for oral cancer in
2010 was 15.2 per 100,000 males, which represents an increase of 25% compared to 2000 (12.2 per 100,000 males). The median age at death from oral cancer in 2010 was 56 years in men, which was the youngest age at death among the top-ten cancers in men. Moreover, oral cancer has had the highest rank in incidence and mortality rate among men aged 25~44 years in Taiwan since 2005.1
Oral squamous cell carcinoma (OSCC) constitutes more than 90% of oral cancers arising from the oral cavity.2 The treatment of OSCC with early detection
has a good outcome, but the 5-year survival rate is <30% among patients with stage IV disease.3 Despite the ease of access to the oral cavity for clinical examination,
OSCC is usually only diagnosed at advanced stages due to the patient’s lack of awareness of any major problems.4 The development of a convenient tool for
detecting OSCC at an early stage would not only improve the survival of patients, but also reduce the associated medical expenses. This makes the search for biomarkers for early detection of OSCC an urgent priority. The common risk factors for OSCC in most countries are cigarette smoking and alcohol drinking, and certain biomarkers for OSCC due to these risk factors have been identified; however, the main risk factor for OSCC in Taiwan is chewing of betel-quid, and the biomarkers for OSCC due to betel-quid consumption may be quite different from those identified for other risk factors.5, 6
Epigenetic modifications, including DNA methylation and numerous histone modifications, are responsible for the altered gene expression patterns that allow for specific phenotypes.7 DNA methylation plays an important role in normal
mammalian development, but aberrant methylation patterns are correlated with several differentiation-related diseases, including various types of human cancers. Investigation of the promoter methylation of tumor-suppressor genes in the setting of oral epithelial dysplasia seems appropriate, given the relatively high frequency of this epigenetic change in OSCC.8 Early epigenetic changes could predispose cells to
further genetic abnormalities that may allow progression of the neoplastic process. Thus, identification of gene methylation as an appropriate marker may provide a sensitive method for OSCC detection.
The development of new technologies such as DNA microarray analysis and next-generation sequencing has enabled the expansion of DNA-methylation studies beyond just several candidate genes. Several methods of determining the occurrence of promoter methylation have been described in the literature, including methylation-specific PCR (MSP), combined bisulfite restriction analysis, bisulfite sequencing assay, pyrosequencing methylation assay, and microarray-based methylation analysis; the overwhelming majority of published data were obtained using the MSP method. Literature reviews9-11 have revealed a wide variation in the
reported sensitivity and specificity for this method, ranging from 30% to 90%. Given the limited number of CpG sites detected by MSP and the inconsistent results obtained using this method, we developed a diagnostic tool for OSCC using a high-throughput, quantitative methylation platform—the Illumina GoldenGate Methylation Array—to allow a more comprehensive profiling of DNA methylation.
Results
Sample characteristics for the Illumina GoldenGate Methylation Array
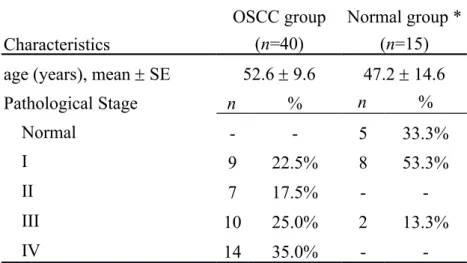
Selected sample characteristics are presented in Table 1. The mean age at surgery of the 40 OSCC cases from whom tissue was obtained for analysis was 52.6 years (range, 36–73 years), while the mean age of the subjects in the normal control group was 47.2 years (range, 17–70 years). Of the 40 OSCC samples, 40% were obtained from patients who were regarded as having early-stage OSCC: 22.5% at stage I and 17.5% at stage II.
Identification of single CpG sites as biomarkers for OSCC
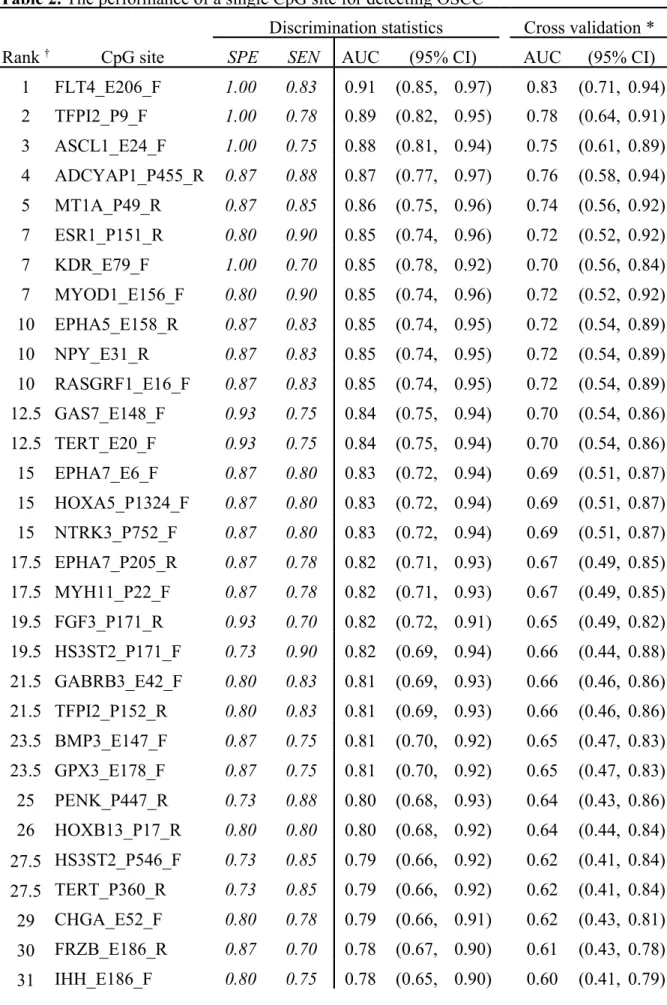
Among 1,505 CpG sites screened in the array, 34 CpG sites covering 29 genes exhibited a reasonable ability to distinguish OSCC (n=40) and normal (n=15) samples, with a specificity and sensitivity of 70% (Table 2). Moreover, the specificity of FLT4, TFPI2, ASCL1, and KDR was 100%, while the sensitivities of these genes for detecting OSCC were 83%, 78%, 75%, and 70%, respectively. The areas under the receiving operating characteristic curves (AUCs) decreased after leave-one-out cross validation, leaving only FLT4 with an AUC of >0.8. The heat map of hierarchical cluster analysis for the 34 CpG sites is presented in Figure 1A. Of the three clusters, the right one comprised only OSCC samples, while most of the samples classified in the other two clusters were OSCC and normal samples. This implies that these 34 CpG sites are informative for detecting OSCC.
A subset analysis was conducted for the ability to detect early-stage OSCC (stages I and II). Among the 17 CpG sites covering 15 genes that had both a specificity and sensitivity of >70% to discriminate the early-stage OSCC (n=16) and normal samples (n=15), the top-3 informative CpG sites (FLT4_E206, KDR_E79, and TFPI2_P9) had a specificity of 100% and a sensitivity of 75% (Table 3). The
AUCs decreased after leave-one-out cross validation, again leaving only FLT4, with an AUC of >0.8. The heat map presented in Figure 1B for distinguishing early-stage OSCC from normal samples shows three clusters (from left to right): (1) a mixture of OSCC and normal samples, (2) outnumbered by normal samples, and (3) OSCC samples only.
The hypermethylation status of the CpG sites in the Illumina GoldenGate Methylation Cancer Panel was found to be informative for detecting OSCC, while the hypomethylation status of the CpG sites was less informative (data not shown). The hypomethylation status of the studied CpG sites exhibited a good specificity but a poor sensitivity, and ERN1 was the only gene with an AUC of >0.70 (AUC=0.72, specificity=93%, and sensitivity=50%).
Identification of CpG panels as biomarkers for OSCC
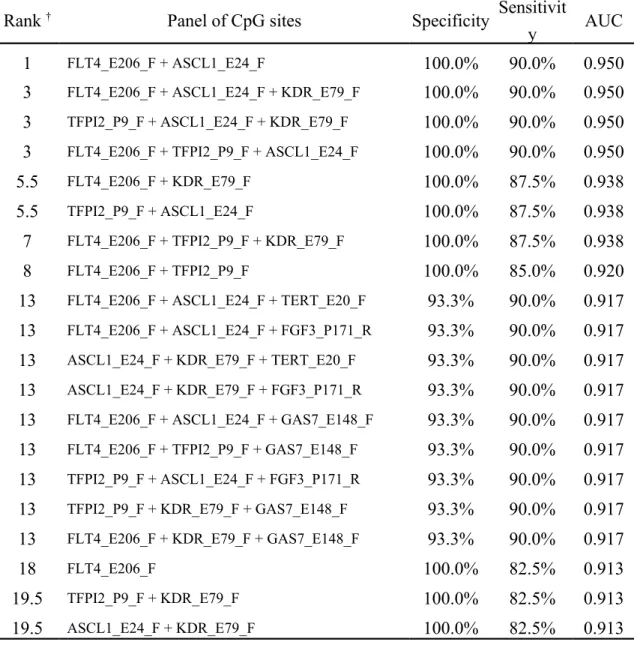
Since there are numerous combinations for CpG panels, only the top-20 panels are listed in Tables 4 and 5. The top-20 CpG panels for detecting OSCC contain 7 genes: ASCL1, FGF3, FLT4, GAS7, KDR, TERT, and TFPI2 (Table 4). The best panel was the combination of FLT4 and ASCL1, with a specificity, sensitivity, and AUC of 100%, 90%, and 0.95, respectively. Adding ASCL1 to the panel increased the sensitivity from 82.5% to 90% for FLT4 alone (100% specificity). The best panel was followed by another three panels with the same performance, but with one extra CpG site that was considered redundant.
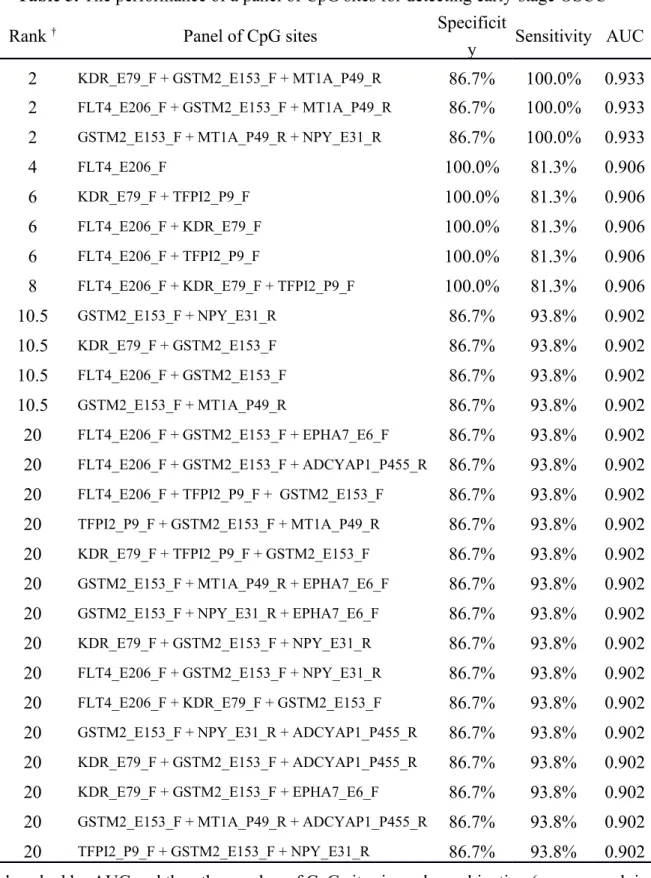
For detecting early-stage OSCC, the top-20 panels comprised 8 genes:
ADCYAP1, EPHA7, FLT4, GSTM2, KDR, MT1A, NPY, and TFPI2 (Table 5). Three
panels (KDR+GSTM2+MT1A, FLT4+GSTM2+MT1A, and GSTM2+MT1A+NPY) exhibited the same dissemination ability (specificity=86.7%, sensitivity=100%, and AUC=0.933), followed by FLT4 alone (specificity=100%, sensitivity=81.3%, and
AUC=0.906).
Validation of FLT4 methylation by pyrosequencing assay
The methylation status of FLT4 appeared to be a promising candidate as a biomarker for detecting OSCC. In fact, FLT4_E206 was the top biomarker and after leave-one-out cross validation was the only CpG site with an AUC of >0.80 for detecting all-stage or early-stage OSCC (highest rank in Tables 2 and 3). We validated this finding both internally and externally using the pyrosequencing methylation assay. Among those subjected to Illumina GoldenGate Methylation Array analysis, 9 normal samples and 17 OSCC samples with available DNA left were used for internal validation. Another 28 OSCC tissue specimens obtained from Buddhist Tzu Chi General Hospital served as samples for external validation. Among the eight pyrosequenced CpG sites (+204, +206, +210, +225, +228, +237, +239, and +247) of FLT4, the differences in methylation levels between normal and OSCC samples were all statistically significant in the internal comparison (Fig. 2A
and B). Six (+204, +206, +225, +228, +237, and +239) of the eight pyrosequenced
CpG sites exhibited statistically significant differences between normal and OSCC samples in the external comparison (Fig. 2C). As expected, the methylation levels were much higher in the OSCC samples (median methylation percentage range for the eight CpG sites, 46–68%) than in the normal samples (median methylation percentage range, 10–23%).
Validation of FLT4 expression
Comparison of FLT4 RNA expression between 21 paired normal and OSCC samples yielded results that were in line with those obtained using the Illumina GoldenGate Methylation Array and pyrosequencing assays. The median change in
FLT4 expression in normal samples relative to OSCC samples was 2.14-fold
Discussion
Using an array approach, we observed that the methylation of CpG sites had both high sensitivity and specificity as biomarkers for detecting buccal OSCC. The hypermethylation of FLT4 had perfect specificity for detecting all-stage or early-stage OSCC, and a sensitivity and AUC of >0.80 and >0.90, respectively. In addition, using the selected CpG combination panels slightly improved the ability to detect OSCC.
Based on the selected CpG panels, we identified 12 genes (ADCYAP1, ASCL1,
EPHA7, FGF3, FLT4, GAS7, GSTM2, KDR, MT1A, NPY, TERT, and TFPI2) with
great potential for detecting OSCC. The functions of the selected genes strengthen their potential role as biomarkers. EPHA7,12 FGF3,13 and NPY14, 15 are related to
tumor progression, GAS7 controls neuritogenesis,16 ASCL1 plays a role in the early
stages of development of specific neural lineages,17 TERT regulates telomerase
activity,18 ADCYAP1 is associated with hormone activity,19 GSTM2 belongs to a
well-known phase II detoxifying enzyme family,20 MT1A regulates cell growth and
differentiation,21 TFPI-2 counteracts the activity of several extracellular
matrix-associated proteases22, 23 and suppresses tumor invasion and metastasis,24-26 and FLT4
and KDR are receptors for vascular endothelial growth factors.27-30 It has been
reported that hypermethylations of EPHA7,31, 32 GSTM2,33 MT1A,34 NPY,35 and
TERT35-37 are associated with cancers other than OSCC.
Viet et al.9 used the Illumina GoldenGate Methylation Array to identify
potential biomarkers for oral cancer by comparing the saliva samples of oral cancer patients before and after resection of their tumors. About one half of the identified genes (e.g., ADCYAP1, FGF3, GAS7, and KDR) also exhibited potential in our tissue samples as biomarkers of oral cancer. In a recent study, Jithesh et al.38 also
employed the same array and suggested that EPHA5, GSTM2, HS3ST2, MME,
MT1A, MYOD1, NPY, and PENK are potential biomarkers for detecting oral cancer,
as in the present study. The only triple-hit gene among the studies of Viet et al.,9
Jithesh et al.,38 and ourselves was EPHA5. In addition, Nagata et al.39 reported that
the aberrant methylation of a combination of ECAD, TMEFF2, RARβ, and MGMT from rinse samples can detect OSCC with a sensitivity and specificity of >90% by using noninvasive method to retrieve samples and a different methylation platform. However, with the exception of TMEFF2, the results were not consistent with those of the present study. These inconsistencies can be explained by several factors, including differences in the sample types analyzed (tissue versus saliva/oral rinse) and different mechanisms of tumorigenesis (betel-quid chewing has been confirmed as the main cause of OSCC in Taiwan,6 while alcohol and smoking are the main
causes elsewhere). Furthermore, the influence of race/ethnicity, tumor heterogeneity, experimental design, the methylation array platform employed, and the smallness of the samples in the studies cannot be excluded.
The epigenetic signature associated with human papillomavirus (HPV)-driven head and neck squamous cell carcinoma (HNSCC) has been described recently,40, 41
and it appears that HPV-16 might be a good prognostic biomarker for oropharyngeal cancer.42 The status of HPV infection was not available for the present samples, and
so it was not possible to evaluate the influence of HPV on the performance of biomarkers. However, it has been shown that HPV does not play an important role in the tumorigenesis of betel-quid-related oral cancers.43
The prefect specificity and high sensitivity of the biomarkers observed in the present study is very promising. However, the application of biomarkers to disease screening or detection relies not only on their accuracy, but also on their
convenience. The tissue samples used in the present study were obtained using an invasive method, which is generally considered inconvenient for fast cancer screening. Gene methylation in saliva has been tested for the follow-up and early detection of still-curable relapses in HNSCC patients.44 In addition, the methylation
biomarkers selected in the present study should be examined for other oral cancer sites such as tongue, with a view to their further application.
In conclusion, methylation statuses of selected genes, and especially FLT4,
KDR, and TFPI2, might be of great potential as biomarkers for the early detection of
buccal OSCC. These candidate biomarkers provide a prospective application for screening and diagnosis; however, further studies are needed to evaluate samples obtained using noninvasive methods.
Materials and Methods
Illumina GoldenGate Methylation Array
Eight hundred and seven cancer-related genes (1,505 CpG sites) were profiled in the Illumina GoldenGate Methylation Cancer Panel35 by applying the bisulfite
sequencing technology on a microarray platform. The background normalization algorithm is used to minimize background variation within the microarray by using built-in negative control signals. The value is used to estimate the methylation level of the CpG locus using the ratio of intensities between methylated and unmethylated alleles.35
Tissue specimens for the methylation array profiling
Oral specimens were obtained from the tissue bank of China Medical University Hospital, Taiwan. The study was approved by the Ethics Committee of each participating hospital. Oral tissues from male individuals were collected and assigned to either the case group or the normal control group. The case group comprised resected tumor tissue harvested from 40 OSCC patients. The control group comprised tissue samples harvested from 15 patients; in 10 cases the normal tissue was taken from an area near the tumor lesions in the oral cavities of OSCC patients in the case group, and in 5 cases the normal tissues were taken from the oral cavities of patients undergoing surgery unrelated to OSCC.
Tissue specimens for pyrosequencing methylation assay and quantitative reverse-transcription PCR
A subset of 26 samples (9 normal and 17 OSCC tissues) among those oral specimens that were subjected to the Illumina GoldenGate Methylation Array (Illumina, Inc.) were also pyrosequenced. Another 28 fresh OSCC tissues that were
obtained from Buddhist Tzu Chi General Hospital served as the external validation samples; 21 of these OSCC tissue samples accompanying their corresponding nontumor oral tissues were used for measuring RNA expression level using quantitative reverse-transcription PCR.
Pyrosequencing methylation assay
Genomic DNA of tissues was isolated using Gentra Puregene Tissue Kit (Qiagen) and 500 ng of each genomic DNA was bisulfite-modified using EZ DNA methylation kit (Zymo Research). Pyrosequencing primers were designed for the region of interest using Pyromark Assay Design v2.0 (Qiagen): forward,
5’-TTGGTAGGGGAGGGGGTAT-3’; reverse,
5’-biotin-CCCCCCCCTTCCTCATCCC-3’; sequencing primer,
5’-GGATAAGGTGGTTTTGGT-3’. Pyrosequencing assay was carried out using the PyroMark Gold Q96 Reagents (Qiagen) in PyroMark Q24 System (Qiagen) according to the manufacturer’s instructions.
Quantitative reverse-transcription PCR
Total RNA was extracted from fresh tissues using TRIzol reagent (Invitrogen) according to the manufacturer’s protocol. Complementary DNA (cDNA) was synthesized from 1 μg of total RNA using Superscript III Reverse Transcriptase (Invitrogen). PCR was carried out using ABI StepOne real-time PCR system as the following steps: 95°C for 5 min, followed by 50 cycles of successive incubation at 95°C for 30 sec, 62°C for 15 sec, and 68°C for 30 sec. FLT4 cDNA was amplified with the following primers: forward, 5’-TGTGGAGGGAAAGAATAAGACTGT-3’; reverse, 5’-GCCCACCTTGTTGGAGAC-3’. GAPDH cDNA was amplified with
the following primers: forward, TTGACGGTGCCATGGAATTT-3’; reverse, 5’-GCCATCAATGACCCCTTCATT-3’. The expression of FLT4 was normalized against that of GAPDH.
Statistical analyses
Statistical analyses were performed using SAS v9.3 (SAS Institutes), and the heat maps were generated by the gplots package in R.
Selection of biomarkers for detecting tumor and normal samples
The AUC was calculated for each CpG site to evaluate the accuracy. Leave-one-out cross validation was conducted to test the reliability withLeave-one-out collecting new samples. Moreover, a subset analysis was conducted for the ability to distinguish early-stage OSCC (n=16) and normal (n=15) samples.
Cluster analysis of methylation levels
The normalized methylation levels in values for profiled CpG sites were presented in a heat map and analyzed with a hierarchical agglomerative cluster method for differential methylation between tumor and normal samples. In the cluster analysis, we used Manhattan distance to measure the distance between observed values and defined clusters by the method of complete linkage.
Validation of FLT4 methylation status and RNA expression
Quantitative methylation levels between different types of tumor and normal samples measured by pyrosequencing assay were compared by Mann-Whitney U test. Wilcoxon signed rank test was used to test the difference in fold-change of RNA expression.
Disclosure of Potential Conflicts of Interest
No potential conflicts of interest were disclosed.
Acknowledgements
This study was supported in part by the Ministry of Science and Technology of Taiwan (MOST103-2314-B-039-037 and NSC99-2320-B-194-004-MY3).
References
1. Department of Health, Executive Yuan, R.O.C.(TAIWAN). 2009 Statistics of Causes of Death. Taipei, Taiwan, 2010.
2. Warnakulasuriya S. Global epidemiology of oral and oropharyngeal cancer. Oral Oncol 2009; 45:309-16.
3. Lo WL, Kao SY, Chi LY, Wong YK, Chang RC. Outcomes of oral squamous cell carcinoma in Taiwan after surgical therapy: factors affecting survival. Journal of Oral and Maxillofacial Surgery 2003; 61:751-8.
4. Richards D. Patient delay in reporting oral cancer is poorly understood. Evid Based Dent 2007; 8:21.
5. Chen CL, Chi CW, Chang KW, Liu TY. Safrole-like DNA adducts in oral tissue from oral cancer patients with a betel quid chewing history. Carcinogenesis 1999; 20:2331-4.
6. Ko YC, Huang YL, Lee CH, Chen MJ, Lin LM, Tsai CC. Betel quid chewing, cigarette smoking and alcohol consumption related to oral cancer in Taiwan. J Oral Pathol Med 1995; 24:450-3.
7. Jones PA. DNA methylation and cancer. Oncogene 2002; 21:5358-60.
8. Shaw RJ, Akufo-Tetteh EK, Risk JM, Field JK, Liloglou T. Methylation enrichment pyrosequencing: combining the specificity of MSP with validation by pyrosequencing. Nucleic Acids Res 2006; 34:e78.
9. Viet CT, Schmidt BL. Methylation array analysis of preoperative and postoperative saliva DNA in oral cancer patients. Cancer Epidemiol Biomarkers Prev 2008; 17:3603-11.
10. Viswanathan M, Tsuchida N, Shanmugam G. Promoter hypermethylation profile of tumor-associated genes p16, p15, hMLH1, MGMT and E-cadherin in oral squamous cell carcinoma. Int J Cancer 2003; 105:41-6.
11. Carvalho AL, Jeronimo C, Kim MM, Henrique R, Zhang Z, Hoque MO, Chang S, Brait M, Nayak CS, Jiang WW, et al. Evaluation of promoter hypermethylation detection in body fluids as a Screening/Diagnosis tool for head and neck squamous cell carcinoma. Clinical Cancer Research 2008; 14:97-107.
12. Mosch B, Reissenweber B, Neuber C, Pietzsch J. Eph receptors and ephrin ligands: important players in angiogenesis and tumor angiogenesis. J Oncol 2010:135285.
13. Hu L, Sham JS, Xie D, Wen JM, Wang WS, Wang Y, Guan XY. Up-regulation of fibroblast growth factor 3 is associated with tumor metastasis and recurrence in human hepatocellular carcinoma. Cancer Lett 2007; 252:36-42.
system in the biology of cancer progression. Curr Top Med Chem 2007; 7:1682-91. 15. Kitlinska J. Neuropeptide Y in neural crest-derived tumors: effect on growth and vascularization. Cancer Lett 2007; 245:293-302.
16. Ju YT, Chang AC, She BR, Tsaur ML, Hwang HM, Chao CC, Cohen SN, Lin-Chao S. gas7: A gene expressed preferentially in growth-arrested fibroblasts and terminally differentiated Purkinje neurons affects neurite formation. Proc Natl Acad Sci U S A 1998; 95:11423-8.
17. Ball DW. Achaete-scute homolog-1 and Notch in lung neuroendocrine development and cancer. Cancer Lett 2004; 204:159-69.
18. Chang JT, Lu YC, Chen YJ, Tseng CP, Chen YL, Fang CW, Cheng AJ. hTERT phosphorylation by PKC is essential for telomerase holoprotein integrity and enzyme activity in head neck cancer cells. Br J Cancer 2006; 94:870-8.
19. Sherwood NM, Krueckl SL, McRory JE. The origin and function of the pituitary adenylate cyclase-activating polypeptide (PACAP)/glucagon superfamily. Endocr Rev 2000; 21:619-70.
20. Hayes JD, McLellan LI. Glutathione and glutathione-dependent enzymes represent a co-ordinately regulated defence against oxidative stress. Free Radic Res 1999; 31:273-300.
21. Thirumoorthy N, Manisenthil Kumar KT, Shyam Sundar A, Panayappan L, Chatterjee M. Metallothionein: an overview. World J Gastroenterol 2007; 13:993-6. 22. Chand HS, Schmidt AE, Bajaj SP, Kisiel W. Structure-function analysis of the reactive site in the first Kunitz-type domain of human tissue factor pathway inhibitor-2. J Biol Chem 2004; 279:17500-7.
23. Petersen LC, Sprecher CA, Foster DC, Blumberg H, Hamamoto T, Kisiel W. Inhibitory properties of a novel human Kunitz-type protease inhibitor homologous to tissue factor pathway inhibitor. Biochemistry 1996; 35:266-72.
24. Konduri SD, Tasiou A, Chandrasekar N, Rao JS. Overexpression of tissue factor pathway inhibitor-2 (TFPI-2), decreases the invasiveness of prostate cancer cells in vitro. Int J Oncol 2001; 18:127-31.
25. Lai YH, He RY, Chou JL, Chan MW, Li YF, Tai CK. Promoter hypermethylation and silencing of tissue factor pathway inhibitor-2 in oral squamous cell carcinoma. Journal of translational medicine 2014; 12:237.
26. Wong CM, Ng YL, Lee JM, Wong CC, Cheung OF, Chan CY, Tung EK, Ching YP, Ng IO. Tissue factor pathway inhibitor-2 as a frequently silenced tumor suppressor gene in hepatocellular carcinoma. Hepatology 2007; 45:1129-38.
27. Ferrara N, Davis-Smyth T. The biology of vascular endothelial growth factor. Endocr Rev 1997; 18:4-25.
angiogenesis. Curr Opin Nephrol Hypertens 1996; 5:35-44.
29. Klagsbrun M, D'Amore PA. Vascular endothelial growth factor and its receptors. Cytokine Growth Factor Rev 1996; 7:259-70.
30. Veikkola T, Alitalo K. VEGFs, receptors and angiogenesis. Semin Cancer Biol 1999; 9:211-20.
31. Guan M, Xu C, Zhang F, Ye C. Aberrant methylation of EphA7 in human prostate cancer and its relation to clinicopathologic features. Int J Cancer 2009; 124:88-94.
32. Wang J, Kataoka H, Suzuki M, Sato N, Nakamura R, Tao H, Maruyama K, Isogaki J, Kanaoka S, Ihara M, et al. Downregulation of EphA7 by hypermethylation in colorectal cancer. Oncogene 2005; 24:5637-47.
33. Peng DF, Razvi M, Chen H, Washington K, Roessner A, Schneider-Stock R, El-Rifai W. DNA hypermethylation regulates the expression of members of the Mu-class glutathione S-transferases and glutathione peroxidases in Barrett's adenocarcinoma. Gut 2009; 58:5-15.
34. Yu J, Zhu T, Wang Z, Zhang H, Qian Z, Xu H, Gao B, Wang W, Gu L, Meng J, et al. A novel set of DNA methylation markers in urine sediments for sensitive/specific detection of bladder cancer. Clin Cancer Res 2007; 13:7296-304. 35. Bibikova M, Lin Z, Zhou L, Chudin E, Garcia EW, Wu B, Doucet D, Thomas NJ, Wang Y, Vollmer E, et al. High-throughput DNA methylation profiling using universal bead arrays. Genome Res 2006; 16:383-93.
36. Gigek CO, Leal MF, Silva PN, Lisboa LC, Lima EM, Calcagno DQ, Assumpcao PP, Burbano RR, Smith Mde A. hTERT methylation and expression in gastric cancer. Biomarkers 2009; 14:630-6.
37. Clement G, Braunschweig R, Pasquier N, Bosman FT, Benhattar J. Methylation of APC, TIMP3, and TERT: a new predictive marker to distinguish Barrett's oesophagus patients at risk for malignant transformation. J Pathol 2006; 208:100-7. 38. Jithesh PV, Risk JM, Schache AG, Dhanda J, Lane B, Liloglou T, Shaw RJ. The epigenetic landscape of oral squamous cell carcinoma. Br J Cancer 2013; 108:370-9. 39. Nagata S, Hamada T, Yamada N, Yokoyama S, Kitamoto S, Kanmura Y, Nomura M, Kamikawa Y, Yonezawa S, Sugihara K. Aberrant DNA methylation of tumor-related genes in oral rinse: a noninvasive method for detection of oral squamous cell carcinoma. Cancer 2012; 118:4298-308.
40. Richards KL, Zhang B, Baggerly KA, Colella S, Lang JC, Schuller DE, Krahe R. Genome-wide hypomethylation in head and neck cancer is more pronounced in HPV-negative tumors and is associated with genomic instability. PLoS One 2009; 4:e4941. 41. Sartor MA, Dolinoy DC, Jones TR, Colacino JA, Prince ME, Carey TE, Rozek LS. Genome-wide methylation and expression differences in HPV(+) and HPV(-)
squamous cell carcinoma cell lines are consistent with divergent mechanisms of carcinogenesis. Epigenetics 2011; 6:777-87.
42. Shaw R, Robinson M. The increasing clinical relevance of human papillomavirus type 16 (HPV-16) infection in oropharyngeal cancer. Br J Oral Maxillofac Surg 2011; 49:423-9.
43. Chang KC, Su IJ, Tsai ST, Shieh DB, Jin YT. Pathological features of betel quid-related oral epithelial lesions in taiwan with special emphasis on the tumor progression and human papillomavirus association. Oncology 2002; 63:362-9.
44. Righini CA, de Fraipont F, Timsit JF, Faure C, Brambilla E, Reyt E, Favrot MC. Tumor-specific methylation in saliva: a promising biomarker for early detection of head and neck cancer recurrence. Clin Cancer Res 2007; 13:1179-85.
Figure legends
Figure 1. Hierarchical clustering heat maps and dendrograms for distinguishing (A)
OSCC from normal samples and (B) early-stage OSCC from normal samples. Mean values from the selected CpG sites were used for hierarchical agglomerative clustering based on the Manhattan distance and complete linkage. Low, medium, and high methylation levels are indicated in green, black, and red, respectively.
Figure 2. Box plots of methylation levels of 8 FLT4 CpG sites determined by
pyrosequencing methylation assay. (A) Normal samples. (B) OSCC samples for internal validation. (C) OSCC samples for external validation. In each box plot, the whiskers represent the 10th and 90th percentiles, the lower and upper limits of the box indicate the 25th and 75th percentiles. An asterisk mark (*) indicates that the difference between normal and tumor samples reaches statistical significance.
Table 1. Characteristics of OSCC patients and normal specimens in the Illumina
GoldenGate Methylation Array analysis OSCC group
(n=40)
Normal group * (n=15) Characteristics
age (years), mean SE 52.6 9.6 47.2 14.6
Pathological Stage n % n % Normal - - 5 33.3% I 9 22.5% 8 53.3% II 7 17.5% - -III 10 25.0% 2 13.3% IV 14 35.0% -
-SE: standard error
Table 2. The performance of a single CpG site for detecting OSCC
Discrimination statistics Cross validation *
Rank † CpG site SPE SEN AUC (95% CI) AUC (95% CI)
1 FLT4_E206_F 1.00 0.83 0.91 (0.85, 0.97) 0.83 (0.71, 0.94) 2 TFPI2_P9_F 1.00 0.78 0.89 (0.82, 0.95) 0.78 (0.64, 0.91) 3 ASCL1_E24_F 1.00 0.75 0.88 (0.81, 0.94) 0.75 (0.61, 0.89) 4 ADCYAP1_P455_R 0.87 0.88 0.87 (0.77, 0.97) 0.76 (0.58, 0.94) 5 MT1A_P49_R 0.87 0.85 0.86 (0.75, 0.96) 0.74 (0.56, 0.92) 7 ESR1_P151_R 0.80 0.90 0.85 (0.74, 0.96) 0.72 (0.52, 0.92) 7 KDR_E79_F 1.00 0.70 0.85 (0.78, 0.92) 0.70 (0.56, 0.84) 7 MYOD1_E156_F 0.80 0.90 0.85 (0.74, 0.96) 0.72 (0.52, 0.92) 10 EPHA5_E158_R 0.87 0.83 0.85 (0.74, 0.95) 0.72 (0.54, 0.89) 10 NPY_E31_R 0.87 0.83 0.85 (0.74, 0.95) 0.72 (0.54, 0.89) 10 RASGRF1_E16_F 0.87 0.83 0.85 (0.74, 0.95) 0.72 (0.54, 0.89) 12.5 GAS7_E148_F 0.93 0.75 0.84 (0.75, 0.94) 0.70 (0.54, 0.86) 12.5 TERT_E20_F 0.93 0.75 0.84 (0.75, 0.94) 0.70 (0.54, 0.86) 15 EPHA7_E6_F 0.87 0.80 0.83 (0.72, 0.94) 0.69 (0.51, 0.87) 15 HOXA5_P1324_F 0.87 0.80 0.83 (0.72, 0.94) 0.69 (0.51, 0.87) 15 NTRK3_P752_F 0.87 0.80 0.83 (0.72, 0.94) 0.69 (0.51, 0.87) 17.5 EPHA7_P205_R 0.87 0.78 0.82 (0.71, 0.93) 0.67 (0.49, 0.85) 17.5 MYH11_P22_F 0.87 0.78 0.82 (0.71, 0.93) 0.67 (0.49, 0.85) 19.5 FGF3_P171_R 0.93 0.70 0.82 (0.72, 0.91) 0.65 (0.49, 0.82) 19.5 HS3ST2_P171_F 0.73 0.90 0.82 (0.69, 0.94) 0.66 (0.44, 0.88) 21.5 GABRB3_E42_F 0.80 0.83 0.81 (0.69, 0.93) 0.66 (0.46, 0.86) 21.5 TFPI2_P152_R 0.80 0.83 0.81 (0.69, 0.93) 0.66 (0.46, 0.86) 23.5 BMP3_E147_F 0.87 0.75 0.81 (0.70, 0.92) 0.65 (0.47, 0.83) 23.5 GPX3_E178_F 0.87 0.75 0.81 (0.70, 0.92) 0.65 (0.47, 0.83) 25 PENK_P447_R 0.73 0.88 0.80 (0.68, 0.93) 0.64 (0.43, 0.86) 26 HOXB13_P17_R 0.80 0.80 0.80 (0.68, 0.92) 0.64 (0.44, 0.84) 27.5 HS3ST2_P546_F 0.73 0.85 0.79 (0.66, 0.92) 0.62 (0.41, 0.84) 27.5 TERT_P360_R 0.73 0.85 0.79 (0.66, 0.92) 0.62 (0.41, 0.84) 29 CHGA_E52_F 0.80 0.78 0.79 (0.66, 0.91) 0.62 (0.43, 0.81) 30 FRZB_E186_R 0.87 0.70 0.78 (0.67, 0.90) 0.61 (0.43, 0.78) 31 IHH_E186_F 0.80 0.75 0.78 (0.65, 0.90) 0.60 (0.41, 0.79)
32.5 ISL1_E87_R 0.73 0.75 0.74 (0.61, 0.88) 0.55 (0.35, 0.75) 32.5 ISL1_P379_F 0.73 0.75 0.74 (0.61, 0.88) 0.55 (0.35, 0.75) 34 MME_P388_F 0.73 0.73 0.73 (0.59, 0.86) 0.53 (0.33, 0.73) SPE=specificity; SEN=sensitivity; AUC=area under the ROC curve, CI=confidence interval † ranked by AUC (an average rank is assigned for tied AUCs)
Table 3. The performance of a single CpG site for detecting early-stage OSCC
Discrimination statistics Cross validation *
Rank † CpG site SPE SEN AUC (95% CI) AUC (95% CI)
1 FLT4_E206_F 1.00 0.81 0.91 (0.81, 1.00) 0.81 (0.62, 1.00) 2.5 KDR_E79_F 1.00 0.75 0.88 (0.77, 0.98) 0.75 (0.53, 0.97) 2.5 TFPI2_P9_F 1.00 0.75 0.88 (0.77, 0.98) 0.75 (0.53, 0.97) 5 GSTM2_E153_F 0.87 0.81 0.81 (0.67, 0.95) 0.65 (0.42, 0.88) 5 MT1A_P49_R 0.87 0.81 0.84 (0.71, 0.97) 0.70 (0.48, 0.93) 5 NPY_E31_R 0.87 0.81 0.84 (0.71, 0.97) 0.70 (0.48, 0.93) 8.5 ADCYAP1_P455_R 0.87 0.75 0.81 (0.67, 0.95) 0.65 (0.42, 0.88) 8.5 EPHA7_E6_F 0.87 0.75 0.81 (0.67, 0.95) 0.65 (0.42, 0.88) 8.5 ESR1_P151_R 0.80 0.88 0.84 (0.70, 0.97) 0.70 (0.47, 0.93) 8.5 MYOD1_E156_F 0.80 0.88 0.84 (0.70, 0.97) 0.70 (0.47, 0.93) 11.5 HOXB13_P17_R 0.80 0.81 0.81 (0.66, 0.95) 0.65 (0.42, 0.88) 11.5 TFPI2_P152_R 0.80 0.81 0.81 (0.66, 0.95) 0.65 (0.42, 0.88) 13.5 HS3ST2_P171_F 0.73 0.88 0.80 (0.66, 0.95) 0.64 (0.40, 0.88) 13.5 PENK_P447_R 0.73 0.88 0.80 (0.66, 0.95) 0.64 (0.40, 0.88) 15 GABRB3_E42_F 0.80 0.75 0.78 (0.62, 0.93) 0.60 (0.36, 0.84) 16.5 HS3ST2_P546_F 0.73 0.75 0.74 (0.58, 0.90) 0.55 (0.31, 0.79) 16.5 TERT_P360_R 0.73 0.75 0.74 (0.58, 0.90) 0.55 (0.31, 0.79) SPE=specificity; SEN=sensitivity; AUC=area under the ROC curve, CI=confidence interval † ranked by AUC (an average rank is assigned for tied AUCs)
Table 4. The performance of a panel of CpG sites for detecting OSCC
Rank † Panel of CpG sites Specificity Sensitivit
y AUC
1 FLT4_E206_F + ASCL1_E24_F 100.0% 90.0% 0.950
3 FLT4_E206_F + ASCL1_E24_F + KDR_E79_F 100.0% 90.0% 0.950 3 TFPI2_P9_F + ASCL1_E24_F + KDR_E79_F 100.0% 90.0% 0.950 3 FLT4_E206_F + TFPI2_P9_F + ASCL1_E24_F 100.0% 90.0% 0.950
5.5 FLT4_E206_F + KDR_E79_F 100.0% 87.5% 0.938
5.5 TFPI2_P9_F + ASCL1_E24_F 100.0% 87.5% 0.938
7 FLT4_E206_F + TFPI2_P9_F + KDR_E79_F 100.0% 87.5% 0.938
8 FLT4_E206_F + TFPI2_P9_F 100.0% 85.0% 0.920
13 FLT4_E206_F + ASCL1_E24_F + TERT_E20_F 93.3% 90.0% 0.917 13 FLT4_E206_F + ASCL1_E24_F + FGF3_P171_R 93.3% 90.0% 0.917 13 ASCL1_E24_F + KDR_E79_F + TERT_E20_F 93.3% 90.0% 0.917 13 ASCL1_E24_F + KDR_E79_F + FGF3_P171_R 93.3% 90.0% 0.917 13 FLT4_E206_F + ASCL1_E24_F + GAS7_E148_F 93.3% 90.0% 0.917 13 FLT4_E206_F + TFPI2_P9_F + GAS7_E148_F 93.3% 90.0% 0.917 13 TFPI2_P9_F + ASCL1_E24_F + FGF3_P171_R 93.3% 90.0% 0.917 13 TFPI2_P9_F + KDR_E79_F + GAS7_E148_F 93.3% 90.0% 0.917 13 FLT4_E206_F + KDR_E79_F + GAS7_E148_F 93.3% 90.0% 0.917
18 FLT4_E206_F 100.0% 82.5% 0.913
19.5 TFPI2_P9_F + KDR_E79_F 100.0% 82.5% 0.913
19.5 ASCL1_E24_F + KDR_E79_F 100.0% 82.5% 0.913
† ranked by AUC and then the number of CpG sites in each combination (average rank is assigned if tied)
Table 5. The performance of a panel of CpG sites for detecting early-stage OSCC
Rank † Panel of CpG sites Specificit
y Sensitivity AUC 2 KDR_E79_F + GSTM2_E153_F + MT1A_P49_R 86.7% 100.0% 0.933 2 FLT4_E206_F + GSTM2_E153_F + MT1A_P49_R 86.7% 100.0% 0.933 2 GSTM2_E153_F + MT1A_P49_R + NPY_E31_R 86.7% 100.0% 0.933
4 FLT4_E206_F 100.0% 81.3% 0.906
6 KDR_E79_F + TFPI2_P9_F 100.0% 81.3% 0.906
6 FLT4_E206_F + KDR_E79_F 100.0% 81.3% 0.906
6 FLT4_E206_F + TFPI2_P9_F 100.0% 81.3% 0.906
8 FLT4_E206_F + KDR_E79_F + TFPI2_P9_F 100.0% 81.3% 0.906
10.5 GSTM2_E153_F + NPY_E31_R 86.7% 93.8% 0.902
10.5 KDR_E79_F + GSTM2_E153_F 86.7% 93.8% 0.902
10.5 FLT4_E206_F + GSTM2_E153_F 86.7% 93.8% 0.902
10.5 GSTM2_E153_F + MT1A_P49_R 86.7% 93.8% 0.902
20 FLT4_E206_F + GSTM2_E153_F + EPHA7_E6_F 86.7% 93.8% 0.902 20 FLT4_E206_F + GSTM2_E153_F + ADCYAP1_P455_R 86.7% 93.8% 0.902 20 FLT4_E206_F + TFPI2_P9_F + GSTM2_E153_F 86.7% 93.8% 0.902 20 TFPI2_P9_F + GSTM2_E153_F + MT1A_P49_R 86.7% 93.8% 0.902 20 KDR_E79_F + TFPI2_P9_F + GSTM2_E153_F 86.7% 93.8% 0.902 20 GSTM2_E153_F + MT1A_P49_R + EPHA7_E6_F 86.7% 93.8% 0.902 20 GSTM2_E153_F + NPY_E31_R + EPHA7_E6_F 86.7% 93.8% 0.902 20 KDR_E79_F + GSTM2_E153_F + NPY_E31_R 86.7% 93.8% 0.902 20 FLT4_E206_F + GSTM2_E153_F + NPY_E31_R 86.7% 93.8% 0.902 20 FLT4_E206_F + KDR_E79_F + GSTM2_E153_F 86.7% 93.8% 0.902 20 GSTM2_E153_F + NPY_E31_R + ADCYAP1_P455_R 86.7% 93.8% 0.902 20 KDR_E79_F + GSTM2_E153_F + ADCYAP1_P455_R 86.7% 93.8% 0.902 20 KDR_E79_F + GSTM2_E153_F + EPHA7_E6_F 86.7% 93.8% 0.902 20 GSTM2_E153_F + MT1A_P49_R + ADCYAP1_P455_R 86.7% 93.8% 0.902 20 TFPI2_P9_F + GSTM2_E153_F + NPY_E31_R 86.7% 93.8% 0.902 † ranked by AUC and then the number of CpG sites in each combination (average rank is assigned if tied)