low-resolution optical stimuli, which were then compensated by an LC panel to display detailed colorful images. That is, the manipulation on three (or more) spatial and two temporal degrees of freedom was sufficient to convey full color information. The simulation results showed that the proposed method achieved acceptable color reproduction accuracy, average CIEDE2000 color difference (1E00) 3.The least number of fields par-ticularly alleviated the demand for fast-response LC modes in sequential-type LCDs. Furthermore, color break-up suppression was observed due to less chrominance difference between the two fields.
Index Terms—Color break-up (CBU), field sequential color (FSC), spatially modulated backlight.
I. INTRODUCTION
B
OTH spatial and temporal color synthesis methods, based on the principle of additive color mixing, were developed in modern display history. In 1950, a temporal field sequential color (FSC) method for color television was standardized by the Federal Communications Commission (FCC) for use in the USA [1]. This decision, however, was soon set aside in 1953 due to some system limitations and objectionable visual arti-facts, flicker and color break-up (CBU). Then, the spatial mosaic configuration, tri-chromatic triad, sprang up because of simplic-ities of design and manipulation. Consequently, the application of the mosaic method culminated in the cathode-ray tube (CRT) display in the past decades.In an era of liquid crystal display (LCD) nowadays, the mo-saic method remains to be the main design norm. Low optical throughput and high cost of color-filter materials, however, con-cern the researchers and manufacturers in the LCD industry. On the contrary, the FSC technique is capable of removing color filters to promote optical efficiency, which fulfills Green devel-opment and cost-down requirement. In particular, some FSC
Manuscript received April 16, 2009; revised June 15, 2009. Current version published October 7, 2009. This work was supported in part by the NSC and MOEA, in Taiwan, for Academic Project NSC NSC96-2628-E009-021-MY3 and Academic Project 96I510.
The authors are with the National Chiao Tung University, Depart-ment of Photonics and Institute of Electro-optical Engineering, (e-mail: ykcheng.eo92g@nctu.edu.tw; yrcheng1223.di96g@g2.nctu.edu.tw; bound-shuang@mail.nctu.edu.tw; hpshieh@mail.nctu.edu.tw).
Color versions of one or more of the figures in this paper are available online at http://ieeexplore.ieee.org.
Digital Object Identifier 10.1109/JDT.2009.2026186
tures newly inspire the research of FSC LCDs in recent years. The multi-field driving scheme, displaying more than three fields in a frame to suppress CBU, heads a route of the de-velopment of FSC LCDs. The theory is to reduce the color-fringe width of each field to suppress the sensitivity of field dis-placement [3], [4]. Nevertheless, the success of the FSC projec-tors strongly relies on the fast switching response of the light valve. Digital Micromirror Device™ (DMD™), for example, exhibits optical switching time s [5]. Yet, most com-mercial LC modes have nominal response time around 4–8 ms. An FSC LCD with slow-response LC mode may suffer color gamut shrinkage [6], color cross-talk between successive fields [7], and serious CBU. The first two issues get worse in the cases of multi-field driving schemes. Although some auxiliary solu-tions, e.g., multi-division backlight [8], are proposed to save as much time as possible for LC response, response time 4–8 ms is still an issue.
Our objective is to develop a two-field driving scheme for color-filterless FSC LCD. In contrast with multi-field driving schemes, the proposed method reduces the field number to alleviate the demand for fast-response LC modes in FSC LCDs and the associated issues. Furthermore, optical throughput is enhanced greatly, in comparison with the other two-field methods [9], [10], since color filter is removed. Finally, the display system and the proposed method will be detailed; color reproduction accuracy and CBU visibility will be examined.
II. TWO-FIELDDRIVINGSCHEME
The challenge of two-field driving scheme is the lack of the third temporal degree of freedom in displaying the third primary information. That is why special color filters were still required in the prior arts [9], [10]. Instead, we propose to incorporate a spatially modulated color backlight [11] into an LCD to substi-tute for the color filter. The construction and the algorithm of the LCD are described below, followed by the introduction of the proposed method.
A. LCD With Spatially Modulated Backlight
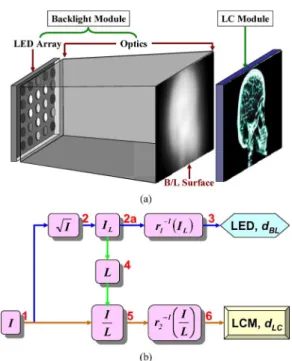
After the high-dynamic-range LCD is proposed, both the lu-minance range and power efficiency of an LCD system are im-proved remarkably. The enhancement is achieved by replacing the traditional full-on, constant backlight with the spatially mod-ulated one, as shown in Fig. 1(a) [11]. Radiant energy emanating from the backlight surface varies spatially, which is regarded as
Fig. 1. (a) An LCD with spatially modulated backlight is mainly composed of an LC module and a backlight module, which further comprises an LED array and optical structures affecting light spreading function of the light sources. (b) Flowchart to deduce the LED and the LC signals ([11]).
a low spatial resolution (stimuli) image modulated by the front LC panel to form an image with clear details.
An LCD with a spatially-modulated backlight is controlled by both the LED and the LC driving signals, which can be de-rived in either “forward” or “backward” pathways. The “for-ward” process determines the LC signals from the backlight in-formation, briefly following the sequence from target intensity, , obtaining the LED signal, , and then the LC signals, , as shown in the flowchart Fig. 1(b) [11]. On the contrary, the “backward” process determines the LED signals based on known LC signals, that is, changing the sequence of deriving and in the “forward” process [12]. It is worth noting that , , and must be threefold for three-primary color mixing. Both pathways are of equal importance and applied to the proposed two-field driving scheme.
Backlight distribution, , at step 4 is the critical connection between and . In the “forward” pathway, is ob-tained by linear superposition, (1), in which denotes the intensity of LED and the light spread function (LSF) of the LED corresponding to LC pixel at position . As for the “backward” one, the estimated LED intensity, , is acquired by pseudoinverse computation, (2); , , and are the equivalent matrix forms of , , and after moderate rearrangement
(1) (2) B. Two-Field Algorithm
The two-field driving scheme is to display two field images sequentially, which are integrated by the human visual system to form a frame image, as expressed in Fig. 2(a). This driving
Fig. 2. (a) Two-field driving scheme is to display two field images sequentially, which are integrated by the human visual system to form a frame image. This process is decomposed into (b) the first field and (c) the second field on an LCD with a spatially modulated color backlight.
scheme begins at primary assignment. The first field image com-prises the first primary and a part of the third primary infor-mation while the other includes the second primary and the re-maining part of the third primary information. Red, green, and blue, as an example shown in Fig. 2, are assigned as the first, the second, and the third primary, respectively. Blue as the third primary is beneficial to reduce visual deviation of images repro-duced by the two-field method since the human visual system is less sensitive to blue information. As a result, the first field rep-resents a magenta-like image, as shown in Fig. 2(b), while the second field is cyan-like, as shown in Fig. 2(c).
The process flow with the previous primary setting is further detailed below. Similarly, the process starts at transforming the digits of an input image into the corresponding target intensity , , of red, green, and blue information, as show in Fig. 3. In the first field, the LED and the LC signals of the red information, , are derived by the aforementioned “forward” process. The red backlight distribution, , is shown in
Fig. 3. Flowchart of the two field driving scheme.
Fig. 3 instead of red LED signals, . Besides, the red LC signals are defined as the LC compensation signals for the first field, . The blue LED signals, , and the corresponding backlight distribution, , are acquired through the “backward” process based on and . The first field image is, thus, consisted of the reproduced red and blue information, and , respectively. As for the second field, the procedure is almost the same as that of the first one except that the blue target intensity is changed to the difference between the original and the produced blue intensity in the first field, i.e., . This difference, in general, arises from the fact that derived from (2) only achieves least-square errors between and . The compensation in the second field improves the reproduction accuracy of blue information toward .
III. EXPERIMENT, OPTIMIZATION ANDDISCUSSION
A. Experiment
Accuracy of color reproduction was to evaluate the proposed method. A 37” LCD with a spatially-modulated color backlight was constructed as the testing platform. A tri-chromatic color filter of resolution 1920-by-1080 pixels was embedded in the LC panel, and 8-by-8 groups of three-in-one LED were imple-mented as light sources. The platform functioned in two ways, either as a conventional high-dynamic-range LCD at frame rate 60 Hz or a two-field LCD at frame rate 30 Hz. The differ-entiation between these two modes was the control of three sub-pixels. Three sub-pixels of a pixel were manipulated inde-pendently in the conventional one; those in the other one were controlled by the same driving signal to simulate a color fil-terless LC panel. Color difference, , between the same images separately displayed by the two modes was calculated according to CIE 2000 color difference formula (CIEDE2000) [13].
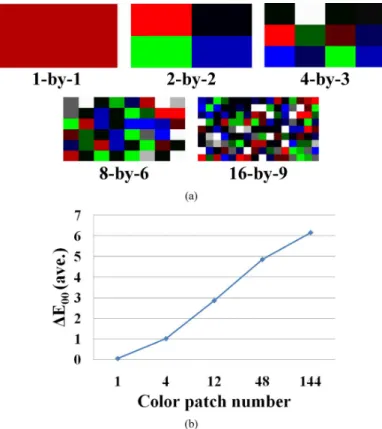
A series of random color-patch images were designed as the testing inputs. The patch number was varied in order to examine the dependency of color reproduction accuracy on the spatial frequency, as shown in Fig. 4(a). For energy conservation, the magnitude of image digits in the first mode was scaled by a factor of one-half since the tri-stimulus values measured on each patch by a colorimeter were the time-average results. The av-erage , as a result shown in Fig. 4(b), increased with the
Fig. 4. (a) A series of random color-patch images are designed as the testing inputs. (b) The average color difference,1E , variation against the color-patch number.
spatial frequency under current backlight division, 8-by-8, and the corresponding LSF, covering more than one-half the panel area. A postulation was induced that color reproduction accu-racy of the proposed driving scheme depended on the correla-tion between the image content and both the backlight division and LSF distribution.
B. Optimization on Backlight Parameters
Color reproduction accuracy, thus, was optimized by simula-tion on both the backlight division and the LSF size. Gaussian profile was applied to simulate the LSF for simplicity [14]; be-sides, the amplitude of the Gaussian LSF was adjusted with the backlight division to maintain constant maximum panel lumi-nance. In the simulation, the tri-stimulus values of each pixel were computed by a colorimetric model for high-dynamic-range LCD [15]. The LSF size was controlled by adjusting the stan-dard deviation, , of a Gaussian profile; an LSF was a squire ma-trix with width of . As shown in Fig. 5(a), the average was reduced along with the increase of backlight division. In addition, narrow LSF generally adapted to represent complex images with less color difference, as shown in Fig. 5(b). There-fore, more backlight division and narrow LSF were the design rules of the hardware for the proposed driving scheme. C. Discussion
A debate easily falls on the situation that the proposed driving scheme achieves color reproduction accuracy of less than 100%, in general. Our viewpoint is that perceived differ-ence, taking spatial-filtering effect into account, plays more
Fig. 5. The optimization on (a) backlight division and (b) LSF size to reduce average1E .
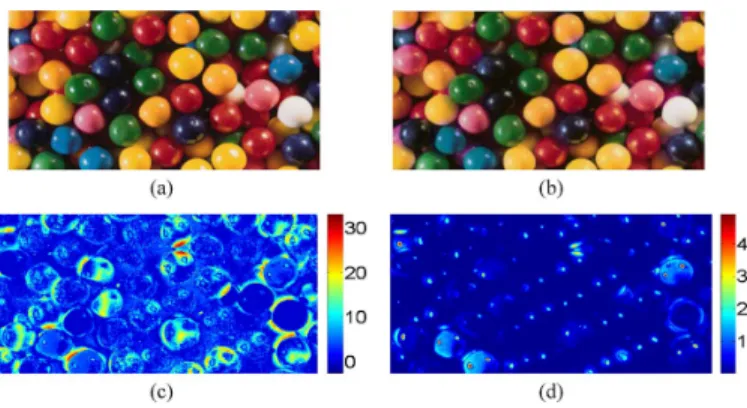
significant role than pixel-by-pixel color difference in evalu-ating image difference [16], [17]. Two images, displayed on the conventional high-dynamic-range LCD and on that for the two-field, are shown in Fig. 6(a) and (b), respectively. While the color difference map, Fig. 6(c), is directly computed pixel-by-pixel, the other, Fig. 6(d), results from computing after spatial-blurring on the opponent signals [17], which is referred to as S- . At first glance, Fig. 6(c) implies that the reproduced images by the two-field driving scheme produce apparent color difference, including average
and maximum more than 30. However, the implication is contrary to the observers’ feedback, which is much similar to that shown in Fig. 6(d) where average S- is 0.16 and maximum S- less than 4.3. Specifically, blurring masks, applied to obtaining Fig. 6(d), is currently designed for the viewing distance of one diagonal size with 2 viewing angle. When the viewing distance increases, say, more than 2 times in watching TV, the visual difference decreases generally. There-fore, the color reproduction accuracy promotes effectively with the low-pass nature of the human visual system. S- , henceforth, is recommended to be the index evaluating the proposed two-field driving scheme.
reproduced one are exhibited by the color difference maps (c) and (d), which are computed directly and after being spatially blurred, respectively.
IV. DEMONSTRATION
A. Image Reproduction
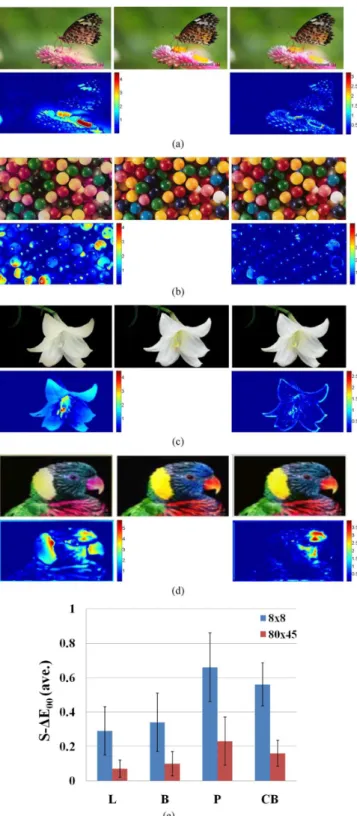
Four images were further demonstrated by simulation based on two sets of backlight division. Butterfly, Balls, Lily, and Parrot, as shown in the middle of Fig. 7(a)-(d), were the testing images representing natural scene, global color variation, high contrast, and detailed color, accordingly. The reproduced image and the S- color difference map, resulted from 8-by-8 backlight division, were in the left side while those, resulted form 80-by-45 backlight division, were in the right. Generally, both the average and the standard deviation of S- of the reproduced images, as shown in Fig. 7(e), were all below 1.0. This result confirmed the applicability of the proposed method.
According to the proposed method, the first and the second primary information were basically the same with the targets; color difference in principle arose from the inexact reproduction of the third primary information. This deduction was observed easily in the reproduced images based on 8-by-8 backlight divi-sion. Those images were de-saturated and blurred in comparison with the other reproduced images because more blue informa-tion than necessary was introduced to achieve global target lu-minance. On the contrary, the stamens of the flowers in Butterfly and Lily resulted from 80-by-45 backlight division, for example, became saturated towards the targets because of rather accu-rate blue information involved. This observation conformed that the proposed method worked well for large backlight division amount and narrow LSF.
Some strategies can further improve the color reproduction accuracy. The global analysis, firstly, is to compile primary in-formation statistically to decide the least significant one, which is chosen as the third primary redistributed into the two fields. The local analysis, furthermore, decides the third primary de-pendent on the image content. In such case, three combinations of two primary LEDs, R-G, G-B, or B-R, might be turned on at different location in single field. The least significant primary selected by either the global or the local analyses is expected to incur minimum color reproduction errors. Finally, iterative process would be a useful means to promote overall perfor-mance.
Fig. 7. A series of simulation are performed on images: (a) Butterfly (B), (b) Color Balls (CB), (c) Lily (L), and (d) Parrot (P). The target image is in the middle of each family. The reproduced ones, based on 8-by-8 and 80-by-45 backlight divisions, are put in the left and the right sides, followed by S-1E color difference maps. (e) The average and the standard deviation of S-1E are compared between the results from these two backlight divisions. Error bar, += 0 1 standard deviation, is placed.
B. CBU Examination
CBU visibility was compared between two images formed by the conventional three-field (R/G/B) and the proposed two-field methods. A high-speed camera moved horizontally in front of an LCD, with refresh rate 120 Hz, to simulate eye
Fig. 8. (a) The apparatus of capturing CBU image by a high-speed camera moving horizontally. The CBU images arise from (b) the R/G/B three-field and (c) the proposed two-field methods, respectively.
movement to capture CBU images, as shown in Fig. 8(a). The capturing time of the camera in both cases was well-arranged to ensure equal CBU width. The CBU images arose from the R/G/B three-field and the proposed two-field methods were shown in Fig. 8(b) and (c), respectively. The extracted pink ball in Fig. 8(b) displayed clear reddish and blue bands; that in Fig. 8(c) showed de-saturated magenta bands which were perceived less color separation. Similarly, the extracted white ball in Fig. 8(b) incurred more apparent contrast of color bands than that in Fig. 8(c). The result agreed with the innate feature of the two-field driving scheme in reducing CBU visibility. Namely, the contrast sensitivity between the magenta-like and cyan-like fields is generally lower than that between the opponent color, red and green, fields [17]. (An example video of synthesizing the image, Balls, could be browsed via the hy-perlink: http://adolab.ieo.nctu.edu.tw/app/news.php?Sn .)
V. CONCLUSION
A two-field driving scheme was proposed to facilitate the FSC LCD. The color reproduction achieved average CIEDE2000 color difference of less than 3. Moreover, the average CIEDE2000 values were well-below 1.0 by simulation when the low-pass nature of the human visual system was taken into account. In addition, the color breakup visibility was suppressed by reducing the contrast sensitivity between the two color fields.
The promoted optical efficiency and the reduced material cost can be realized by removing color filters. Particularly, some commercial LC modes, e.g., MVA mode, can be utilized without extra cost to perform two fields sequentially in displaying color
McGregor, MN: Voyageur Press, 2004.
[2] D. Eliav et al., “Suppression of color breakup in color-sequential multi-primary projection displays,” in SID Symp. Dig. Tech. Papers, 2005, vol. 36, pp. 1510–1513.
[3] F.-C. Lin et al., “Color breakup suppression and low power consump-tion by stencil-FSC method in field- sequential LCDs,” J. SID, vol. 17, no. 3, pp. 221–228, 2009.
[4] C.-H. Chen et al., “A field sequential color LCD based on color fields arrangement for color breakup and flicker reduction,” J. Display
Technol., vol. 5, no. 1, pp. 34–39, Jan.-Mar. 2009.
[5] L. J. Hornbeck, “Digital light processing for high-brightness, high-res-olution applications,” in Proc. SPIE Projection Displays III, 1997, vol. 3013, pp. 27–40.
[6] S. Kobayashi et al., “Fabrication and electro-optic characteristics of polymer- stabilized V-mode ferroelectric liquid crystal display and in-trinsic H-V-mode ferroelectric liquid crystal displays: their application to field sequential full color active matrix liquid crystal displays,” Opt.
Eng., vol. 43, no. 2, pp. 290–298, 2004.
[7] K. J. Hwang et al., “The future design impact of large size color se-quential TFT-LCD,” in SID Symp. Dig. Tech. Papers, 2008, vol. 39, pp. 1177–1180.
[8] K. Kalantar et al., “Spatio-temporal scanning backlight for color-field sequential optically compensated bend liquid-crystal display,” in SID
Symp. Dig. Tech. Papers, 2005, vol. 36, pp. 1316–1319.
[9] L. D. Silverstein, “STColor: Hybrid spatial-temporal color synthesis for enhanced display image quality,” in SID Symp. Dig. Tech. Papers, 2005, vol. 36, pp. 1112–1115.
[10] M. J. J. Jak et al., “Spectrum sequential liquid crystal display,” in SID
Symp. Dig. Tech. Papers, 2005, vol. 36, pp. 1120–1123.
[11] H. Seetzen et al., “High dynamic range display system,” ACM Trans.
Graphics, vol. 23, no. 3, pp. 760–768, 2004.
[12] F. Li et al., “Deriving LED driving signal for area-adaptive LED back-light in high dynamic range LCD display,” in SID Symp. Dig. Tech.
Papers, 2007, vol. 38, pp. 1794–1797.
[13] G. Sharma et al., “The CIEDE2000 color-difference formula: Imple-mentation notes, supplementary test data, and mathematical observa-tions,” Color Res. Appl., vol. 30, no. 1, pp. 21–30, 2005.
[14] Y.-K. Chen et al., “Design and evaluation of light spread function for area-adaptive LCD system,” J. Display Technol., vol. 5, no. 2, pp. 66–71, Jan.-Mar. 2009.
[15] Y.-K. Cheng and H.-P. D. Shieh, “Colorimetric characterization of high dynamic range liquid crystal displays and its application,” J. Display
Technol., vol. 5, no. 1, pp. 40–45, 2009.
[16] X. Zhang and B. A. Wandell, “A spatial extension of CIELAB for dig-ital color image reproduction,” in SID Symp. Dig. Tech. Papers, 1996, vol. 27, pp. 731–734.
[17] G. M. Johnson and M. D. Fairchild, “A top down description of S-CIELAB and CIEDE2000,” Color Res. Appl., vol. 28, no. 6, pp. 425–435, 2003.
University (NCTU), Hsinchu, Taiwan.
He is currently an Assistant Professor in the Department of Photonics & Display Institute, National Chiao Tung University, Hsinchu, Taiwan. He was a project leader in the technology center of AU Optronics (AUO) Corporation. He had joined the group of Photonics and Communications Laboratory, the School of Optics/CREOL, University of Central Florida (UCF), Orlando, as an internship student from 2001 to 2002. His current research interests are advanced display systems (high dynamic range LCD and field sequential LCD), display human vision evaluation, 3-D displays, and display optics. He has published 7 journal papers, 20 international conference papers, and has 11 US patents (5 granted, 6 pending) to his credit.
Dr. Huang was awarded the SID2001 Best Student Paper Award, SID2004 distinguished student paper award, 2005 Golden Thesis Award of Acer Foundation, and 2005 AUO Bravo Award. He had successfully developed advanced-MVA LCD for the next generation products of AUO in 2005.
Yi-Ru Cheng received the M.S. degree from Institute of Display, National
Chaio Tung University, Hsinchu, Taiwan, in 2009.
Her current interests include field sequential color display and other power saving techniques.
Han-Ping D. Shieh (S’79–M’86–SM’91–F’08)
received the B.S. degree from National Taiwan University in 1975 and the Ph.D. degree in electrical and computer engineering from Carnegie Mellon University, Pittsburgh, PA, in 1987. He joined National Chiao Tung University (NCTU), Hsinchu, Taiwan, as a Professor at Institute of Opto-Electronic Engineering and Microelectronics and Information Research Center (MIRC) in 1992 after as a Research Staff Member at IBM TJ Watson Research Center, Yorktown Heights, NY, since 1988. He is now the Dean, College of Electrical and Computer Engineering, NCTU and AU Optronics Chair Professor. His current research interests are in display, optical MEMS, nano-optical components, and solar energy. He currently serves as a Director, SID (Society for Information Display), and has served as program chair, committee member, organized conferences in major data storage (ISOM, MORIS, Intermag, ODS, APDSC) and display (SID, IDRC, ASID, FPD Expo, etc.). He has published more than 140 journal papers and has more 30 patents to his credit. He is an Associate Editor of IEEE/OSA JOURNAL OF DISPLAY TECHNOLOGY and Journal of Society for Information Display. He is the Fellow of OSA and SID (Society for Information Display).