Statistical methods for identifying yeast cell cycle
transcription factors
Huai-Kuang Tsai*, Henry Horng-Shing Lu†, and Wen-Hsiung Li*‡§
*Genomics Research Center, Academia Sinica, Nankang, Taipei 115, Taiwan;†Institute of Statistics, National Chiao Tung University, 1001 Ta Hsueh Road, Hsinchu 30050, Taiwan; and‡Department of Ecology and Evolution, University of Chicago, 1101 East 57th Street, Chicago, IL 60637
Contributed by Wen-Hsiung Li, July 13, 2005
Knowing transcription factors (TFs) involved in the yeast cell cycle is helpful for understanding the regulation of yeast cell cycle genes. We therefore developed two methods for predicting (i) individual cell cycle TFs and (ii) synergistic TF pairs. The essential idea is that genes regulated by a cell cycle TF should have higher (lower, if it is a repressor) expression levels than genes not regulated by it during one or more phases of the cell cycle. This idea can also be used to identify synergistic interactions of TFs. Apply-ing our methods to chromatin immunoprecipitation data and microarray data, we predict 50 cell cycle TFs and 80 synergistic TF pairs, including most known cell cycle TFs and synergistic TF pairs. Using these and published results, we describe the behaviors of 50 known or inferred cell cycle TFs in each cell cycle phase in terms of activation兾repression and potential positive兾negative interactions between TFs. In addition to the cell cycle, our methods are also applicable to other functions.
cell cycle regulators兩 microarray data 兩 synergistic interactions
T
o understand how cell cycle genes are regulated, it is useful to identify transcription factors (TFs) that are cell cycle regulators. In the yeast Saccharomyces cerevisiae, a number of such TFs have already been identified through various approaches (1–4). A recent powerful tool is the chromatin immunoprecipitation (ChIP)-chip technique, which utilizes ChIP to isolate DNA bound by a TF and applies microarrays to precipitated DNAs to identify genes bound by the TF. Using this technique, Lee et al. (4) identified 11 cell cycle TFs. Assuming that genes coordinately bound are coordinately expressed, they also determined several TFs that might have combinatorial or synergistic regulations.Many bioinformatic methods have been proposed to identify synergistic pairs of TFs (5–10). Some of these methods (9, 10) assume that a pair of TFs is synergistic if genes regulated by both TFs show stronger coexpression patterns than the expression patterns of genes regulated by either TF alone. This type of method requires data collected over multiple time points to calculate the degree of coexpression, and some of these methods ignore the additive effects of the two TFs (5, 8–10). Also, a pair of TFs may interact only under certain conditions, whereas these methods consider all time points, which may introduce noise.
In this study, we propose two methods to find, respectively, individual TFs and synergistic pairs of TFs that are cell cycle regulators in yeast. The essential idea is that if a TF is a cell cycle regulator, then genes regulated and not regulated by it should, on average, have significantly different expression levels during one or more phases of the cell cycle (5). The target genes of TFs are collected from four TF databases (11–14) and ChIP-chip data (15), and the expression data of yeast genes are gathered from the microarray data of Spellman et al. (16). In this study, the majority of known cell cycle-related TFs and synergistic pairs are identified. Combining our inferences with published results, we describe the regulatory behaviors of 50 TFs in terms of activation兾repression and positive兾negative interaction between TFs.
Materials and Methods
Data Processing.We use the data set of Spellman et al. (16) that contains expression profiles of 6,178 ORFs in the yeast genome
during the cell cycle with␣-factor arrest. Eighteen time points are studied. We revert the log ratios of cDNA microarray data (16) to the original values by taking the exponent of two. (We do not use the log-transformed values, because we will take the average of the expression levels of a gene at the time points studied in each cell cycle phase.) To estimate the average expression level of genes in a group at a specific phase, we first calculate the average expression level of each gene over the time points in the phase and then take the mean of the average expression levels of these genes in the same group.
Method for Identifying Cell Cycle TFs. Our first method is for detecting cell cycle TFs. The main steps are as follows:
Step 1.The known or putative target genes of each known TF are collected from four TF databases (11–14) and ChIP-chip data (15). Step 2.A gene is said to be potentially bound or regulated by TF␣ if there is evidence from the four databases, or if its p value in the TF ␣ ChIP-chip experiment (pc) is smaller than a certain low
threshold (e.g., pc⬍ 0.0001), whereas a gene is said not to be bound
or regulated by TF␣ if its p value in the TF ␣ ChIP-chip experiment is larger than a certain high threshold (e.g., pc⬎ 0.8). For TF␣, we
generate two gene groups, G␣and G⫺␣: a gene belongs to group G␣ if it is potentially regulated by TF␣ but to group G⫺␣if it is not regulated by TF␣.
Step 3.TF␣ is said to be a cell cycle regulator if (i) there exists at least one phase of the cell cycle where the expression levels of genes in G␣are significantly different from the expression levels in one or more of the other phases, and (ii) the expression levels of genes in G␣are on average significantly higher (or lower) than those of genes in G⫺␣in at least one phase of the cell cycle. We consider five cell cycle phases: G1, S, S兾G2, G2兾M, and M兾G1.
We use the Kolmogorov–Smirnov (KS) test to examine the two statistical criteria in Step 3. The KS test is a nonparametric test to determine whether two distributions differ significantly. The KS test calculates the maximum vertical deviation (D) between the empirical distribution functions of the two groups to determine whether the two data sets are drawn from the same distribution. Let x be the average expression level of a gene over all experimental points in a cell cycle phase. Let fi(x) be the density function of x for
the genes in group i and Fi(x) be the corresponding (cumulative)
distribution function. For groups i and j, if the statistic D is significantly large, we infer that the two groups of genes are from two different distributions and are expressed differently.
For a given TF, we perform 10 KS tests for C25⫽ 10 possible pairs
of the five phases to examine the first criterion in Step 3. If at least one test has a p value lower than 0.01, we proceed to the next test. Otherwise, the TF will not be considered further.
A similar method is applied to examine whether the expression levels of genes in G␣are on average significantly higher (or lower) than those of genes in G⫺␣in at least one phase of the cell cycle. For each phase, we test H0: FG␣⫽ FG⫺␣vs. H1: FG␣⫽ FG⫺␣by using
Abbreviations: TF, transcription factor; ChIP, chromatin immunoprecipitation; KS, Kolmog-orov–Smirnov; MW, Mann–Whitney.
§To whom correspondence should be addressed. E-mail: [email protected].
the two-sided KS test, where F denotes the distribution function of the expression levels of genes in a specific group. If H0is rejected,
we compare the statistics D⫺⫽ supx[FG␣(x)⫺ FG⫺␣(x)] and D⫹⫽
supx[FG⫺␣(x) ⫺ FG␣(x)] of the two distributions to determine
whether FG␣⬍stFG⫺␣(i.e., D⫺⬍ D⫹) or FG␣⬎stFG⫺␣(i.e., D⫺⬎
D⫹). FG␣⬍stFG⫺␣means that the expression levels in group G␣are
stochastically greater than their corresponding expression levels in G⫺␣group. Fig. 2, which is published as supporting information on the PNAS web site, gives an example to show how the KS test works. Method for Identifying Synergistic TF Pairs.Our second method is to test whether there is synergistic interaction between two TFs during any phase of the cell cycle. The procedure is as follows:
Step 1.Before testing whether two TFs (say␣ and ) interact, we study whether they are associated in the same gene more often than random expectation. That is, let N1be the total number of genes in
G␣, N2be the total number of genes in G, N12be the number of
genes in G␣,, and N be the total number of genes in the yeast genome and calculate whether N12兾N is greater than the random
expectation (N1兾N) ⫻ (N2兾N). This test, in spirit, is similar to the
2test of independence. Suppose that the random variables of row
and column factors are independent. Then the joint probability of N12兾N should be equal to the product of the two marginal
proba-bilities, (N1兾N) ⫻ (N2兾N). If there exists a positive association, then
N12兾N will be greater than (N1兾N) ⫻ (N2兾N). (This step can be
skipped if one wishes to find more potential synergic pairs.) Step 2.For each pair with significant association, we test whether there exists at least one phase of the cell cycle where the expression levels of genes in G␣,are significantly different from the expression levels in one or more of the other phases.
Step 3.We generate four groups of genes, G␣,, G␣,⫺, G⫺␣,, and G⫺␣,⫺, and collect their expression data under different cell cycle phases. For most pairs, we set the threshold (pc) as⬎0.8 to define
a gene not regulated by a specific TF. However, some pairs require a lower threshold (pc) to have a sufficient number of genes in group
G␣,⫺or G⫺␣,for performing the ANOVA test (at least five in each group).
Step 4.We test the following model using ANOVA on the expres-sion data of four groups:
Oijk⫽ ⫹ i⫹j⫹ij⫹ ijk,
where i⫽␣ or ⫺␣; j ⫽  or ⫺; k represents gene k in group G␣,, G␣,⫺, G⫺␣,, or G⫺␣,⫺; Oijkis the observed average expression
level of gene k in group G␣,, G␣,⫺, G⫺␣,, or G⫺␣,⫺; is the overall mean;iis the mean in group G␣or G⫺␣;jis the mean in
group Gor G⫺;ijis the interaction effect to be estimated; and
ijk is the random noise. If the estimate of the term ␣ is
significantly positive (negative), then there is positive (negative) interaction between TFs␣ and . Note that when a TF (say ) does not have a DNA-binding domain, we assume that its single effect does not exist and modify the model as
Oijk⫽ ⫹ i⫹ij⫹ ijk.
To test a third-order interaction among TFs␣, , and ␥, we may first check whether the three TFs are associated more often than expected and then analyze the following ANOVA model to test the significance of␣␥:
Oijmk⫽ ⫹ i⫹j⫹m⫹ij⫹im⫹jm⫹ijm⫹ ijmk.
Because this test requires more data than are presently available, we will not pursue it in this study.
Results
We use the microarray data of Spellman et al. (16) for gene expression during the cell cycle. Different pcvalues (the p value in
the ChIP-chip data) are used to define whether a gene is potentially
bound or regulated and not bound or regulated by a specific TF. We performed some different thresholds for binding (ranging from 0.0001 to 0.01) and not binding (ranging from 0.2 to 0.8) to select the thresholds for a balance between the false positive and false negative rates. As shown in Fig. 3, which is published as supporting information on the PNAS web site, the proposed method is robust to the selection of binding and not binding thresholds. Because five tests for the five cell cycle phases are performed for every TF and every TF pair, it is necessary to do the correction for multiple tests. We use the false discovery rate (q value) instead of the Bonferroni correction for a balance between the numbers of true and false positives (17). From the p and q values of a test (all methods use the same definition), three confidence levels are defined: confident (p⬍ 10⫺5and q⬍ 10⫺5), plausible (p⬍ 0.001 and q ⬍0.001), and doubtful (p⬍ 0.01 and q ⬍ 0.01). We also use permutation tests to verify our methods. The results are shown in Fig. 4, which is published as supporting information on the PNAS web site. We find that the p value of the permutation test is close to the estimated p value, indicating the reliability of our results.
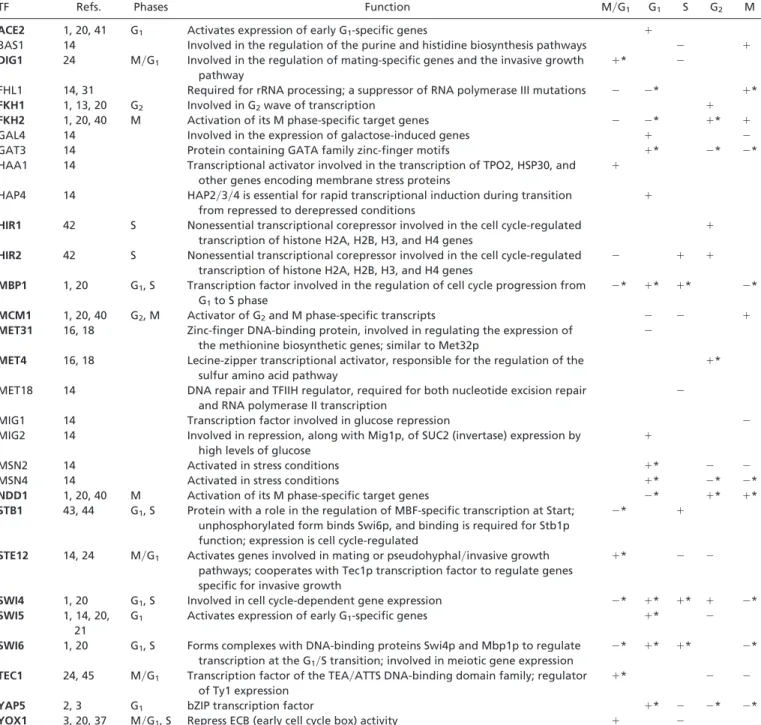
Identifying Cell Cycle TFs.Our first method identifies 30 TFs to be confident or plausible when we set pc⬍ 0.0001 for the definition of
TF binding. Table 1 shows the functions and involved phases (with literature evidence) of the 30 TFs. Among these TFs, 19 have already been experimentally verified to be cell cycle TFs; here we include MET31 and MET4, which were identified by Spellman et al. (16, 18) and Tavazoie et al. (18). Tables 3–5, which are published as supporting information on the PNAS web site, show the results of the KS test with different binding thresholds. We also use the Mann–Whitney (MW) test and find that the KS and MW tests give congruent results (Tables 3–5 and Tables 6–8, which are published as supporting information on the PNAS web site). The MW test is equivalent to the Wilcoxon rank sum test, which is designed to test the shift of locations among two distributions. However, this kind of test cannot be used to detect the change of scales and shapes between two distributions. The KS test serves as an omnibus test for this purpose (19). We can compare the results generated from the MW and KS tests to explore whether two distributions change locations, scales, and shapes significantly. In our studies, the results of the MW and KS tests are similar, indicating that the differences between the two distributions are mainly the shift of locations.
Table 1 missed 11 of the 30 known cell cycle TFs. When the binding threshold (pc) becomes less stringent (i.e., larger), more
known TFs can be predicted. For example, when we set pc⬍ 0.01,
25 known cell cycle TFs are found, including six additional known cell cycle TFs: RCS1, RME1, XBP1, ASH1, SUM1, and NDT80. Five known TFs (HIR3, SKN7, YHP1, UME6, and IME1) cannot be inferred by our method; although their pKSare small, their qKS
are not low enough to pass our criteria. Note also that although selecting a higher (less stringent) binding threshold can identify more known cell cycle TFs, it may also include more irrelevant TFs. Table 1 also shows the predicted regulatory behaviors of the 30 confident or plausible TFs. Most TFs are differentially expressed during one or more phases of the cell cycle, suggesting that most of these TFs have a high probability to be cell cycle related. Let us consider two examples. First, FKH1 is involved in a G2wave of
transcription, and genes in GFKH1have indeed a significantly higher
expression level than genes in G⫺FKH1 in the G2phase. Second,
SWI5 activates transcription of genes expressed in the G1phase,
and genes in GSWI5are expressed significantly higher than genes in
G⫺SWI5 in the G1 phase. These inferences are consistent with
evidence from the literature.
Fig. 5, which is published as supporting information on the PNAS web site, shows the average expression level of each gene group regulated by one of the 30 TFs identified to be putative cell cycle regulators during different phases. Most of the expression patterns support our inferences. For example, genes in GFKH2are expressed
at a lower level than genes in G⫺FKH2in M兾G1and G1but are
expressed at a higher level than are genes in G⫺FKH2in G2, and the
expression level of FKH2 itself is low in M兾G1and G1but high in
G2. These observations indicate that FKH2 is a cell cycle activator
for genes in GFKH2during the G
2phase. It is known that the YOX1
transcription peaks in the late G1phase, and this initiates repression
of the early cycle box activity until the late M phase (20). The regulatory behavior of YOX1 and the expression levels of genes in GYOX1are consistent with the above description. ACE2 and SWI5
are thought to be activators in G1, and we find that the average
expression levels of genes in GACE2and GSWI5in the G
1phase are
significantly higher than those in G⫺ACE2and G⫺SWI5, respectively.
The ACE2 and SWI5 genes are transcribed in G2(21), and the
localization of these two proteins to the nucleus occurs during G1,
so that they are active in G1 instead of G2(22, 23). Therefore,
combining Table 1, Fig. 5, and, sometimes, literature survey, one can infer which TFs are activators and which are repressors. Synergistic Pairs of Cell Cycle TFs.The second method is applied to test synergistic interaction between two TFs (Table 9, which is published as supporting information on the PNAS web site). A total of 203 TFs are used, so that there are 20,503 possible pairs of TFs. When a very stringent criterion (pc⬍ 0.0001) is used to define TF
Table 1. Thirty TFs identified as confident or plausible cell cycle TFs by the KS test with pc<0.0001
TF Refs. Phases Function
Predicted behaviors
M兾G1 G1 S G2 M
ACE2 1, 20, 41 G1 Activates expression of early G1-specific genes ⫹
BAS1 14 Involved in the regulation of the purine and histidine biosynthesis pathways ⫺ ⫹
DIG1 24 M兾G1 Involved in the regulation of mating-specific genes and the invasive growth
pathway
⫹* ⫺
FHL1 14, 31 Required for rRNA processing; a suppressor of RNA polymerase III mutations ⫺ ⫺* ⫹*
FKH1 1, 13, 20 G2 Involved in G2wave of transcription ⫹
FKH2 1, 20, 40 M Activation of its M phase-specific target genes ⫺ ⫺* ⫹* ⫹
GAL4 14 Involved in the expression of galactose-induced genes ⫹ ⫺
GAT3 14 Protein containing GATA family zinc-finger motifs ⫹* ⫺* ⫺*
HAA1 14 Transcriptional activator involved in the transcription of TPO2, HSP30, and
other genes encoding membrane stress proteins
⫹
HAP4 14 HAP2兾3兾4 is essential for rapid transcriptional induction during transition
from repressed to derepressed conditions
⫹
HIR1 42 S Nonessential transcriptional corepressor involved in the cell cycle-regulated
transcription of histone H2A, H2B, H3, and H4 genes
⫹
HIR2 42 S Nonessential transcriptional corepressor involved in the cell cycle-regulated
transcription of histone H2A, H2B, H3, and H4 genes
⫺ ⫹ ⫹
MBP1 1, 20 G1, S Transcription factor involved in the regulation of cell cycle progression from G1to S phase
⫺* ⫹* ⫹* ⫺*
MCM1 1, 20, 40 G2, M Activator of G2and M phase-specific transcripts ⫺ ⫺ ⫹
MET31 16, 18 Zinc-finger DNA-binding protein, involved in regulating the expression of
the methionine biosynthetic genes; similar to Met32p
⫺
MET4 16, 18 Lecine-zipper transcriptional activator, responsible for the regulation of the
sulfur amino acid pathway
⫹*
MET18 14 DNA repair and TFIIH regulator, required for both nucleotide excision repair
and RNA polymerase II transcription
⫺
MIG1 14 Transcription factor involved in glucose repression ⫺
MIG2 14 Involved in repression, along with Mig1p, of SUC2 (invertase) expression by
high levels of glucose
⫹
MSN2 14 Activated in stress conditions ⫹* ⫺ ⫺
MSN4 14 Activated in stress conditions ⫹* ⫺* ⫺*
NDD1 1, 20, 40 M Activation of its M phase-specific target genes ⫺* ⫹* ⫹*
STB1 43, 44 G1, S Protein with a role in the regulation of MBF-specific transcription at Start; unphosphorylated form binds Swi6p, and binding is required for Stb1p function; expression is cell cycle-regulated
⫺* ⫹
STE12 14, 24 M兾G1 Activates genes involved in mating or pseudohyphal兾invasive growth
pathways; cooperates with Tec1p transcription factor to regulate genes specific for invasive growth
⫹* ⫺ ⫺
SWI4 1, 20 G1, S Involved in cell cycle-dependent gene expression ⫺* ⫹* ⫹* ⫹ ⫺*
SWI5 1, 14, 20,
21
G1 Activates expression of early G1-specific genes ⫹* ⫺
SWI6 1, 20 G1, S Forms complexes with DNA-binding proteins Swi4p and Mbp1p to regulate
transcription at the G1兾S transition; involved in meiotic gene expression
⫺* ⫹* ⫹* ⫺*
TEC1 24, 45 M兾G1 Transcription factor of the TEA兾ATTS DNA-binding domain family; regulator of Ty1 expression
⫹* ⫺ ⫺
YAP5 2, 3 G1 bZIP transcription factor ⫹* ⫺ ⫺* ⫺*
YOX1 3, 20, 37 M兾G1, S Repress ECB (early cell cycle box) activity ⫹ ⫺
Nineteen TFs (in boldface) have literature support for being cell cycle TFs. The predicted regulatory behaviors of each TF during different phases are also shown. In each entry,⫹ (⫺) indicates that the expression level of genes in Gais significant higher (lower) than that of G⫺a. If pKSis larger than the threshold, we leave the entry empty. All known activation phases of TFs are correctly predicted by our method. The confident activation phases of TFs are indicated by*.
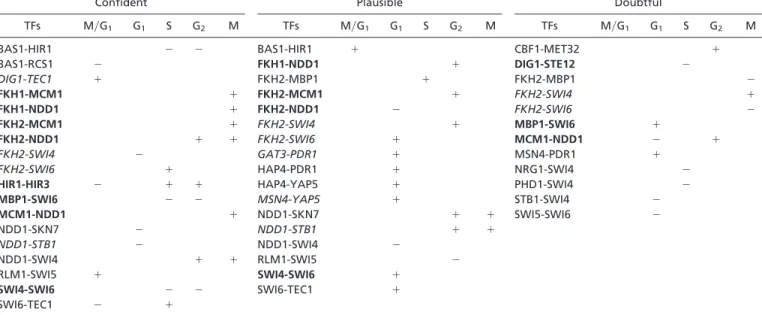
binding, we identify 18 confident pairs, which include eight known (experimentally verified) synergistic pairs. A total of 30 pairs are identified as confident, plausible, or doubtful, and this set includes 9 of the 12 known synergistic pairs. For the other three known pairs (ACE2-SWI5, HIR1-HIR2, and HIR2-HIR3), the numbers of genes in groups G␣,⫺ and G⫺␣, are too small to perform the ANOVA analysis. These three known pairs can be identified when the TF-binding criterion is relaxed to be 0.001. Combining the results using pc⬍ 0.0001 and pc⬍ 0.001, we identify 103 pairs, which
is much smaller than the 20,503 possible pairs from 203 TFs and provides a reasonably small number of TF pairs to be tested experimentally. Interestingly, this set includes all of the 12 known synergistic pairs: ACE2-SWI5 (21), DIG1-STE12 (24), FKH1-NDD1 (25), FKH1-MCM1 (26), FKH2-MCM1 (26), FKH2-FKH1-NDD1 (26), HIR1-HIR2 (27), HIR2-HIR3 (11), HIR1-HIR3 (11), MCM1-NDD1 (25), SWI4-SWI6 (SBF) (28), and MBP1-SWI6 (MBF) (2). Furthermore, our predictions for the activation function of all these pairs are consistent with literature evidence. For example, ACE2-SWI5, MBP1-SWI6, and SWI4-SWI6 activate genes at the G1phase.
Table 2 shows the results of an ANOVA analysis with pc ⬍
0.0001; for pc⬍ 0.001, see Table 10, which is published as supporting
information on the PNAS web site. Our results provide some interesting insights. Let us consider some examples. First, DIG1 and TEC1 are involved in the MAP kinase (MAPK) signaling pathway, and both regulate TEC1, FUS1, PCL2, MSB2, STE12, and PRM1 (TEC1 is self-regulated). All these genes have a higher expression level at the M兾G1 phase than at other phases and are either
pheromone-related or involved in the MAPK pathway. Our results suggest that DIG1 and TEC1 cooperatively activate these genes at the M兾G1 phase. Second, RLM1 is responsible for cell wall
organization and biogenesis, whereas SWI5 activates transcription of genes in the G1phase and the M兾G1boundary. The target genes
of the pair RLM1-SWI5, including CRH1, HSP150, PIR3, PIR1, and YLR194C, are required for cell wall architecture and stability (11) and are considered to be cell cycle genes at the M兾G1phase (16).
Third, NDD1-YOX1 regulates cell cycle genes (16) KIN3, DBF2, SPO12, UTH1, and MFA2, which function as part of a network in exit from mitosis or mating pheromone␣-factor.
In Tables 2 (pc⬍ 0.0001) and 10 (pc⬍ 0.001), 80 synergistic pairs
from 39 TFs are considered as confident or plausible in the analysis. Fig. 6, which is published as supporting information on the PNAS web site, shows the synergy relations for these TF pairs. Many TFs form a group in which TFs are synergistic with each other and coregulate genes at the same time. For example, HIR1, HIR2, and HIR3 help control the cell cycle transcription of histone genes (29) and in our results, these three genes form a synergistic group at the S and G2phases. As another example, MCM1, NDD1, and FKH1兾
FKH2 are the critical activators of a group of M phase-specific transcripts (20), and we find that these three genes form a syner-gistic group at the M phase. Similarly, MCM1-NDD1-REB1 and DAT1-HAP1-MSN4 function at M and G1, respectively.
Discussion
Several published methods use similar data (e.g., ChIP-chip data, motif information, and expression data) and兾or similar analysis approaches (e.g., group genes by presence兾absence of binding in ChIP-chip experiments; compare the correlation of expression levels of genes with the same motifs and assess whether the reduction in variance is significant) to identify synergistic TF pairs (5, 6, 9, 10, 30). In particular, Banerjee and Zhang (9) used Lee et al.’s (4) ChIP-chip data and Cho et al.’s (31) expression data and identified 31 TF pairs with a significant level of cooperativity. They considered 10 of these TF pairs to be cell cycle related, including eight literature-supported TF pairs. Our method has identified all of these synergistic pairs and identified four other synergistic pairs with literature support (HIR1-HIR3, HIR2-HIR3, FKH1-MCM1, and DIG1-STE12). Four pairs considered as uncharacterized func-tional pairs by Banerjee and Zhang (9) (GAT3-PDR1, FHL1-GAT3, GAT3-MSN4, and MSN4-YAP5) are also identified by our method. In addition, our results are consistent with those of Kato et al. (30), who integrated sequence, expression, and localization data to identify combinatorial regulation of TFs and binding motifs. Das et al. (5) applied the method of multivariate adaptive regression splines (MARS) to study the correlation of the occur-rences of TFs and the expression levels of genes bound by TFs. This is a nonparametric adaptive regression method. With spline basis functions in the MARS model, it is more flexible to model the correlation of TFs and expression levels of genes from observations. However, a large number of observations are required to estimate Table 2. Putative cell cycle synergistic pairs of TFs identified by the ANOVA model with pc<0.0001
Confident Plausible Doubtful
TFs M兾G1 G1 S G2 M TFs M兾G1 G1 S G2 M TFs M兾G1 G1 S G2 M
BAS1-HIR1 ⫺ ⫺ BAS1-HIR1 ⫹ CBF1-MET32 ⫹
BAS1-RCS1 ⫺ FKH1-NDD1 ⫹ DIG1-STE12 ⫺ DIG1-TEC1 ⫹ FKH2-MBP1 ⫹ FKH2-MBP1 ⫺ FKH1-MCM1 ⫹ FKH2-MCM1 ⫹ FKH2-SWI4 ⫹ FKH1-NDD1 ⫹ FKH2-NDD1 ⫺ FKH2-SWI6 ⫺ FKH2-MCM1 ⫹ FKH2-SWI4 ⫹ MBP1-SWI6 ⫹ FKH2-NDD1 ⫹ ⫹ FKH2-SWI6 ⫹ MCM1-NDD1 ⫺ ⫹ FKH2-SWI4 ⫺ GAT3-PDR1 ⫹ MSN4-PDR1 ⫹
FKH2-SWI6 ⫹ HAP4-PDR1 ⫹ NRG1-SWI4 ⫺
HIR1-HIR3 ⫺ ⫹ ⫹ HAP4-YAP5 ⫹ PHD1-SWI4 ⫺
MBP1-SWI6 ⫺ ⫺ MSN4-YAP5 ⫹ STB1-SWI4 ⫺
MCM1-NDD1 ⫹ NDD1-SKN7 ⫹ ⫹ SWI5-SWI6 ⫺ NDD1-SKN7 ⫺ NDD1-STB1 ⫹ ⫹ NDD1-STB1 ⫺ NDD1-SWI4 ⫺ NDD1-SWI4 ⫹ ⫹ RLM1-SWI5 ⫺ RLM1-SWI5 ⫹ SWI4-SWI6 ⫹ SWI4-SWI6 ⫺ ⫺ SWI6-TEC1 ⫹ SWI6-TEC1 ⫺ ⫹
Three confidence levels are defined: confident (pANOVA⬍ 10⫺5and qANOVA⬍ 10⫺5), plausible (pANOVA⬍ 0.001 and qANOVA⬍ 0.001), and doubtful (pANOVA⬍ 0.01 and qANOVA⬍ 0.01). A paired TF is indicated in boldface if it is supported by literature evidence and italic if the two TFs have physical interactions or have been predicted as a cell cycle synergistic pair in previous studies.
the coefficients and knots for the spline basis functions in MARS. In existing studies of yeast cell cycle TFs, only a few observations (microarray data) are available for a phase. Therefore, we propose the ANOVA-type approach in this study.
In comparison with current methods, our method has the fol-lowing advantages: (i) it can detect more synergistic pairs, (ii) it can infer the activation (repression) phase, and (iii) it does not require multiple time points.
In the analysis of individual TFs (Tables 3 and 4) and of synergistic pairs (Tables 2 and 9), 50 TFs are considered confident or plausible as individual cell cycle TFs or as synergistic TF pairs. Twenty-four of these 50 regulators are indeed known cell cycle regulators. In addition, for some TFs such as GAT3, HAA1, MET18, and RLM1, half of their target genes are cell cycle genes according to Spellman et al. (16). Some other TFs have been identified to be regulators in other pathways, such as BAS1 in biosynthesis pathway, FHL1 in rRNA processing, GAL4 in galac-tose-induction, MIG1 and MIG2 in glucose repression, and MSN2
and MSN4 in stress conditions. Whether these TFs are really cell cycle TFs needs to be investigated in the future.
Combining the present and published results, we propose a model to describe the regulatory behaviors of the 50 known or putative cell cycle regulators (Fig. 1); there are 37, 23, 34, 25, and 22 TFs involved in phases M兾G1, G1, S, G2, and M, respectively. In
the G1phase, SKN7 (4, 32) and STB1 (4, 33) contribute directly to
G1-specific transcription. ASH1 serves to repress the late G1
-specific transcription of HO and prevents mating-type switching (34, 35). RME1 acts as an activator of at least one late G1-specific
transcript, CLN2 (20, 36). ACE2 and SWI5 are thought to be cooperative activators at the G1phase (22, 23). SWI4, SWI6, and
MBP1 are involved at the G1phase, and SWI4-SWI6 (SBF) (28)
and MBP1-SWI6 (MBF) (2) activate late G1and early S genes. All
these verified cell cycle TFs are predicted to function at the G1
phase by our methods (ASH1 can be identified when we relax the binding threshold to 0.01; see Table 5).
In the S phase, YOX1 transcription peaks in the late G1(31) and
represses the early cell cycle box (bound by MCM1) activity until
Fig. 1. The regulatory behaviors of 50 known or putative yeast cell cycle TFs. The descriptions are from Tables 1– 4 and 9 and the literature. TF␣ in red (blue) means that genes in G␣are expressed significantly higher (lower) than genes in G⫺␣. TF in black means that, although it is not identified by the first method (detection of individual TFs), it is detected by the second method (detection of synergistic pairs). A TF filled with green means a known cell cycle TF, yellow means highly confident, and gray means plausible. An edge connecting two TFs implies that the two TFs are synergistic according to our analysis. An edge (␣,) in red (blue) means that TFs␣ and  have positive (negative) synergy; plausible pairs are in thin lines, and highly confident pairs are in thick lines. A synergistic pair in green means supported by literature, and a synergistic pair in yellow means consistent with predictions of other studies.
the M phase (37). For HIR1-HIR2 (or HIR1-HIR3 or HIR2-HIR3), they function as transcriptional corepressors to regulate histone gene transcription in the yeast cell cycle, but they must be transiently inactivated at the G1兾S phase boundary for the
tran-scription of histone genes to be derepressed (27). Therefore, HIR1, HIR2, and HIR3 are indeed corepressors, but genes regulated by them are derepressed in the S and G2phases (16, 30, 38). Further,
some studies suggest that FKH1 and FKH2 are also involved in the S phase (1, 4, 30, 39). All these verified cell cycle TFs and synergistic pairs are predicted to function in the S phase by our methods.
Transcriptional control in the G2 and M phases is less well
characterized. The present understanding is that NDD1 is the critical activator of a group of M phase-specific transcripts (13, 20, 25, 40). This M phase-specific transcription requires FKH1兾FKH2 as well as MCM1 and NDD1. Our methods indicate that FKH2, NDD1, MCM1, FKH1-MCM1, FKH2-MCM1, and MCM1-NDD1 function in the M phase. Other studies (1, 4) suggested that MCM1, together with FKH1 or FKH2, recruits the NDD1 protein in late G2, and that FKH1, NDD1, and FKH2-MCM1 function in the G2
phase.
In the M兾G1phase, the known TFs include YOX1, DIG1, TEC1,
and STE12 (24, 37). DIG1-STE12 is involved in the regulation of mating-specific genes (24). Kato et al. (30) suggested that SWI4, YOX1, SWI5, DIG1, and STE12 function during this phase. Our methods indicate that SWI4, SWI5, YOX1, TEC1, DIG1, and STE12 (the synergistic pair DIG1-STE12) function at this phase.
Some TFs are present at many phases in the cell cycle. For example, let us consider FKH2. Genes in GFKH2 have a higher
expression level than those in G⫺FKH2in the S, G2, and M phases
but have a lower expression level than those in G⫺FKH2in the M兾G1
and G1phases. Genes in GFKH2are expressed in the G1phase in two
patterns: genes in GFKH2,NDD1have a lower expression level than
genes in G⫺FKH2,⫺NDD1, whereas genes in GFKH2,SWI6have a higher
expression level than genes in G⫺FKH2,⫺SWI6. A TF can act as both
a repressor and an activator of gene expression by cooperating with different TFs, making it difficult to confirm in individual analysis. Such phenomenon is common in Fig. 1; for example, TEC1 in the M兾G1phase; PDR1, MET18, and HAP1 in the G1phase; SWI6
and MBP1 in the S phase; and HIR3 and YOX1 in the G2phase.
Conclusion
Our approach has the following features: (i) It can find both individual TFs and synergistic pairs of TFs that act under a specific condition; (ii) it can describe the regulatory behaviors of identified TFs and synergistic TF pairs; (iii) it can be applied to expression data with few arrays or even for a single time point; (iv) for synergistic pair analysis, our model takes the additive effects into account via the ANOVA model; and (v) a TF can be an activator or a repressor in different phases. These features make it simple to apply our methods to detect TFs in other functions or processes, such as stress response, metabolism, drug treatments, etc.
However, our approach has some limitations. First, the target genes of TFs are not simple to obtain. We collect the information from four TF databases and ChIP-chip data, which may not have been generated specifically for the cell cycle. The p value threshold of ChIP-chip experiments should be defined carefully to obtain correct target genes, and the conditions of ChIP-chip experiments have to be consistent with microarray data (such as the cell cycle condition in this study). In addition, there may exist some combi-natorial rules, such as the order and distance between two TF-binding sites, of the TF-binding-site motifs of two synergistic TFs. Lack of such information can reduce the sensitivity and accuracy of our inference. In the future, these limitations might be overcome when more data become available.
We thank Michael Zhang, Geoff Morris, and Josh Rest for suggestions. This study was supported by Academia Sinica and National Science Council) grants in Taiwan.
1. Simon, I., Barnett, J., Hannett, N., Harbison, C. T., Rinaldi, N. J., Volkert, T. L., Wyrick, J. J., Zeitlinger, J., Gifford, D. K., Jaakkola, T. S., et al. (2001) Cell 106, 697–708.
2. Iyer, V. R., Horak, C. E., Scafe, C. S., Botstein, D., Snyder, M. & Brown, P. O. (2001)
Nature 409, 533–538.
3. Horak, C. E., Luscombe, N. M., Qian, J., Bertone, P., Piccirrillo, S., Gerstein, M. & Snyder, M. (2002) Genes Dev. 16, 3017–3033.
4. Lee, T. I., Rinaldi, N. J., Robert, F., Odom, D. T., Bar-Joseph, Z., Gerber, G. K., Hannett, N. M., Harbison, C. T., Thompson, C. M., Simon, I., et al. (2002) Science
298,799–804.
5. Das, D., Banerjee, N. & Zhang, M. Q. (2004) Proc. Natl. Acad. Sci. USA 101, 16234–16239.
6. Chiang, D. Y., Moses, A. M., Kellis, M., Lander, E. S. & Eisen, M. B. (2003) Genome
Biol. 4, R43.
7. Keles, S., van der Laan, M. & Eisen, M. B. (2002) Bioinformatics 18, 1167–1175. 8. Phuong, T. M., Lee, D. & Lee, K. H. (2004) Bioinformatics 20, 750–757. 9. Banerjee, N. & Zhang, M. Q. (2003) Nucleic Acids Res. 31, 7024–7031. 10. Pilpel, Y., Sudarsanam, P. & Church, G. M. (2001) Nat. Genet. 29, 153–159. 11. Cherry, J. M., Adler, C., Ball, C., Chervitz, S. A., Dwight, S. S., Hester, E. T., Jia, Y.,
Juvik, G., Roe, T., Schroeder, M., et al. (1998) Nucleic Acids Res. 26, 73–79. 12. Wingender, E., Chen, X., Fricke, E., Geffers, R., Hehl, R., Liebich, I., Krull, M.,
Matys, V., Michael, H., Ohnhauser, R., et al. (2001) Nucleic Acids Res. 29, 281–283. 13. Zhu, J. & Zhang, M. Q. (1999) Bioinformatics 15, 607–611.
14. Mewes, H. W., Heumann, K., Kaps, A., Mayer, K., Pfeiffer, F., Stocker, S. & Frishman, D. (1999) Nucleic Acids Res. 27, 44–48.
15. Harbison, C. T., Gordon, D. B., Lee, T. I., Rinaldi, N. J., Macisaac, K. D., Danford, T. W., Hannett, N. M., Tagne, J. B., Reynolds, D. B., Yoo, J., et al. (2004) Nature 431, 99–104.
16. Spellman, P. T., Sherlock, G., Zhang, M. Q., Iyer, V. R., Anders, K., Eisen, M. B., Brown, P. O., Botstein, D. & Futcher, B. (1998) Mol. Biol. Cell 9, 3273–3297. 17. Storey, J. D. & Tibshirani, R. (2003) Proc. Natl. Acad. Sci. USA 100, 9440–9445. 18. Tavazoie, S., Hughes, J. D., Campbell, M. J., Cho, R. J. & Church, G. M. (1999) Nat.
Genet. 22, 281–285.
19. Higgins, J. J. (2003) An Introduction to Modern Nonparametric Statistics (Brooks兾 Cole, Pacific Grove, CA).
20. Breeden, L. L. (2003) Curr. Biol. 13, R31–R38.
21. Dohrmann, P. R., Butler, G., Tamai, K., Dorland, S., Greene, J. R., Thiele, D. J. & Stillman, D. J. (1992) Genes Dev. 6, 93–104.
22. O’Conallain, C., Doolin, M. T., Taggart, C., Thornton, F. & Butler, G. (1999) Mol.
Gen. Genet. 262, 275–282.
23. Moll, T., Tebb, G., Surana, U., Robitsch, H. & Nasmyth, K. (1991) Cell 66, 743–758. 24. Olson, K. A., Nelson, C., Tai, G., Hung, W., Yong, C., Astell, C. & Sadowski, I. (2000)
Mol. Cell. Biol. 20, 4199–4209.
25. Kumar, R., Reynolds, D. M., Shevchenko, A., Goldstone, S. D. & Dalton, S. (2000)
Curr. Biol. 10, 896–906.
26. Hollenhorst, P. C., Pietz, G. & Fox, C. A. (2001) Genes Dev. 15, 2445–2456. 27. Spector, M. S., Raff, A., DeSilva, H., Lee, K. & Osley, M. A. (1997) Mol. Cell. Biol.
17,545–552.
28. Koch, C., Moll, T., Neuberg, M., Ahorn, H. & Nasmyth, K. (1993) Science 261, 1551–1557.
29. Sherwood, P. W., Tsang, S. V. & Osley, M. A. (1993) Mol. Cell. Biol. 13, 28–38. 30. Kato, M., Hata, N., Banerjee, N., Futcher, B. & Zhang, M. Q. (2004) Genome Biol
5,R56.
31. Cho, R. J., Campbell, M. J., Winzeler, E. A., Steinmetz, L., Conway, A., Wodicka, L., Wolfsberg, T. G., Gabrielian, A. E., Landsman, D., Lockhart, D. J., et al. (1998)
Mol. Cell 2, 65–73.
32. Morgan, B. A., Bouquin, N., Merrill, G. F. & Johnston, L. H. (1995) EMBO J. 14, 5679–5689.
33. Ho, Y., Costanzo, M., Moore, L., Kobayashi, R. & Andrews, B. J. (1999) Mol. Cell.
Biol. 19, 5267–5278.
34. Sil, A. & Herskowitz, I. (1996) Cell 84, 711–722.
35. Bobola, N., Jansen, R. P., Shin, T. H. & Nasmyth, K. (1996) Cell 84, 699–709. 36. Frenz, L. M., Johnson, A. L. & Johnston, L. H. (2001) Mol. Gen. Genomics 266,
374–384.
37. Pramila, T., Miles, S., GuhaThakurta, D., Jemiolo, D. & Breeden, L. L. (2002) Genes
Dev. 16, 3034–3045.
38. Freeman, K. B., Karns, L. R., Lutz, K. A. & Smith, M. M. (1992) Mol. Cell. Biol. 12, 5455–5463.
39. Futcher, B. (2002) Curr. Opin. Cell Biol. 14, 676–683.
40. Koranda, M., Schleiffer, A., Endler, L. & Ammerer, G. (2000) Nature 406, 94–98. 41. Laabs, T. L., Markwardt, D. D., Slattery, M. G., Newcomb, L. L., Stillman, D. J. &
Heideman, W. (2003) Proc. Natl. Acad. Sci. USA 100, 10275–10280.
42. Hall, C., Nelson, D. M., Ye, X., Baker, K., DeCaprio, J. A., Seeholzer, S., Lipinski, M. & Adams, P. D. (2001) Mol. Cell. Biol. 21, 1854–1865.
43. Costanzo, M., Nishikawa, J. L., Tang, X., Millman, J. S., Schub, O., Breitkreuz, K., Dewar, D., Rupes, I., Andrews, B. & Tyers, M. (2004) Cell 117, 899–913. 44. Costanzo, M., Schub, O. & Andrews, B. (2003) Mol. Cell. Biol. 23, 5064–5077. 45. Oehlen, L. & Cross, F. R. (1998) FEBS Lett 429, 83–88.